Abstract
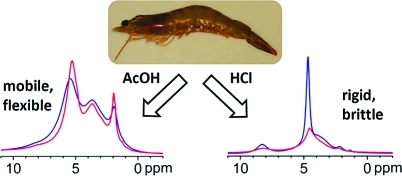
Modern solid-state NMR techniques, combined with X-ray diffraction, revealed the molecular origin of the difference in mechanical properties of self-associated chitosan films. Films cast from acidic aqueous solutions were compared before and after neutralization, and the role of the counterion (acetate vs Cl−) was investigated. There is a competition between local structure and long-range order. Hydrogen bonding gives good mechanical strength to neutralized films, which lack long-range organization. The long-range structure is better defined in films cast from acidic solutions in which strong electrostatic interactions cause rotational distortion around the chitosan chains. Plasticization by acetate counterions enhances long-range molecular organization and film flexibility. In contrast, Cl− counterions act as a defect and impair the long-range organization by immobilizing hydration water. Molecular motion and proton exchange are restricted, resulting in brittle films despite the high moisture content.
1. Introduction
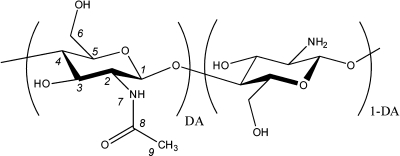
Chitin, the second most abundant natural polysaccharide, is synthesized by a number of living organisms and is the major structural component in the exoskeleton of arthropods and cell walls of fungi and yeast. The main commercial sources of chitin are crab and shrimp shells, which are abundantly supplied as waste products of the seafood industry.(1) Because chitin is not readily dissolved in common solvents, it is often converted to its partially deacetylated derivative, chitosan, a copolymer of glucosamine and N-acetylglucosamine (Figure 1). Chitin and chitosan are biocompatible, biodegradable, and nontoxic and have antimicrobial and hydrating properties. Chitosan is easily processed into films, gels, nanofibers, beads, microparticles, nanoparticles, and scaffolds and, thus, widely used for biomedical and pharmaceutical applications, tissue engineering, controlled drug delivery, biotechnology, and in the food industry.2−4
Figure 1.
Chitosan molecular structure. DA is the degree of acetylation.
Chitosan can be formed into hydrogels or films using an external cross-linker, but it can also undergo a self-cross-linking process. The organization of the chitosan self-cross-linked structure is due to inter- and intramolecular associations via hydrogen bonding or hydrophobic interactions and has been the subject of numerous studies.5−11 Nevertheless, the self-cross-linking mechanism remains incompletely solved. The intra- and intermolecular interactions also govern the macroscopic thermal and mechanical properties of chitosan films; therefore, it is important to elucidate them. Due to the hygroscopic nature of chitosan,(12) it always contains residual water (more strongly bound to hydroxyl than to amine groups(13)), and its characterization must be performed at defined moisture content.14,15 The residual water impairs the determination of the glass-transition and secondary relaxation phenomena in this semicrystalline polysaccharide, explaining the scatter of published data obtained by differential scanning calorimetry (DSC), dynamic mechanical analysis (DMA) and dielectric relaxation spectroscopy (DRS).16−20 This variation is related to the complex structure in chitosan via the local dynamics, which is still to be elucidated.
NMR is one of the most powerful techniques to access to site-specific structure and dynamics of complex molecular architectures. 1H, 13C, and 15N NMR in solution and in the solid state have being widely used to quantify the degree and sequences of chitosan acetylation.21−25 Other less common studies have also been reported, such as, interactions of chitosan with cross-linking agents,(26) water(27) and plasticizers,(28) studies of new chitosan copolymers structures,(29) and conformational studies.(30) However, the local dynamics and interactions in self-cross-linked chitosan films have not yet been reported by solid-state NMR. Solid-state NMR experiments performed under fast magic angle spinning (MAS) provide new and versatile spectroscopic tools, taking advantage of the significant simplification of the dipolar-coupled multispin network due to its decoupling performance. Recoupling techniques that involve appropriate pulse sequences have been applied along with fast MAS to obtain structural and dynamics information inherent to 1H−1H and 1H−13C dipolar couplings, recovering relevant interactions selectively.(31) Specifically, the rotational-echo double-resonance (REDOR) is a recoupling technique routinely used to study biological systems, for example, to obtain internuclear distance constraints between labeled spin pairs in biomolecules.(32) Hydrogen bonding structures in supramolecular systems have been studied through the recoupling of homonuclear dipole−dipole interactions using the so-called back-to-back pulse sequence for 1H double quantum (DQ) spectroscopy experiments.(33) In such a two-dimensional experiment, double quantum coherences due to pairs of dipolar coupled protons are correlated with single quantum coherences, resulting in correlation peaks characteristic for 1H−1H pairs. A variant of the REDOR sequence can be implemented to recouple coherent polarization transfer for heteronuclear single-quantum correlation experiment to identify the directly bonded carbon resonances.(34)
Even though the overall mechanism occurring in the formation of self-assembling chitosan films and gels is partially identified, little is known about the interactions that remain after their formation, and about their influence on the physicochemical properties of the films. We aim at gaining insight into the complex self-association network in chitosan films cast from dilute solutions of a weak and a strong acid at approximately the same concentration. Non-neutralized and neutralized films exhibit very different mechanical properties. Their systematic study with modern NMR techniques will probe their local structure and dynamics. Complemented by the mechanical properties investigated by DMA and the long-range organization studied by XRD, it will shed light on the molecular interactions in solid chitosan films and the role of the possible counterion.
2. Experimental Section
2.1. Sample Preparation
Chitosan was purchased from Aldrich (medium molecular weight, catalog number 448877, batch 09303PE). Its degree of acetylation DA (see Figure 1) of 31% and its molecular weight of 240 kDa were previously measured by 13C solid-state NMR and viscosimetry, respectively.(35) It was used to prepare 3 w/v % chitosan solutions (above the entanglement concentration, experimentally found as ≈1.2 w/v %(36)) using two types of dilute acids: 0.17 M acetic acid (AcOH) and 0.12 M hydrochloric acid (HCl). Films were cast from these solutions and dried at room temperature. The neutralization of the films was performed by immersing the dried films in a 1 w/v % solution of NaOH and then thoroughly washing with distilled water. The dried films were equilibrated under 44% controlled relative humidity in a desiccator with a saturated solution of K2CO3. Films are denoted FHCl (film cast from HCl solution), FAcOH (film cast from acetic acid solution), FNHCl (film cast from HCl solution then neutralized), and FNAcOH (film cast from acetic acid solution then neutralized).
Note that films were also cast from more dilute solutions of chitosan (1 w/v %, below the entanglement concentration, with all other parameters unchanged); the NMR spectra recorded show no significant difference with the films prepared from 3 w/v % chitosan solution and will only be shown in Supporting Information.
2.2. Thermogravimetric Analysis (TGA)
TGA measurements were carried out on a TGA 500 (TA Instruments). The moisture content was measured by heating the samples to 120 °C under nitrogen atmosphere using a ramp of 2 °C·min−1; at this temperature, an isotherm was kept for 60 min. The percentage of moisture was calculated from the weight lost at the end of the isotherm. To study the films degradation with temperature, samples were run in air from 50 to 800 °C, using a ramp of 10 °C·min−1.
2.3. Nuclear Magnetic Resonance (NMR)
15N cross-polarization under magic-angle spinning (CP-MAS) NMR experiments were performed on a Bruker Avance II console operating at 300 MHz 1H Larmor frequency with a commercial double resonance probe supporting zirconia MAS rotors with 4 mm outer diameter at a MAS spinning frequency of 10 kHz and 62.5 RF nutation frequency (5 μs 90° pulse length), 5 ms contact time, and 5 s relaxation delay. 13C CP-MAS NMR experiments were performed on a Bruker Avance console operating at 500 MHz 1H Larmor frequency with a commercial double resonance probe supporting zirconia MAS rotors with 2.5 mm outer diameter at a MAS spinning frequency of 25 kHz and 125 RF nutation frequency (2.5 μs 90° pulse length), 1 ms contact time, and 5 s relaxation delay. 1H MAS NMR experiments were performed on a Bruker Avance III console operating at 850 MHz 1H Larmor frequency with a commercial double resonance probe supporting zirconia MAS rotors with 2.5 mm outer diameter at a MAS spinning frequency of 30 kHz and 125 RF nutation frequency (2.5 μs 90° pulse length). 1H double quantum correlation spectra as well as REDOR-based heteronuclear (1H−13C) correlation spectra were recorded at 50 kHz MAS and 700 MHz 1H Larmor frequency on a Bruker Avance spectrometer using a Bruker 1.3 mm double resonance MAS probe with 140 kHz RF nutation frequency (1.8 μs 90° pulse length). Double quantum excitation was achieved using the Back-to-Back recoupling pulse sequence with 40 μs recoupling time, whereas the REPT-HSQC sequence has been applied for 1H−13C heteronuclear correlation experiments with 80 μs recoupling time.
2.4. Dynamic Mechanical Analysis (DMA)
The mechanical properties were measured with a TA Instruments DMA Q800, using the tension clamp for rectangular film and a temperature sweeping from 40 to 200 °C, under the following conditions: heating ramp 3 °C·min−1, initial strain 0.01%, preload force 0.3 N, and frequency 1 Hz. Three measurements were done for each film.
2.5. X-ray Diffraction (XRD)
Diffractograms were obtained in a Phillips PANalytical X’PertPro MPD, with a wavelength of 1.542 Å (Cu Kα11 radiation), a 2θ range from 5 to 50°, and a resolution of 0.013°. Diffractograms were normalized with sample amount.
3. Results and Discussion
3.1. Moisture Content
The moisture content was evaluated by the decrease of sample weight at the end of an isotherm at 120 °C. The stabilization of weight lost within the first 60 min of the isotherm confirmed that this program was accurate in terms of moisture determination. 120 °C was low enough to prevent thermal degradation of the materials. The moisture content was 16% for FAcOH and 18% for FHCl, while for the neutralized films was lower: 13% for the FNAcOH and 12% for FNHCl. The moisture content of the chitosan powder was 10%. Although the moisture content is similar, it is slightly higher for the protonated films, which may be explained by the hydrophilicity of the NH3+ groups. The quantified moisture contents are considered to be low moisture content.(14)
3.2. Solid-State NMR Results
3.2.1. 15N and 13C NMR
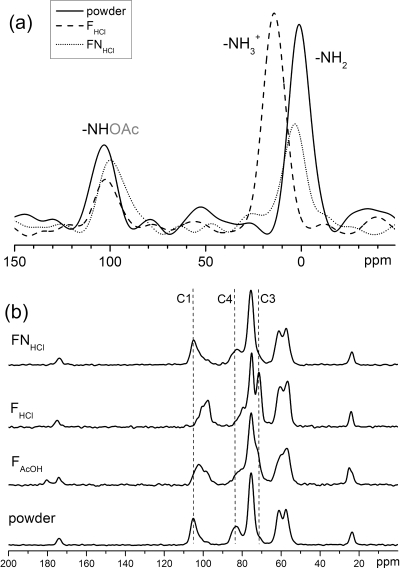
In diluted acidic media, chitosan contains glucosamine units both in the protonated and neutral amine forms. With a weak acid, such as acetic acid, a fraction of the amine groups will be protonated, whereas all amine groups will be protonated with a strong acid, such as hydrochloric acid. The films cast from chitosan solutions could thus contain charged and neutral amine groups. 15N CP-MAS spectra allow for a direct detection of each monomer unit: the acetylated amine at about 100 ppm, the amine between 0 and 15 ppm (Figure 2a). It also discriminates between charged and neutral amine groups, detected respectively at 15 and 0 ppm. It is experimentally observed that the films directly cast from chitosan solutions in HCl are charged, while the original powder and the films suspended in dilute NaOH solutions and rinsed are neutral.
Figure 2.
Solid-state NMR spectra of chitosan powder and films: 15N CP-MAS (a) and 13C CP-MAS (b). Vertical dashed lines in (b) are a guide to the eye.
13C CP-MAS NMR spectra show “snapshots” of the distribution of chemical shifts present in the sample. 13C CP-MAS spectra were recorded on the original powder, films prepared with acetic acid and HCl, and neutralized films (see Figure 2b for representative spectra and Supporting Information for all spectra). Powder and neutral films all exhibit the same 13C CP-MAS spectrum. A full chemical shift assignment can be found in the literature.(21) Two more signals are present in films prepared with acetic acid (C9 at 25 ppm, C8 at 180 ppm) due to residual acetic acid. Charged films exhibit some signals shift as compared to neutral ones, and these shifts are stronger for FHCl than for FAcOH. The signal of C1 originally at 105 ppm shifts to 100 ppm then 98 ppm, the signal of C4 originally at 83 ppm shifts to 82 then 81 ppm, the signal of C3 originally at about 74 ppm shifts to 72.5 then 71.5 ppm. Such shifts were already observed(30) and assigned to different helical structures in the solid. It will be discussed below (section 3.4) that both FHCl and FAcOH exhibit the same XRD diffractogram (albeit with different intensities), thus, it can hardly be concluded the signals shifts originate in such a radical structural change. To check if the signals shifts were not merely a result of the various degrees of protonation of the chitosan, chemical shifts observed in 13C CP-MAS were compared to published chemical shift values measured in solution. Chitosan is not soluble in water unless it is charged, thus only spectra recorded in acidic solutions can be compared. Signals of C1, C4, C3, and C2 were observed at 98, 78, 71, and 56, respectively, in D2O with AcOD,(37) while they were observed at 100, 80, 73, and 58 in D2O with DCl.(38) The signal of C2 is not expected to shift with pH (it does not shift in 13C CP-MAS), thus, the published spectra are simply calibrated differently, and the signals of C1, C4, and C3 in solution do not depend on whether the acid is strong (DCl) or weak (AcOD). Therefore, the shifts observed with 13C CP-MAS are due to packing effects. The strongest effect is observed on the signals of C1 and C4, which are the carbons linking adjacent glucosamine rings with a glucosidic bond. Thus, it can be explained by a rotational distortion around the main chain, the presence of the charge introducing strong electrostatic interactions which could hinder the packing of the chain following the usual hydrogen bonding pattern. The more charged film, FHCl, thus, exhibits stronger rotational distortions and stronger signals shifts than FAcOH. The local mobility in films will be examined below. A smaller shift is observed for C3, which is spatially close to the charge.
15N and 13C NMR measurements indicated charge and conformational changes in the films, and opened questions on the local molecular dynamics. 1H NMR was employed to investigate the dynamics in the films and the different association mechanisms.
3.2.2. One-Dimensional 1H NMR
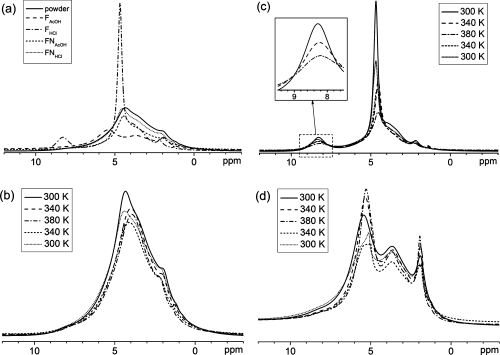
1H MAS spectra were recorded at different temperatures on the original powder, films prepared with acetic acid and HCl and neutralized films at high magnetic field under fast MAS (see Figure 3 for representative spectra and Supporting Information for all spectra). At room temperature (Figure 3a), all samples apart from FHCl exhibit broad signals due to a large range of local packing arrangements. In FNAcOH, the acetate was washed away. In FHCl, the much more narrow linewidths clearly reveal an NH3+ signal at 8.5 ppm (and a methyl signal at 2.2 ppm).
Figure 3.
1H MAS NMR spectra of various samples at 300 K (a), temperature-dependent 1H MAS NMR spectra recorded for the powder (b), FHCl (c), and FAcOH (d). For temperature-dependent spectra, the spectra were acquired in the order of the legend (top to bottom). The insert in (c) shows a zoom in the NH3+ signals recorded upon heating.
The temperature behavior of the powder and the neutralized films are the same (see Figure 3b and Supporting Information). The only significant change observed upon heating is a reversible broadening of the signal originally at 4.3 ppm, accompanied by its reversible shift to 3.9 ppm. This signal originates in the residual water and the OH groups of chitosan (as confirmed by its disappearance in a chitosan powder deuterated by suspension in D2O, see Supporting Information). Note that this signal is weaker after cooling down, probably due to partial evaporation of the residual water. The rather unusual line broadening upon heating indicates that the water molecules and the OH groups in the sample are in the slow exchange limit with another site in the sample, most likely the NH2 groups. Here, the slow exchange limit means: there is basically no 1H exchange taking place at room temperature on the time scale of the experiment, and local molecular motions as well as chemical exchange of protons start on that time scale upon heating.
The narrow signals of sample FHCl (Figure 3c) could originate either in a strong local mobility (resulting in limited line broadening) or in a well-organized local structure (resulting in a limited distribution of chemical shifts). As above, the broadening of this signal upon heating indicates limited mobility at room temperature, and the onset of local motion or chemical exchange at higher temperatures. The higher resolution obtained for this sample allows observing that only two signals broaden upon heating, to a similar extent: the signal of residual water and OH groups at 4.7 ppm on one hand, and the NH3+ signal at 8.3 ppm on the other hand. Furthermore, the NH3+ signal shifts upfield toward the signal of residual water and OH groups (see insert), while the signal of residual water and OH groups shifts upfield (as a result of a shift downfield toward the NH3+ signal and a stronger shift upfield due to the temperature increase). This supports the interpretation of a chemical exchange taking place between these. The narrow NH3+ signal observed for FHCl compared to NH2 in other samples (around 8 ppm) is due to a greater distribution of chemical shifts for NH2 due to a large variety of hydrogen bonding structures in other samples, as opposed to more similar electrostatic interactions through NH3+ in FHCl. Interestingly, FHCl is the film with the highest moisture content but not the film with the highest mobility, although water could be expected to plasticize the film. This indicates that a significant part of the residual water is immobilized in this particular sample. As it is not the case to that extent in the other samples, it may be bound to the Cl− counterion.
In FAcOH, the signals of the acetate (5.3 ppm and 2.1 ppm) become narrower upon heating (Figure 3d), as is expected when the local molecular motion becomes faster. Thus there is a significantly stronger mobility in FAcOH than in all the other samples. It can be concluded that more than the charge, the counterion plays a significant role in the local dynamics in chitosan films. The acetate counterion’s charge is delocalized over the carboxylic acid group, the ion is larger and has more degrees of freedom (thus, can act as a plasticizer).
3.2.3. Two Dimensional 1H NMR
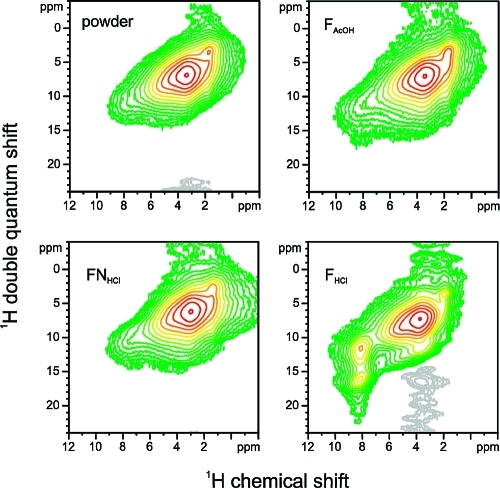
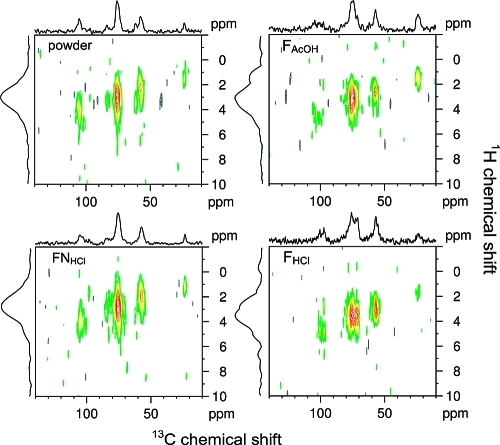
For all chitosan powder and films, a strong autocorrelation of the overlapping signals around 4 ppm is observed through a strong signal on the diagonal (Figure 4). This massif contains all groups except NH3+. The autocorrelation indicates that the corresponding moieties are chemically stable and stay in close proximity on the time scale of the experiment (40 μs). FHCl differs from all other samples by two features: a strong autocorrelation for the NH3+ group at 8.3 ppm (signal on diagonal) and a correlation of this signal with the signals around 4 ppm (via a signal at (8.3 ppm, 12 ppm)). This indicates that the NH3+ group is chemically stable over a time scale of 40 μs at room temperature and that the film is rigid enough to see its correlation with other moieties. It implies that the amine groups are all protonated, otherwise, there would be a chemical exchange taking place between NH2 and NH3+ groups, which would lead to a loss of the autocorrelation signal of NH3+. This acid−base exchange is taking place in FAcOH, in which the amine groups are only partially charged, as indicated by the 13C CP-MAS spectra. In FHCl, the moieties with which the NH3+ group correlates are the water immobilized in the hydration shell of the Cl− counterion of the NH3+ group.
Figure 4.
Two-dimensional 1H DQ MAS NMR correlation spectra for the chitosan films and powder recorded with the back-to-back sequence and a recoupling time of 40 μs.
3.2.4. Two Dimensional 1H−13C NMR
The chitosan powder, FAcOH and FNHCl show the strongest dipolar interaction between 75 and 80 ppm, which corresponds to C5 and a weaker dipolar interaction between 50 and 60 ppm, corresponding to C2 carbons (Figure 5). The relative rigidity of these two carbons is mostly intrinsic of the chitosan structure, as they indicate the rigidity of the glucose ring. Furthermore, earlier X-ray diffractions studies39,40 indicated strong intramolecular hydrogen bonding in chitosan through oxygen bound to C5 and the amino group bound to C2 carbons. In FHCl, there is an additional strong signal around 70−75 ppm corresponding to C3, and an increase in the interaction for the C2 carbons (near 55 ppm). This indicates the rigidity around the NH3+ group and the hydration shell of its Cl− counterion.
Figure 5.
1H−13C HSQC REPT correlation spectra for the chitosan films and powder, recorded with a recoupling time of 80 μs.
3.3. DMA Results
FHCl exhibits different properties from the other films, as it is visually more brittle. All films were investigated with DMA at different temperatures to investigate their viscoelastic behavior in more detail. Storage moduli E′ are summarized in Table 1. E′ is higher for FHCl than for FAcOH, while FNHCl and FNAcOH exhibit an intermediate behavior. This confirms the visual stiffness of FHCl compared to the other films, due to the strong electrostatic interactions around the NH3+ groups and their Cl− counterions, immobilizing hydration water. In FNAcOH and FNHCl the chain−chain interactions lead to an intermediate stiffness, while in FAcOH the acetate counterion acts as a plasticizer, imparting more elasticity and flexibility to this film.
Table 1. Storage Moduli E′ Measured at Different Temperatures by DMA (Average of Three Measurements).
|
E′ (GPa) |
||||
|---|---|---|---|---|
| T (°C) | FHCl | FNHCl | FAcOH | FNAcOH |
| 50 | 4.1 ± 0.2 | 2.6 ± 0.6 | 1.7 ± 0.2 | 3.4 ± 0.4 |
| 100 | 4.2 ± 0.4 | 2.3 ± 0.5 | 1.8 ± 0.2 | 2.9 ± 0.3 |
| 195 | 2.2 ± 0.4 | 2.1 ± 0.2 | 2.5 ± 0.2 | |
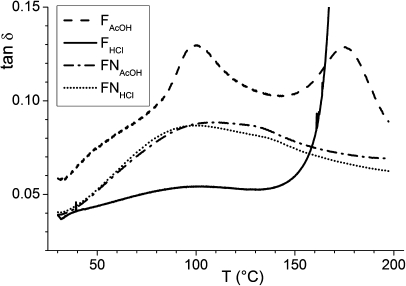
The temperature dependence is shown for the loss tangents (tan δ) in Figure 6. The loss factor for FAcOH has two maxima at ∼95 and ∼172 °C, which can be related to conformational relaxations. FHCl only exhibits a very weak transition at ∼100 °C and ruptures at ∼170 °C, while for the neutralized films FNHCl and FNAcOH, there are two overlapping broad relaxations with maxima at ∼97 and 104 °C. The relaxation observed at ∼97 °C has been assigned in previous dielectric spectroscopy studies to water desorption(12) and to conduction via H+ migration.(20) Its stronger intensity in FAcOH than in FNAcOH and FNHCl can be explained by its higher moisture content and the rapid chemical exchange between NH2 and NH3+ groups. The film with the highest moisture content, FHCl, however, does not follow this trend. We have demonstrated above that the water molecules in FHCl are tightly bound to the chitosan and its Cl− counterion, thus, the loss of water by this film is very limited around 100 °C. Furthermore, all amine groups are protonated in FHCl, strongly limiting the possibility of chemical exchange between NH2 and NH3+ groups. The strong attenuation of the first relaxation for FHCl thus, indicates that water and H+ are more strongly bound in this film.
Figure 6.
Variation of the loss tangent with temperature for the chitosan films.
The transition around 170 °C is only seen for the charged films. It is pronounced for FAcOH, and it is only beginning for FHCl when the film ruptures. To the best of our knowledge, this transition was not reported before. It could be linked to hydrogen bonding (which exists at high temperatures, provided the samples are rigid enough) or to electrostatic interactions due to the presence of the NH3+ groups. Work is in progress to record NMR data in this temperature range to gain molecular information. The rupture of FHCl at a temperature at which the other films are stable correlates with the onset of its decomposition at about 400 °C (compared to ca. 500 °C for the other films), as observed by TGA.
These differences in DMA behavior lead us to conclude that the NH3+ and NH2 side groups have a drastic influence on the local dynamics. They determine the relative amount of the more strongly bound water and the nature of the hydrogen bonding network formed between chitosan moieties and water.
3.4. XRD Results
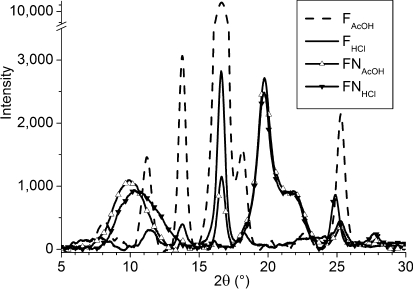
Five crystalline reflections are reported in the 2θ range of 5−40° for highly acetylated chitosan (or chitin).(41) The chitosan powder used here shows a more amorphous structure than chitin (see Supporting Information), with two wide reflections in 2θ at 9.9° (d-spacing 8.87 Å) and 20.10° (d-spacing 4.44 Å). This is expected from its relatively low degree of acetylation (31%) and from the fact that chitin is usually dissolved to produce chitosan. The X-ray diffractograms of all the films are shown in Figure 7. Neutralized chitosan films show a diffraction pattern of an amorphous structure, similar to the chitosan powder, displaying two main reflections of low intensity in 2θ at 10.5° and 19.8°. They are much less organized than acidic films, as indicated by broader reflections. Both FHCl and FAcOH exhibit sharp reflections in 2θ at 11.2, 13.8, 16.6, and 25.3°, indicating a better organized long-range structure. The reflections are significantly more intense for FAcOH, demonstrating a better long-range ordering in this film than in FHCl. There is an apparent contradiction in stating that charged films tend toward a much more regular long-range order but that the least charged one is the best organized. It can be rationalized by taking into account that the strong rigidity of FHCl may prevent the structure to reorganize, which is needed to accomplish long-range order.
Figure 7.
X-ray diffractograms of chitosan films.
Note that the variations in 13C CP-MAS spectra with the acid solution from which the films were cast (HCl and AcOH) had been previously assigned to different helical structures.(30) However, they exhibit the same X-ray diffractogram, thus, the same structure. We have shown here that this is due to restricted mobility in FHCl, hindering the long-range organization of the film in the structure it tends to. This is in agreement with the previously observed increase in the intensity of the X-ray reflections upon annealing,(30) which we can now assign to a better long-range organization owing to increase local mobility.
4. Conclusions
Modern solid-state NMR techniques, combined with X-ray diffraction, revealed the molecular origin of the difference observed in macroscopic properties of chitosan films. Films cast from acidic aqueous solutions were compared before and after neutralization, and the role of the counterion (acetate vs Cl−) was investigated. There is a competition between local structure and long-range order in self-associated chitosan films. Neutralized films exhibit a molecular structure similar to that of the original chitosan powder, not organized on the long-range, mediated through intra- and intermolecular hydrogen bonding. These films show good mechanical strength and elasticity. The chitosan is fully charged in films cast from HCl, while it is only partially charged in films cast from acetic acid. The long-range structure is better defined in films cast from acid solutions, in which the presence of charges induces strong electrostatic interactions and rotational distortion around the main chain, stronger in the case of HCl. The large acetate counterion with a delocalized charge plasticizes the films enabling a good long-range molecular organization, as well as increased film flexibility. The Cl− counterion acts as a defect and impairs the long-range organization by strongly immobilizing water in its hydration shell. Both the molecular motion and the proton exchange are very restricted, resulting in the film being stiff and brittle, although it exhibits the highest moisture content of all films.
The changes in local conformation and dynamics introduced by the charge in the chitosan chain are reversible. The increase in mobility and in proton exchange in the films upon heating is also reversible, even after partial moisture evaporation. The chitosan concentration in the initial solution does not affect the structure and dynamics in the films, as shown by the similar behavior of films cast from chitosan solution below and above the entanglement concentration. A relaxation process was detected at about 170 °C for charged films, resulting in film rupture in the case of HCl. It could be linked to hydrogen bonding or to electrostatic interactions; NMR data are needed in this temperature range to reach any further conclusions.
The innovative methodology developed in this work can be extended to the investigation of the effect of other parameters on the interactions in self-association chitosan systems. Films obtained at higher degrees of acetylation, hydrogels obtained at higher moisture content, should exhibit different local structure and dynamics, which are expected to change the macroscopic properties. It will be the subject of further studies.
Acknowledgments
We are grateful to the Deutscher Akademischer Austausch Dienst (DAAD), the University of Antioquia, and the Max Planck Society for financial support.
Supporting Information Available
Solid-state NMR spectra, TGA and DMA thermograms, and X-ray diffractogram. This material is available free of charge via the Internet at http://pubs.acs.org.
Supplementary Material
References
- Rinaudo M. Prog. Polym. Sci. 2006, 31, 603–632. [Google Scholar]
- Jayakumar R.; Prabaharan M.; Nair S. V.; Tamura H. Biotechnol. Adv. 2010, 28, 142–150. [DOI] [PubMed] [Google Scholar]
- Lauto A.; Mawad D.; Barton M.; Gupta A.; Piller S. C.; Hook J. Biomed. Eng. Online 2010, 9, 47. [DOI] [PMC free article] [PubMed] [Google Scholar]
- Park J. H.; Saravanakumar G.; Kim K.; Kwon I. C. Adv. Drug Delivery Rev. 2010, 62, 28–41. [DOI] [PubMed] [Google Scholar]
- Draget K. I. Polym. Gels Network 1996, 4, 143–151. [Google Scholar]
- Vachoud L.; Zydowicz N.; Domard A. Carbohydr. Res. 1997, 302, 169–177. [DOI] [PubMed] [Google Scholar]
- Lauto A.; Hook J.; Doran M.; Camacho F.; Poole-Warren L. A.; Avolio A.; Foster L. J. R. Lasers Surg. Med. 2005, 36, 193–201. [DOI] [PubMed] [Google Scholar]
- Hirano S.; Yamaguchi R. Biopolymers 1976, 15, 1685–1691. [DOI] [PubMed] [Google Scholar]
- Montembault A.; Viton C.; Domard A. Biomaterials 2005, 26, 933–943. [DOI] [PubMed] [Google Scholar]
- Amiji M. M. Carbohydr. Polym. 1995, 26, 211–213. [Google Scholar]
- Novoa-Carballal R.; Fernandez-Megia E.; Riguera R. Biomacromolecules 2010, 11, 2079–2086. [DOI] [PubMed] [Google Scholar]
- Nogales A.; Ezquerra T. A.; Rueda D. R.; Martinez F.; Retuert J. Colloid Polym. Sci. 1997, 275, 419–425. [Google Scholar]
- Rueda D. R.; Secall T.; Bayer R. K. Carbohydr. Polym. 1999, 40, 49–56. [Google Scholar]
- Appelqvist I. A. M.; Cooke D.; Gidley M. J.; Lane S. J. Carbohydr. Polym. 1993, 20, 291–299. [Google Scholar]
- Mucha M.; Ludwiczak S.; Kawinska A. Carbohydr. Polym. 2005, 62, 42–49. [Google Scholar]
- Dong Y. M.; Ruan Y. H.; Wang H. W.; Zhao Y. G.; Bi D. X. J. Appl. Polym. Sci. 2004, 93, 1553–1558. [Google Scholar]
- Einfeldt J.; Meissner D.; Kwasniewski A. Prog. Polym. Sci. 2001, 26, 1419–1472. [Google Scholar]
- Gonzalez-Campos J. B.; Prokhorov E.; Luna-Barcenas G.; Sanchez I. C.; Kovalenko Y. Macromol. Symp. 2009, 283−84, 199–204. [Google Scholar]
- Mano J. F. Macromol. Biosci. 2008, 8, 69–76. [DOI] [PubMed] [Google Scholar]
- Viciosa M. T.; Dionisio M.; Silva R. M.; Reis R. L.; Mano J. F. Biomacromolecules 2004, 5, 2073–2078. [DOI] [PubMed] [Google Scholar]
- Heux L.; Brugnerotto J.; Desbrieres J.; Versali M. F.; Rinaudo M. Biomacromolecules 2000, 1, 746–751. [DOI] [PubMed] [Google Scholar]
- Kasaai M. R. Carbohydr. Polym. 2010, 79, 801–810. [Google Scholar]
- Varum K. M.; Anthonsen M. W.; Grasdalen H.; Smidsrod O. Carbohydr. Res. 1991, 217, 19–27. [DOI] [PubMed] [Google Scholar]
- Domard A.; Gey C.; Rinaudo M.; Terrassin C. Int. J. Biol. Macromol. 1987, 9, 233–237. [Google Scholar]
- Fernandez-Megia E.; Novoa-Carballal R.; Quinoa E.; Riguera R. Carbohydr. Polym. 2005, 61, 155–161. [Google Scholar]
- Monteiro O. A. C.; Airoldi C. Int. J. Biol. Macromol. 1999, 26, 119–128. [DOI] [PubMed] [Google Scholar]
- Capitani D.; Crescenzi V.; De Angelis A. A.; Segre A. L. Macromolecules 2001, 34, 4136–4144. [Google Scholar]
- Domjan A.; Bajdik J.; Pintye-Hodi K. Macromolecules 2009, 42, 4667–4673. [Google Scholar]
- De Angelis A. A.; Capitani D.; Crescenzi V. Macromolecules 1998, 31, 1595–1601. [Google Scholar]
- Saito H.; Tabeta R.; Ogawa K. Macromolecules 1987, 20, 2424–2430. [Google Scholar]
- Schnell I.; Spiess H. W.. 1H Solid-State NMR of Supramolecular Systems. In Modern Magnetic Resonance, Webb G. A., Ed. Springer Verlag: New York, 2008; Part III, pp 1499−1506. [Google Scholar]
- Gullion T.; Schaefer J. J. Magn. Reson. 1989, 81, 196–200. [Google Scholar]
- Brown S. P.; Zhu X. X.; Saalwachter K.; Spiess H. W. J. Am. Chem. Soc. 2001, 123, 4275–4285. [DOI] [PubMed] [Google Scholar]
- Goward G. R.; Saalwachter K.; Fischbach I.; Spiess H. W. Solid State Nucl. Magn. Reson. 2003, 24, 150–162. [DOI] [PubMed] [Google Scholar]
- Gartner C.; Pelaez C. A.; Lopez B. L. e-Polym. 2010, 069. [Google Scholar]
- Gartner C.; Lopez B. L. Rev. Fac. Ing., Univ. Antioquia 2010, 53, 20–29. [Google Scholar]
- Zhang K.; Helm J.; Peschel D.; Gruner M.; Groth T.; Fischer S. Polymer 2010, 51, 4698–4705. [Google Scholar]
- Kumirska J.; Weinhold M. X.; Sauvageau J. C. M.; Thoming J.; Kaczynski Z.; Stepnowski P. J. Pharm. Biomed. Anal. 2009, 50, 587–590. [DOI] [PubMed] [Google Scholar]
- Okuyama K.; Noguchi K.; Miyazawa T.; Yui T.; Ogawa K. Macromolecules 1997, 30, 5849–5855. [Google Scholar]
- Yui T.; Imada K.; Okuyama K.; Obata Y.; Suzuki K.; Ogawa K. Macromolecules 1994, 27, 7601–7605. [Google Scholar]
- Zhang Y. Q.; Xue C. H.; Xue Y.; Gao R. C.; Zhang X. L. Carbohydr. Res. 2005, 340, 1914–1917. [DOI] [PubMed] [Google Scholar]
Associated Data
This section collects any data citations, data availability statements, or supplementary materials included in this article.


