

Abstract
Adsorption of pulmonary surfactant to an air−water interface lowers surface tension (γ) at rates that initially decrease progressively, but which then accelerate close to the equilibrium γ. The studies here tested a series of hypotheses concerning mechanisms that might cause the late accelerated drop in γ. Experiments used captive bubbles and a Wilhelmy plate to measure γ during adsorption of vesicles containing constituents from extracted calf surfactant. The faster fall in γ reflects faster adsorption rather than any feature of the equation of state that relates γ to surface concentration (Γ). Adsorption accelerates when γ reaches a critical value rather than after an interval required to reach that γ. The hydrophobic surfactant proteins (SPs) represent key constituents, both for reaching the γ at which the acceleration occurs and for producing the acceleration itself. The γ at which rates of adsorption increase, however, is unaffected by the Γ of protein in the films. In the absence of the proteins, a phosphatidylethanolamine, which, like the SPs, induces fusion of the vesicles with the interfacial film, also causes adsorption to accelerate. Our results suggest that the late acceleration is characteristic of adsorption by fusion of vesicles with the nascent film, which proceeds more favorably when the Γ of the lipids exceeds a critical value.
Introduction
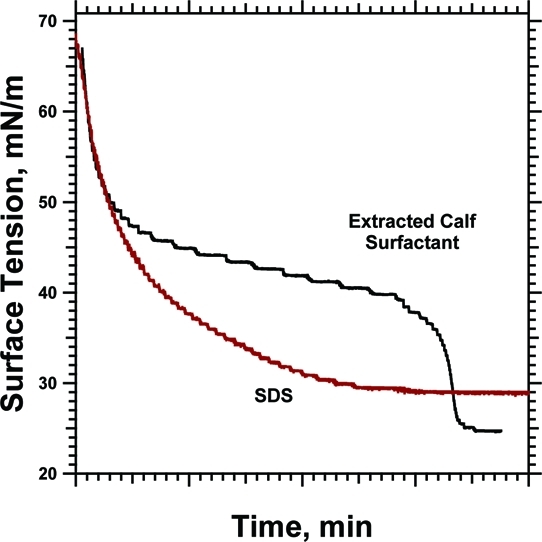
Surfactants normally adsorb to an air−water interface at rates that decrease as the surface tension (γ) falls [sodium dodecyl sulfate (SDS) in Figure 1]. Insertion into a more densely occupied surface occurs more slowly as γ approaches its equilibrium value (γe). Pulmonary surfactant initially demonstrates these kinetics, lowering γ at rates that progressively slow. The adsorption isotherms, however, can reach an inflection point, and during the final approach to γe, the slope can become substantially steeper1−6 (Figure 1). Adsorption is likely to be particularly important in this range of γ. In the lungs, where pulmonary surfactant exerts its biological function, when the alveolar air−water interface expands during inhalation, the rise of γ above γe is limited.7−13 The surfactant vesicles therefore most likely adsorb in the alveolus to an air−water interface that has the γ at which the acceleration occurs.
Figure 1.

Adsorption of CLSE to a constant interfacial area. A Wilhelmy plate measured the γ at 37 °C after aspirating the surface of a subphase containing vesicles dispersed by sonication in HSC with a phospholipid concentration of 100 μM. A control experiment with 7 mM SDS at 23 °C shows the behavior expected for standard surfactants. (A) Individual replicates of the γ−time adsorption isotherms. The superimposed dashed lines give the smoothed fit to the experimental data that provided the basis for differentiation. (B) Instantaneous slopes of the adsorption isotherms, found by differentiating the smoothed curves, plotted against γ.
Despite the likely importance of the unexpected accelerated decrease in γ, remarkably little information is available concerning its basic characteristics. The experiments here test a series of hypotheses concerning the basis of the late acceleration. Our studies emphasize in particular two fundamental issues: whether the late acceleration reflects a maturation of adsorbing material or changes in the characteristics of the interfacial film; and the extent to which the hydrophobic proteins, which greatly facilitate the adsorption of the surfactant lipids at all γ, are necessary and sufficient to cause the late acceleration. The results restrict the possible mechanisms by which the accelerated late adsorption can occur.
Materials and Methods
Materials
Dioleoyl phosphatidylcholine (DOPC) and dioleoyl phosphatidylethanolamine (DOPE) were obtained from Avanti Polar Lipids (Alabaster, AL) and used without further characterization or purification. The following reagents were obtained from commercial sources: SDS (Invitrogen, Carlsbad, CA); N-2-hydroxyethylpiperazine-N′-2-ethanesulfonic acid (HEPES) (Sigma, St. Louis, MO); NaCl, CaCl2; chloroform; and methanol (Mallinckrodt, Hazelwood, MO). Water was filtered and photo-oxidized with ultraviolet (UV) light using a NANOpure Diamond TOC-UV water-purification system (Barnstead/Thermolyne, Dubuque, LA). The following buffers were used routinely: 10 mM HEPES at pH 7.0 and 150 mM NaCl (HS); and 10 mM HEPES at pH 7.0, 150 mM NaCl, and 1.5 mM CaCl2 (HSC).
The hydrophobic constituents of calf surfactant [calf lung surfactant extract (CLSE)], obtained by extracting(14) the constituents of phospholipid aggregates collected by centrifugation from material lavaged from freshly excised calf lungs,(15) were provided by Dr. Edward Egan, ONY, Inc. (Amherst, NY). Subfractions of the constituents in CLSE were obtained by gel-permeation chromatography using a mobile phase of acidified chloroform/methanol [1:1:0.05 (v/v/v) chloroform/methanol/0.1 N HCl], which separates the hydrophobic surfactant proteins (SP-B and SP-C), the phospholipids, and the neutral lipids (cholesterol) into distinct peaks.16−18 Pooling the appropriate eluted fractions provides preparations containing the complete set of surfactant proteins and phospholipids (SP&PL) or the combined neutral and phospholipids (N&PL).18,19 Previous studies have shown that the phospholipids obtained by this procedure contain the same headgroups(18) and acyl constituents(20) as the original CLSE. If the eluting solvent contains no acid, the anionic phospholipids stick to the matrix, allowing collection of a fraction that includes the proteins with modified phospholipids that lack the anionic compounds (SP&mPL).(18) The proteins used in samples with DOPC were collected using the neutral solvent.
Methods
Dispersion
Films were formed on the bottom of test tubes by mixing the different constituents in chloroform or chloroform/methanol [1:1 (v/v)] and drying the films under a stream of nitrogen before evaporating the remaining solvent at reduced pressures. Initial studies concerning the role of the different constituents in CLSE used vesicles dispersed in aqueous media by probe-sonication of samples on ice. Subsequent experiments used material that was suspended initially by gentle vortexing after prolonged hydration, subjected to repeated cycles of freezing and thawing, and then extruded 11 times through a polycarbonate filter with pores of 100 nm (Whatman, Maidstone, U.K.). Extrusions were performed at 45 °C for CLSE and N&PL, and at room temperature (23 ± 1 °C) for samples containing purchased lipids. Dynamic light scattering (Protein Solutions Dynapro, Wyatt, Santa Barbara, CA) determined the hydrodynamic radii of the dispersed vesicles. Extruded vesicles of CLSE had a hydrodynamic radius of 93.8 ± 5.8 nm, while N&PL vesicles were smaller at 49.5 ± 3.9 nm. DOPE/DOPC vesicles had a hydrodynamic radius of 105 ± 32.2 nm, with a greater polydispersity than for the vesicles containing the surfactant constituents.
Captive Bubble
Most experiments used a captive bubble as a “surface balance”. The shape of the bubble viewed along the horizontal axis provides its surface area and γ.(21) The bubbles provided the significant advantage that their surface area could be varied, allowing measurements of adsorption during which γ was held constant. Because the bubbles float against an agarose ceiling, the bubbles had the theoretical disadvantage that some of the air−water interface might be inaccessible to adsorbing vesicles, and that the inaccessible fraction of the interface could change during adsorption when the variation of γ alters the shape of the bubble. The comparable results obtained with bubbles and with adsorption to an open interface (see below) suggested that any shift in accessible surface area made no contribution to our findings.
The previously described apparatus(22) for containing and monitoring the captive bubble was built from templates provided by Dr. Jon Goerke (University of California—San Francisco, San Francisco, CA). The instrument uses a modification(23) of the original instrument constructed by Schürch(21) and readily allows access for spreading of films at the surface of a ∼70−80 μL bubble.(24) Adsorption was initiated either by injecting small aliquots of concentrated vesicles prepared in HS, in which the absence of Ca2+ minimized fusion among vesicles, into a stirred subphase of HSC, or by formation of a bubble in a subphase already containing HSC and vesicles. Experiments with preformed monolayers first deposited <0.05 μL of sample in 1:1 (v/v) methanol/chloroform to produce a film with the desired γ. The subphase was then washed with HSC to remove the spreading solvent before injection of vesicular material.(24) Images obtained along the horizontal axis of the bubble provided its height and diameter, which were used to calculate γ and surface area using a semi-empirical approach based on the equation of Young and Laplace.(25) Programs written in LabVIEW (National Instruments, Austin, TX) performed real-time calculations of these variables, which could then be manipulated using a computer-controlled syringe pump to change the size of the bubble by infusing and withdrawing buffer from the enclosed subphase. To simplify the manipulations, most experiments used ambient temperatures (23 ± 1 °C). Experiments at 37 °C maintained temperature with heating pads (Minco, Minneapolis, MN) applied along the side of the chamber and regulated by a temperature-controller (Cole-Palmer, Vernon Hills, IL).
Open Interface
Experiments concerning the different preparations obtained from CLSE measured adsorption to the air−water interface above a subphase in a Teflon cup enclosed within a temperature-regulated chamber containing open water to maintain full humidification. These experiments used a Wilhelmy plate composed of filter paper monitored by a force transducer (Riegler and Kirstein GmbH, Potsdam, Germany) to determine γ. Measurements were calibrated with the moistened plate in air and minimally immersed in the subphase with a clean interface. Data were recorded to a computer using programs constructed with the graphical user interface LabVIEW. Experiments were initiated by aspirating the surface layer to create a clean interface above a subphase containing vesicles dispersed by sonication.1,26
Analysis of Adsorption Isotherms
The slopes of the isotherms were obtained using the program Igor (WaveMetrics, Lake Oswego, OR) first to smooth the curves using a fourth-order Savitsky−Golay algorithm, followed by differentiation.
Results
Vesicles of extracted calf surfactant (CLSE) at 37 °C lowered γ at rates that initially decreased in magnitude as adsorption progressed (Figure 1). At ∼40 mN/m, however, the adsorption isotherms reached an inflection point and the slopes became steeper. Control experiments with SDS demonstrated the behavior expected for standard surfactants, with γ falling at progressively slower rates until reaching a constant value (Figure 1).
Although present in many prior studies of adsorption,1,3−6 the absence of the late acceleration in some previously published reports raised the possibility that the phenomenon reflected some feature of the manner in which the experiments were conducted. We therefore tested the dependence of the late acceleration on the following aspects of our protocol.
-
(a)
Measurement of γ: Experiments obtained comparable results for adsorption to a captive bubble, the shape of which provided γ, and to the surface of a subphase in an open cup, using a Wilhelmy plate to monitor γ.
-
(b)
Initiation of adsorption: With the captive bubble, experiments initiated adsorption by injecting aliquots of concentrated CLSE into the subphase or by replacing a subphase of buffered electrolyte with a dispersion of CLSE. With the subphase in an open cup monitored with a Wilhelmy plate, adsorption began with either the injection of CLSE into the subphase or aspiration of the initial film from the surface above homogeneously dispersed CLSE.(26) In each case, the steeper slope was present at the end of adsorption.
-
(c)
Stirring: In comparison to adsorption from an unstirred subphase, stirring shortened the time to reach any γ and increased the variation among different experiments. Below ∼35 mN/m, however, the isotherms in the presence and absence of stirring became parallel, with steeper slopes in both cases.
-
(d)
Dispersion: Samples dispersed by sonication or extrusion, both of which yielded vesicles with a hydrodynamic radius of ∼100 nm for CLSE, produced comparable results. Dispersion by cyclic freezing and thawing, which should produce multilamellar vesicles (MLVs),(27) generated particles with the least evidence of a late acceleration. The adsorption isotherms for MLVs frequently included an inflection point at low γ, but the subsequent steepening of the slopes was always minimal. The late acceleration therefore most clearly represented a phenomenon of a single bilayer, which presumably is the initial step in the adsorption of a MLV.
The steeper slopes at the end of the adsorption isotherm could reflect the relationship between the surface concentration (Γ) and γ rather than a true increase in the rate of adsorption. If the slope of the γ−Γ isotherm became steeper close to γe, then at low values, γ would fall more quickly, despite adsorption at a constant rate. Increasing Γ produced by compression, however, showed only the previously reported,(28) roughly linear decrease in γ from shortly after lift-off to the onset of collapse (Figure 2). Assuming that γ had the same relationship to Γ during compression of a monolayer and during adsorption, the late accelerated fall in γ indicated a faster increase in Γ and more rapid adsorption.
Figure 2.

Compression isotherm of CLSE. Monomolecular films of CLSE were spread on a 0.88 ± 0.04 cm2 captive bubble to a molecular area just beyond the point at which γ changes from the value for the clean interface, heated to 37 °C, and compressed by decreasing the volume of the bubble at ∼3 μL/min. Surface tensions were plotted in terms of both relative surface area (bottom axis) and relative surface concentration (top axis). Curves give the results for one representative experiment. Symbols give the mean ± standard deviation (SD) at specific points for five experiments. The symbols conceal the error bars.
The late acceleration could reflect changes in the film, achieved at a critical γ, or changes in the adsorbing material. Although the vesicles dispersed in the bulk of the subphase should remain unchanged by the introduction of an interface, material adjacent to the surface might undergo a kinetic transformation that would allow faster adsorption. The two possibilities of changes in the film or in the adsorbing material predicted opposite dependence on γ and the duration of adsorption. Accelerated adsorption that occurred because of changes in the film should depend exclusively upon γ, regardless of the time needed to reach the critical value. A late acceleration that instead reflected changes in the adsorbing material should become apparent in measurements of sufficient duration, independent of the γ.
Adsorption isobars distinguished between kinetic dependence on time and γ. Isobars, obtained at constant γ, measured rates of adsorption from the change in area, A, necessary to maintain γ constant.(29) Assuming that Γ uniquely determined γ, such that, for n constituents confined within A,
where the variable c had a single value at any particular γ, then for adsorption at constant γ, the fractional rate of change in area would equal the fractional rate at which constituents adsorb to the interface:
If the steeper slopes at the end of the adsorption isotherms reflected a maturation of adsorbing material and the passage of time, then adsorption isobars should all become steeper at later times, regardless of the γ that was held constant. If instead the steeper isotherms occurred because of the lower γ, then the semi-logarithmic isobars should have slopes that remain constant. These isobaric slopes should show the same dependence on γ as the slope of the adsorption isotherms.
Adsorption at a fixed γ occurred at a constant rate (Figure 3). Plots of ln A versus time were linear (Figure 3B). The isobaric measurements extended to times at which adsorption to a constant surface area demonstrated the late acceleration (Figure 3A). Changes in the adsorbing material that might have caused the late acceleration in the experiments with a constant surface area should have occurred during the isobaric measurements. The rate of isobaric adsorption, however, remained unchanged (Figure 3B). After the chamber reached its minimum hydrostatic pressure, which prevented further expansion to maintain isobaric conditions, the experiments measured the fall in γ during adsorption to a constant area (Figure 3A). The isotherms after the isobaric adsorption paralleled the curves obtained during adsorption to an area that was fixed throughout the entire experiment, demonstrating the same late increase in slope. Both the constant isobaric rates and the parallel final segments of the isotherms, despite interruption of the fall in γ by a prolonged isobaric interval, argued that the late acceleration occurred when the films reached a critical γ rather than when time achieved a critical duration required for maturation of the adsorbing material.
Figure 3.

Prolonged isobaric adsorption. Extruded vesicles of CLSE in HS were injected into a stirred subphase of HSC below captive bubbles at 23 ± 1 °C to achieve a final concentration of 250 μM phospholipid. The surface area was held constant, either for the duration of the experiment (“Continuous Isotherm”) or until γ reached 37 mN/m, which was then held constant (“With Isobaric Segment”) using simple feedback to control the syringe pump that infused or withdrew buffer from the subphase. Isobaric adsorption terminated when the hydrostatic pressure in the chamber fell below ∼0.5 atm, after which further expansion of the bubble was no longer possible, so that adsorption continued to a surface with a constant area. (A) Variation of γ with time. Curves give results from representative experiments to illustrate features that can be obscured during averaging. Symbols give the mean ± SD of time to reach selected γ (n = 5 for continuous isotherms and 3 for curves with isobaric segments). (B) Semi-logarithmic plot of the area versus time after beginning the isobaric segments of the adsorption isotherms. The slope provides the rate of adsorption. The solid black trace gives results for a representative experiment, with the least-squares linear fit indicated by the superimposed white line. Symbols give the mean ± SD for three experiments.
The steeper slopes close to γe could still reflect changes in the adsorbing material if the isobaric expansion altered the concentration of constituents immediately adjacent to the surface as well as within the interface. The classical model of adsorption developed by Ward and Tordai(30) postulates equilibrium between the film and an unstirred layer immediately adjacent to the interface. If the key step leading to the accelerated adsorption was the maturation of material in the unstirred layer, then isobaric expansion during adsorption might delay that process. Therefore, experiments also tested whether prespread films, which would greatly shorten the time required to reach a hypothetical critical γ, would advance the onset of the late acceleration. Conversely, adsorption that required a kinetic process adjacent to the interface should be unaffected by the artificially lowered γ.
The pre-existing films greatly shortened the time required for adsorption to reach γe (Figure 4). From the initial value of 30−34 mN/m for the prespread films, γ fell during subsequent adsorption along isotherms at least as steep as for vesicles adsorbing to an initially clean interface (Figure 4). The kinetics of adsorption to spread and adsorbed films at the same γ were comparable (Figure 4). The steeper slopes occurred without delay, arguing that maturation of the adsorbing material was unnecessary, and that the onset of the late acceleration depended instead on reaching a critical γ.
Figure 4.

Adsorption of CLSE vesicles to prespread films of CLSE. Solutions of CLSE in 1:1 (v/v) methanol/chloroform were deposited on the surface of captive bubbles to γ < 35 mN/m. After the spreading solvent was removed by exchange of the subphase with ∼20 mL of fresh buffer, aliquots of dispersed CLSE were injected into the subphase to achieve a final concentration of 250 μM phospholipid. A control experiment, indicated by ○, gives the response to vesicles injected below a bubble without a pre-existing film. For adsorption to the pre-existing films, indicated by ◻, the black curves give the actual data; gray curves give the same data offset in time, so that the initial γ coincided with the isotherm for adsorption to a clean interface. Both axes are split to emphasize the final approach of γ to γe.
Isobaric measurements at different γ directly tested how the rate of adsorption depended on γ. To minimize the effects of variation among samples, we measured isobaric adsorption at sequentially lower surface tensions for individual samples, alternatively holding γ or area constant, during the course of a single experiment (Figure 5A). During the isobaric segments, ln A again varied linearly with time (Figure 5A). In each experiment, the rates of isobaric adsorption initially fell at progressively lower γ, but then increased just above γe (Figure 5B). The sequential isobars provided further support that γ determined the onset of the accelerated late adsorption.
Figure 5.

Sequential isobaric adsorption. During adsorption of extruded CLSE at 250 μM phospholipid to the surface of a captive bubble at 23 ± 1 °C, surface area was alternatively held constant or manipulated to maintain γ constant. (A) Variation of γ (left axis) and ln A (right axis) during the course of an individual experiment. (B) Rates of adsorption, obtained from the fractional rate of expansion, (dA/A)/dt, at specific surface tensions for eight individual experiments, distinguished by different symbols and lines. The y axis is split to emphasize how rates varied toward the end of adsorption.
To test how the different components of pulmonary surfactant contributed to the late acceleration, our experiments used preparations obtained from CLSE by removing specific constituents. Collection of appropriate fractions eluted from a gel-permeation column separated CLSE into preparations containing the surfactant proteins and phospholipids (SP&PL), without cholesterol; the surfactant proteins and modified phospholipids (SP&mPL), lacking cholesterol and the anionic phospholipids; and the neutral and phospholipids (N&PL), without the proteins.16,18,31 Comparing the adsorption of these different preparations indicated the role played in the complete biological mixture by the omitted constituents.
Removal of cholesterol from CLSE had little effect on adsorption (Figure 6). The isotherms for CLSE and SP&PL, which differ only in their content of cholesterol, were similar. At γ ≈ 35 mN/m, the curves for both preparations became steeper, with the slope achieving greater magnitude for SP&PL than for CLSE (Figure 6B). The additional removal of the anionic phospholipids to yield SP&mPL slowed adsorption generally (Figure 6A), but the late acceleration persisted, with relatively little change in the steeper slopes at ∼30 mN/m (Figure 6B). Removal of only the proteins slowed adsorption further and prevented N&PL from reaching γ below 50 mN/m (Figure 6A). Our experiments were not designed to distinguish whether further adsorption without the proteins ceased completely or simply slowed to an undetectable rate, but during measurements extended to 6 h, N&PL produced no further change in γ.
Figure 6.

Compositional dependence for adsorption of pulmonary surfactant. Preparations obtained from CLSE contained the complete set of neutral and phospholipids (N&PL), without the proteins; the surfactant proteins and phospholipids (SP&PL), without cholesterol; or the surfactant proteins with the phospholipids modified by the removal of the anionic compounds (SP&mPL). A Wilhelmy plate measured γ at 37 °C after aspirating the interface of a subphase containing vesicles dispersed by sonication in HSC with a concentration of 100 μM phospholipid. Averaged data for CLSE were obtained from the individual curves in Figure 1. For each graph, the curves give results from a representative experiment. Symbols give the mean ± SD at selected points for at least five experiments. (A) Adsorption isotherms. (B) Slopes of the isotherms at different surface tensions. Slopes were obtained by the procedure used in Figure 1, differentiating the smoothed experimental isotherms.
These results fell short of proving that the accelerated late adsorption required the proteins. The absence of the proteins might prevent γ from ever reaching a critical value, but have no effect on subsequent adsorption if the film artificially achieved that γ. To test whether vesicles could adsorb rapidly at lower γ without the proteins, experiments measured adsorption of vesicles with and without the proteins to monolayers of N&PL prespread to γ ≈ 30 mN/m (Figure 7). At these low γ, vesicles of N&PL were ineffective. Injection of the N&PL vesicles produced an initial drop of γ below the value for the pre-existing film by <2 mN/m but no further decrease in γ (Figure 7). Control experiments confirmed that vesicles of CLSE, with the proteins, adsorbed readily to the films of N&PL. At γ above ∼50 mN/m, insertion into the interface could occur slowly for the lipids alone (Figure 6), but adsorption at lower γ, including for the final accelerated approach to γe, required the proteins.
Figure 7.

Adsorption to pre-existing films of N&PL. Films of N&PL were spread on the surface of captive bubbles to γ of 32.5 ± 1.5 mN/m by depositing appropriate volumes of solutions in 1:1 (v/v) methanol/chloroform. The subphase was replaced with clean buffer to remove spreading solvent. Concentrated dispersions of N&PL or CLSE were then injected into the subphase to initiate adsorption. γ was measured at 23 °C during adsorption to a surface area held constant by simple feedback. Curves give the mean of γ (n = 4 for CLSE and 5 for N&PL). Error bars give ±SD at selected points.
The importance of the proteins suggested that their concentration within the interface might explain the late acceleration. Prior studies have shown that the proteins increase the rate of adsorption, whether they are located in the vesicles or at the air−water interface.4,32 If the contents of a vesicle insert collectively, then during adsorption, the composition of the nascent film and its fractional content of protein would remain constant. The absolute Γ of the proteins, however, would increase as adsorption progressed. The increased availability of protein at the point of contact between the vesicles and the film, contributed from both sides of the junction, might cause adsorption to accelerate at Γ above a critical value.
Experiments with vesicles of CLSE adsorbing to pre-existing films of N&PL tested that possibility. During adsorption of CLSE to initial films of N&PL, the Γ of protein at any γ would be lower than for CLSE adsorbed to an initially clean interface. The pre-existing film of N&PL would delay the point at which the adsorbing CLSE would reach the hypothetical critical Γ of protein, and the onset of the late acceleration would shift to a lower γ. The films of N&PL produced the predicted slowing of the initial adsorption. Despite starting at higher γ, vesicles adsorbing to an initially clean interface quickly reached lower γ than adsorption to a pre-existing film (Figure 8). These results fit with the effect of interfacial protein on adsorption. The onset of the late acceleration, however, occurred at the same γ, unaffected by the Γ of N&PL in pre-existing films (Figure 8). The equilibrium isotherm (Figure 2) indicated that, at γe, the Γ of protein in films formed by adsorption to N&PL with γ ≈ 50 mN/m would be 30% of the value for CLSE adsorption to a clean interface. The inflection point of the kinetic isotherms nonetheless occurred at a γ that was unchanged (Figure 8). The late acceleration was unrelated to a critical Γ of protein.
Figure 8.

Adsorption of CLSE vesicles to pre-existing films of N&PL with different γ. After different amounts of N&PL were spread on the surface of captive bubbles, concentrated aliquots of CLSE were injected into the subphase at 23 °C to achieve a phospholipid concentration of 250 μM. The surface area was maintained constant during adsorption using simple feedback. The initial symbols indicate the γ of the different pre-existing films.
An additional possible compositional factor in the films concerned the lipids. Previous reports have suggested that the structural discontinuity between coexisting phases within a leaflet might represent an important focus for the initiation of fusion between two bilayers.(33) To test whether the accelerated late adsorption required the presence of an interfacial boundary within the lipids, in either the vesicular bilayer or the interfacial film, we measured γ during adsorption of vesicles containing the proteins with a single phospholipid present as a single phase at temperatures well above its Lβ′−Lα transition.(34) Vesicles of the SPs with DOPC produced adsorption isotherms similar in shape to traces for CLSE, including the inflection point and the steeper slopes just above γe (Figure 9). Coexisting phases were unnecessary to produce the late acceleration.
Figure 9.

Adsorption of DOPC vesicles with and without SP. Curves give representative traces for adsorption of DOPC + 1% (w/w) SP (500 μM phospholipid) and DOPC alone (1 mM phospholipid) to the surface of a captive bubble at 23 °C. Symbols give the mean ± SD of the time at specific γ for SP−DOPC (n = 3) and the mean ± SD for γ at specific times for DOPC alone (n = 5).
The dependence of the accelerated late adsorption on both γ and the presence of the proteins suggested that, at a certain Γ, the proteins, the phospholipids, or both achieved a configuration that allowed more favorable interaction of the nascent film with the adsorbing vesicles. To test whether the proteins or the phospholipids represented the more important component, we used other lipids, unrelated to pulmonary surfactant, to determine if vesicles without proteins would also demonstrate the late acceleration. Compounds that induce lipid leaflets to adopt negative curvature, with a concave hydrophobic face, promote faster adsorption.4,35,36 The phosphatidylethanolamines, which under appropriate conditions form the negatively curved inverse hexagonal (HII) phase, provide a well-documented example of this effect.4,35,36 Our experiments used mixtures of DOPE/DOPC (8:2, mol/mol) at ambient temperatures. Small-angle X-ray scattering (SAXS), which at higher temperatures detected coexisting Lα and HII phases, showed only lamellar structures below 48 °C (Figure 10). At 23 °C, these mixtures contained only vesicles, without HII aggregates. Adsorption should involve the insertion of vesicles, directly comparable to the process for CLSE.
Figure 10.

SAXS from DOPE/DOPC (8:2, mol/mol) at different temperatures. Intensities are plotted as a function of q = 4π sin θ/λ, where λ is the wavelength of the X-ray and θ is half the angle between the incident and diffracted beams. Curves are offset from a common baseline for clarity of presentation. Labels indicate diffraction from lamellar structures (L), which occurs at values of q with ratios of 1:2:..., and from hexagonal structures (HII) at 1:(3)1/2:2:...
The kinetics of adsorption for DOPE/DOPC varied more than for the vesicles with the SPs. For seven experiments at 1.0 mM phospholipid, the time to reach γe extended from 8 to 48 min. The isotherms, however, were similar in shape to each other and to the curves for CLSE. If normalized to the total time required to reach γe, the adsorption isotherms were reproducible (Figure 11). After an initial acceleration, γ fell at rates that decreased until reaching an inflection point at ∼40 mN/m, after which the slopes became steeper. The late acceleration of adsorption for vesicles that lacked the proteins suggested that the critical structural change at low γ occurred in the lipids rather than the proteins.
Figure 11.

Adsorption of DOPC/DOPE vesicles. DOPC, either alone or mixed with DOPE (XDOPE = 0.8), was dispersed into HSC buffer and introduced into the subphase below a captive bubble at 1 mM phospholipid. γ was monitored at ambient temperature (23 ± 1 °C) while the surface area was maintained constant using simple feedback. Time of adsorption for the DOPC/DOPE vesicles (lower axis) is expressed relative to the interval required to reach a constant γ. Time for the vesicles of DOPC alone (upper axis) is expressed in unnormalized units. The slowest adsorption for DOPC/DOPE vesicles required 48 min to reach a γ that remained constant. Curves give results for representative experiments. Symbols give the mean ± SD for DOPC (n = 5) and DOPE/DOPC (n = 7).
Discussion
The faster rate at which pulmonary surfactant lowers γ close to γe results from faster adsorption. Our results rule out the alternative explanation that the steeper slopes reflect the relationship between γ and Γ. The adsorption of dimyristoyl phosphatidylcholine (DMPC) provides an example of that other possibility.(37) During the first-order transition between coexisting phases within the monolayer, increasing the Γ of DMPC produces little change in γ. After completing the transition, the slope of the γ−Γ equilibrium isotherm becomes steeper. Consequently during adsorption, γ can fall more rapidly after coexistence without a faster increase in Γ. For spread monolayers of CLSE and SP−DOPC, the γ−Γ isotherms include no isobaric plateaus (Figure 2). The equation of state that relates γ and Γ provides no explanation for the accelerated drop in γ, whether from phase coexistence or any other mechanism.
The kinetics by which surfactants adsorb to an interface have been considered most commonly in terms of sequential steps. Surfactants first diffuse across an unstirred layer to reach the surface and then insert into the interface.30,38 Insertion may require nothing more than arrival at the interface, or a major reconfiguration may be necessary, involving significant energy of activation.39,40 Surfactants can be classified according to whether rates of adsorption depend on diffusion, the actual insertion into the interface, or both processes.(41) For adsorption determined strictly by the rate of diffusion, expressions that describe the accumulation of adsorbed material simplify considerably if the reverse process of desorption can be ignored,(30) which is reasonable for the insoluble compounds considered here.42,43 The rate of adsorption dominated by diffusion should then depend on (time)−1/2.(30) That dependence indicates that diffusion cannot explain the kinetics observed here. The late acceleration instead suggests a process of insertion that changes as adsorption proceeds.
These changes in adsorption could result from alterations in either the absorbing material or the interfacial film. Material adjacent to the interface might undergo the sort of maturation that occurs during adsorption of vesicles to solid supports.44−46 Vesicles first adhere to the support and then disrupt to form attached disks. The sequential steps face different restrictions. Vesicles attach to the solid support only if they exceed a critical size, for which the favorable energy of adhesion is greater than the unfavorable energy of bending at the perimeter of the flattened vesicle. The subsequent step, in which the attached vesicle disrupts to form disks, is restricted to vesicles above a larger size by the line tension between the perimeter of the disk and the surrounding aqueous environment. Vesicles between those two critical sizes can adhere but not proceed to form disks. Adherent vesicles can increase their size and become capable of disruption by fusing. An analogous maturation of vesicles adjacent to the air−water interface represents one process that might explain the late increase in rates of adsorption.
Our results show, however, that the late acceleration is a characteristic of the films rather than the adsorbing material. Instead of requiring a critical duration during which the adjacent material undergoes some functional change, the late acceleration begins when γ reaches a critical value. Prespread films, used to advance the reduction in γ, produce an earlier onset of the late acceleration (Figure 4). Adsorption to these prespread films occurs at approximately the same rate as to adsorbed films at the same γ (Figure 4). Interruptions of the fall in γ by intervals of isobaric adsorption have no effect on the subsequent fall in γ (Figure 3). Prolonged isobaric adsorption occurs at a constant rate, with no evidence for a time-dependent change (Figure 3B). Isobaric experiments show the same dependence of adsorption rates on γ as the slope of the adsorption isotherm, including the increase in rates at low γ (Figure 5). In each of these several experimental approaches, the rate of adsorption reflects only γ rather than time, with rates that are faster rather than slower below a critical γ. This distinction argues that the late acceleration results from changes in the films rather than a maturation of the adsorbing material.
Our results suggest that the late acceleration may represent a characteristic of adsorption by fusion between the inserting vesicle and the nascent film. The SPs and DOPE, which both induce the late acceleration (Figures 6 and 11), both also promote the fusion of vesicles.47,48,38 To the best of our knowledge, an accelerated fall in γ has not been reported for adsorption of micelle-forming surfactants that insert into an interface as individual monomers. Fusion between vesicles begins with the outer leaflets merging to form a single continuous structure, in which lipids diffuse freely over the otherwise intact vesicles.(49) Adsorption would proceed by a comparable process, in which the outer leaflet of the adsorbing vesicle would first merge with the nascent film before the constituents would insert into the interface as a collective unit.
The evidence that vesicles adsorb by fusion is incomplete. The mixing of lipids between the adsorbing vesicle and the interfacial film, comparable to mixing between the outer leaflets of fusing vesicles, remains unconfirmed. The preponderance of data, however, favors adsorption by fusion. Compounds that form structures with spontaneous curvature similarly promote or inhibit both adsorption and the fusion of vesicles.4,5,35,36,50,51 Constituents that affect both adsorption and fusion have similar effects when added to either of the leaflets that will merge.4,32,50 MLVs, which are large enough to allow microscopic visualization, adsorb as intact structures.52,53 Adsorption would occur by merger of the vesicleʼs outer leaflet with the nascent film, followed by insertion of its constituents as a collective unit.
The late acceleration would then reflect a greater susceptibility of the film to fusion with the adsorbing vesicle below a critical γ. Our results reject two possible explanations suggested by previous reports that would reflect local characteristics of the film caused by the protein or the lipids. Because the proteins can promote adsorption at the interface as well as in vesicles,4,32 the lower γ might reflect the higher Γ of the proteins and the greater likelihood that a protein, contributed from either of the fusing structures, would be present to stabilize the initial merged structure. For adsorption of CLSE, however, pre-existing films that change the relationship between the Γ of the proteins and γ have no effect on the γ at which the late acceleration begins (Figure 8). With the lipids, the separation of phases within the film, which varies with γ, provides a structural discontinuity that might facilitate the initial merger between two leaflets. Vesicles of the SPs with DOPC occur as a single phase under the conditions used here(34) yet undergo a well-defined late acceleration (Figure 9). Phase separation in the lipids and the Γ of the proteins are both unlikely to explain the late acceleration.
The kinetics of adsorption at different γ most likely reflect structural changes in the film. Those changes could occur either in the small amount of protein that greatly facilitates adsorption or in the lipids that constitute most of the film. Our results with DOPE/DOPC, which show the same late acceleration in the absence of the proteins (Figure 11), suggest that the crucial change occurs in the lipids. Our experiments provide no information on the structure of the proteins and cannot rule out the prior suggestion that lower γ causes a functionally important conformational change in the proteins.(6) The late acceleration with samples containing only lipids, however, supports the paradoxical initial impression that interfacial lipids more rapidly accommodate the insertion of additional material when they are more densely packed.
The specific changes in the structure of the lipids that allow faster adsorption at lower γ remain uncertain. The dramatic acceleration of adsorption at a specific γ suggests a qualitative change in the structure of the film, such as occurs at a percolation threshold. No basis for such a qualitative change, however, is readily apparent. Several characteristics of spread monolayers change quantitatively when they are compressed to higher densities. The alteration that seems most likely to allow better interaction with the outer leaflet of the adsorbing vesicle is the tilt of the acyl chains away from the plane of the interface, which increases at higher Γ.(54) The hydrophobic thickness of the merging leaflets would then be similar. Approaches that would vary the tilt of the lipids without changing γ unfortunately are unavailable. Exactly which structural changes in the films cause adsorption to accelerate remains the object of speculation.
In summary, our findings show that the more rapid fall in γ close to γe observed for vesicles of pulmonary surfactant reflects faster adsorption. The faster rates most likely reflect the greater susceptibility of the lipid monolayer to fusion with the adsorbing vesicle because of structural changes at lower γ.
Acknowledgments
These studies were funded by the National Institutes of Health (HL 54209). CLSE was provided by Dr. Edmund Egan of ONY, Inc., Amherst, NY. Dr. Vincent Schram and Holly Sagerson performed initial experiments that provided the instigation for these studies. Measurements of SAXS were performed at the Stanford Synchrotron Radiation Lightsource, a national user-facility operated by Stanford University on behalf of the Office of Basic Energy Sciences, U.S. Department of Energy.
Funding Statement
National Institutes of Health, United States
References
- Schram V.; Hall S. B. Biophys. J. 2001, 81, 1536–1546. [DOI] [PMC free article] [PubMed] [Google Scholar]
- Schram V.; Anyan W. R.; Hall S. B. Biochim. Biophys. Acta 2003, 1616, 165–173. [DOI] [PubMed] [Google Scholar]
- Zuo Y. Y.; Gitiafroz R.; Acosta E.; Policova Z.; Cox P. N.; Hair M. L.; Neumann A. W. Langmuir 2005, 21, 10593–10601. [DOI] [PubMed] [Google Scholar]
- Biswas S. C.; Rananavare S. B.; Hall S. B. Biochim. Biophys. Acta 2005, 1717, 41–49. [DOI] [PMC free article] [PubMed] [Google Scholar]
- Biswas S. C.; Rananavare S. B.; Hall S. B. Biophys. J. 2007, 92, 493–501. [DOI] [PMC free article] [PubMed] [Google Scholar]
- Klenz U.; Saleem M.; Meyer M. C.; Galla H. J. Biophys. J. 2008, 95, 699–709. [DOI] [PMC free article] [PubMed] [Google Scholar]
- Horie T.; Ardila R.; Hildebrandt J. J. Appl. Physiol. 1974, 36, 317–322. [DOI] [PubMed] [Google Scholar]
- Valberg P. A.; Brain J. D. J. Appl. Physiol. 1977, 43, 730–738. [DOI] [PubMed] [Google Scholar]
- Wilson T. A. J. Appl. Physiol. 1982, 53, 1512–1520. [DOI] [PubMed] [Google Scholar]
- Schürch S.; Bachofen H.; Weibel E. R. Respir. Physiol. 1985, 62, 31–45. [DOI] [PubMed] [Google Scholar]
- Smith J. C.; Stamenovic D. J. Appl. Physiol. 1986, 60, 1341–1350. [DOI] [PubMed] [Google Scholar]
- Bachofen H.; Schürch S.; Urbinelli M.; Weibel E. R. J. Appl. Physiol. 1987, 62, 1878–1887. [DOI] [PubMed] [Google Scholar]
- Inoue H.; Inoue C.; Hildebrandt J. J. Appl. Physiol. 1982, 53, 567–575. [DOI] [PubMed] [Google Scholar]
- Bligh E.; Dyer W. Can. J. Biochem. 1959, 37, 911–917. [DOI] [PubMed] [Google Scholar]
- Notter R. H.; Finkelstein J. N.; Taubold R. D. Chem. Phys. Lipids 1983, 33, 67–80. [DOI] [PubMed] [Google Scholar]
- Takahashi A.; Fujiwara T. Biochem. Biophys. Res. Commun. 1986, 135, 527–532. [DOI] [PubMed] [Google Scholar]
- Hawgood S.; Benson B. J.; Hamilton R. J. Biochemistry 1985, 24, 184–190. [DOI] [PubMed] [Google Scholar]
- Hall S. B.; Wang Z.; Notter R. H. J. Lipid Res. 1994, 35, 1386–1394. [PubMed] [Google Scholar]
- Pérez-Gil J.; Cruz A.; Casals C. Biochim. Biophys. Acta 1993, 1168, 261–270. [DOI] [PubMed] [Google Scholar]
- Schram V.; Hall S. B. Biophys. J. 2004, 86, 3734–3743. [DOI] [PMC free article] [PubMed] [Google Scholar]
- Schürch S.; Bachofen H.; Goerke J.; Possmayer F. J. Appl. Physiol. 1989, 67, 2389–2396. [DOI] [PubMed] [Google Scholar]
- Smith E. C.; Crane J. M.; Laderas T. G.; Hall S. B. Biophys. J. 2003, 85, 3048–3057. [DOI] [PMC free article] [PubMed] [Google Scholar]
- Putz G.; Goerke J.; Schürch S.; Clements J. A. J. Appl. Physiol. 1994, 76, 1417–1424. [DOI] [PubMed] [Google Scholar]
- Crane J. M.; Putz G.; Hall S. B. Biophys. J. 1999, 77, 3134–3143. [DOI] [PMC free article] [PubMed] [Google Scholar]
- Malcolm J. D.; Elliott C. D. Can. J. Chem. Eng. 1980, 58, 151–153. [Google Scholar]
- King R. J.; Clements J. A. Am. J. Physiol. 1972, 223, 727–733. [DOI] [PubMed] [Google Scholar]
- Barenholz Y.; Lasic D. D. In Handbook of Nonmedical Applications of Liposomes; Lasic D. D., Barenholz Y., Eds.; CRC Press: Boca Raton, FL, 1996; pp 23−30. [Google Scholar]
- Walters R. W.; Jenq R. R.; Hall S. B. Biophys. J. 2000, 78, 257–266. [DOI] [PMC free article] [PubMed] [Google Scholar]
- Smith R. D.; Berg J. C. J. Colloid Interface Sci. 1980, 74, 273–286. [Google Scholar]
- Ward A. F. H.; Tordai L. J. Chem. Phys. 1946, 14, 453–461. [Google Scholar]
- Hawgood S.; Benson B. J.; Schilling J.; Damm D.; Clements J. A.; White R. T. Proc. Natl. Acad. Sci. U.S.A. 1987, 84, 66–70. [DOI] [PMC free article] [PubMed] [Google Scholar]
- Oosterlaken-Dijksterhuis M. A.; Haagsman H. P.; van Golde L. M. G.; Demel R. A. Biochemistry 1991, 30, 8276–8281. [DOI] [PubMed] [Google Scholar]
- Leckband D. E.; Helm C. A.; Israelachvili J. Biochemistry 1993, 32, 1127–1140. [DOI] [PubMed] [Google Scholar]
- King R. J.; Phillips M. C.; Horowitz P. M.; Dang S. C. Biochim. Biophys. Acta 1986, 879, 1–13. [DOI] [PubMed] [Google Scholar]
- Perkins W. R.; Dause R. B.; Parente R. A.; Minchey S. R.; Neuman K. C.; Gruner S. M.; Taraschi T. F.; Janoff A. S. Science 1996, 273, 330–332. [DOI] [PubMed] [Google Scholar]
- Yu S.-H.; Harding P. G. R.; Possmayer F. Biochim. Biophys. Acta 1984, 776, 37–47. [Google Scholar]
- Li M.; Retter U.; Lipkowski J. Langmuir 2005, 21, 4356–4361. [DOI] [PubMed] [Google Scholar]
- Krueger M. A.; Gaver D. P. J. Colloid Interface Sci. 2000, 229, 353–364. [DOI] [PubMed] [Google Scholar]
- Eastoe J.; Dalton J. S. Adv. Colloid Interface Sci. 2000, 85, 103–144. [DOI] [PubMed] [Google Scholar]
- Chang C. H.; Franses E. I. Colloids Surf., A 1995, 100, 1–45. [Google Scholar]
- Otis D. R. Jr.; Ingenito E. P.; Kamm R. D.; Johnson M. J. Appl. Physiol. 1994, 77, 2681–2688. [DOI] [PubMed] [Google Scholar]
- Marsh D.; King M. D. Chem. Phys. Lipids 1986, 42, 271–277. [DOI] [PubMed] [Google Scholar]
- Smith R.; Tanford C. J. Mol. Biol. 1972, 67, 75–83. [DOI] [PubMed] [Google Scholar]
- Lipowsky R.; Seifert U. Mol. Cryst. Liq. Cryst. 1991, 202, 17–25. [Google Scholar]
- Lipowsky R.; Seifert U. Langmuir 1991, 7, 1867–1873. [Google Scholar]
- Reviakine I.; Brisson A. Langmuir 2000, 16, 1806–1815. [Google Scholar]
- Poulain F. R.; Nir S.; Hawgood S. Biochim. Biophys. Acta 1996, 1278, 169–175. [DOI] [PubMed] [Google Scholar]
- Ryan M. A.; Qi X. Y.; Serrano A. G.; Ikegami M.; Perez-Gil J.; Johansson J.; Weaver T. E. Biochemistry 2005, 44, 861–872. [DOI] [PubMed] [Google Scholar]
- Chernomordik L. V.; Zimmerberg J.; Kozlov M. M. J. Cell Biol. 2006, 175, 201–207. [DOI] [PMC free article] [PubMed] [Google Scholar]
- Chernomordik L.; Chanturiya A.; Green J.; Zimmerberg J. Biophys. J. 1995, 69, 922–929. [DOI] [PMC free article] [PubMed] [Google Scholar]
- Melia T. J.; You D. Q.; Tareste D. C.; Rothman J. E. J. Biol. Chem. 2006, 281, 29597–29605. [DOI] [PubMed] [Google Scholar]
- Sen A.; Hui S.-W.; Mosgrober-Anthony M.; Holm B. A.; Egan E. A. J. Colloid Interface Sci. 1988, 126, 355–360. [Google Scholar]
- Haller T.; Dietl P.; Stockner H.; Frick M.; Mair N.; Tinhofer I.; Ritsch A.; Enhorning G.; Putz G. Am. J. Physiol. 2004, 286, L1009–L1015. [DOI] [PubMed] [Google Scholar]
- Kaganer V. M.; Möhwald H.; Dutta P. Rev. Mod. Phys. 1999, 71, 779–819. [Google Scholar]