Abstract
Purpose
Radical prostatectomy (RP)has significant side effects. Pre-operative information which could predict the long-term outcome of RP would be valuable to both patient and physician. The purpose of this study was to determine whether pre-treatment endorectal MRI/MRSI has the potential to predict biochemical recurrence (BCR) after RP.
Materials and Methods
130 of 202 patients who had endorectal MRI/MRSI from January 2000 to December 2002 followed by RP satisfied all inclusion criteria and were included in the analysis. MRI and MRSI factors with potential predictive capability were compared to BCR data. These included MRI risk score based on local extent of disease, and MRSI index lesion characteristics including the number of voxels and degree of metabolic abnormality (MRSI grade). Associations between MRI and MRSI variables and time-to-BCR were evaluated using Cox Proportional Hazards regression, adjusting for known predictors of BCR such as stage, grade, and PSA.
Results
Within a median followup period of 68 months, there were 26 biochemical failures. MRI risk score, MRSI index lesion volume and presence of high grade voxels each correlated with time-to-BCR. In a model which combined clinical parameters, MRI score, MRSI lesion volume and the presence of at least one high grade voxel, the MRSI variables remained significant whereas the MRI score dropped out.
Conclusions
MRSI index lesion volume and the presence of high grade MRSI voxels correlate with time-to-BCR after radical prostatectomy even when adjusted for clinical data. These results suggest pre-operative predictive utility for endorectal MRI/MRSI in patients considering radical prostatectomy.
Keywords: MRI, spectroscopy, prostate, cancer, recurrence
Introduction
The most widely employed tools for pre-operatively predicting outcome after radical prostatectomy are nomograms 1–3 and incorporation of pathological information obtained at surgery improves predictive ability 3–5. Thus, a pre-operative assay which provided surrogate data for pathological factors could improve pre-surgical prediction of recurrence. Endorectal MRI permits the assessment of prostate cancer location and disease extent, and contributes information related to pathological stage 6–7. Proton magnetic resonance spectroscopic imaging (MRSI)detects metabolic abnormalities in prostate tumors which reflect both lesion size and aggressiveness of the disease 8–9. The cohort of patients described herein underwent pre-treatment endorectal MRI/MRSI of the prostate in the years 2000–2002. In an initial analysis, we found that both the ratio of choline plus creatine to citrate ([Cho+Cr]/Cit) in tumor and the MRSI-measured tumor volume correlated with the surgical Gleason score 9. The disease progression data on the same patient cohort has matured, and the goal of the current study is to test the hypothesis that the MRSI parameters which originally correlated with pathological aggressiveness are also correlated with time-to-biochemical recurrence (BCR). As MRI stage information was also available for this cohort, we assessed its relationship to BCR as well.
Materials and Methods
Patient Demographics
All patients gave informed consent according to an IRB-approved protocol. One-hundred sixty-two patients were accrued consecutively from January of 2000 to November of 2001. However, after exclusions (see below), there were only six patients with surgical Gleason scores of 8 or higher. To increase the size of the higher Gleason score population, we added 40 patients who were scanned from January to December of 2002 and who had surgical Gleason scores of 7 or more. Although the final 202 patients are not a consecutive series, the statistical validity of the study was not affected. Of the 202 patients, 72 were excluded for the following reasons: biopsy less than 6 weeks prior to MRI/MRSI (N = 9), MRSI data unusable due to hardware/software failure or lipid contamination artifact (N = 27), tumor only in transition zone (N = 9), pathological tumor map unavailable (N = 3), and prior treatment (24). The remaining 130 patients are included in the current analysis.
MRI/MRSI Data Acquisition, Processing, and Pathological Correlation
The MRSI data acquisition and processing procedures and the pathological correlation method have been described in detail elsewhere 9. In brief, MRI/MRSI studies were performed on a 1.5 Tesla Signa Horizon scanner (GE, Milwaukee, WI) using a combined pelvic phased array and endorectal coil (Medrad, Indianola, PA). MRSI data were obtained and processed using software developed at the University of California at San Francisco10–12. Prostatectomy specimen whole-mount sections were prepared and tumor maps were generated9. Microsections were stained with hematoxylin and eosin and cancer foci were outlined in ink.
Spatial correlation between MRI/MRSI data and pathology was performed as previously described 9. An MRSI lesion was considered to match the pathological lesion if it was located in the corresponding sextant, anterior/posterior position and within ± 1 slice of the corresponding pathology section. Patients with tumor only in the transition zone (TZ) as seen histologically were censored because the MRSI acquisition software was not capable of capturing the entire TZ in all cases.
MRI and MRSI analysis and scoring: biochemical outcome study
All procedures described above were performed prior to the publication of Reference 9. What follows are procedures related to the current goal of assessing the relationship between MRI/MRSI and biochemical recurrence. The MRI and MRSI parameters chosen for testing were those deemed most likely to correlate with long-term outcome. Thus, for MRI, the local extent of disease was tested, while for MRSI, lesion volume and degree of metabolic abnormality were assessed.
MRI findings for the 130 patients in the current study were previously included in an imaging-only study of MRI parameters vs. biochemical failure which included 610 patients from 2000–200413. In the current study we used the same seven point scoring system to rank the risk of recurrence based on MRI findings. The present population was restricted to 2000–2002 due to a change in MRSI acquisition software in 2003.
To generate quantitative MRSI criteria to relate to BCR, we defined an MRSI “index lesion.” This was defined as the largest contiguous region of MRSI abnormality (see Fig. 1). If two lesions had the same MRSI volume (same number of voxels), the lesion with the greater mean CC/C value was chosen. Within the index lesion, a discrete MRSI grade representing the degree of metabolic abnormality was assigned to each voxel (low, medium, or high). The MRSI grade represented the degree of metabolic abnormality14. If a patient had no abnormality detected, he was assigned an index lesion with zero voxels, no CC/C values were reported, and no MRSI grades were assigned.
Figure 1.
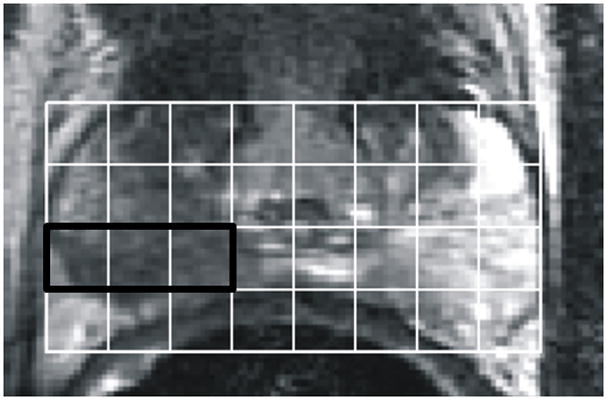
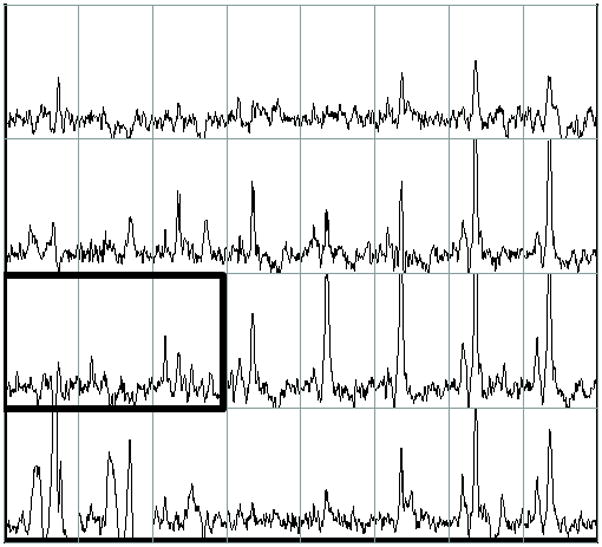
Example of pre-operative proton MRI/MRSI data in a patient with prostate cancer (biopsy Gleason score = 3+4, PSA= 5.4, clinical stage = T2a). The figure contains single slice data extracted from a three-dimensional data set. A) T2-weighted image with grid indicating division of tissue into volume elements (voxels). B) Corresponding MRSI spectra for each voxel in the grid. The bold box includes voxels comprising the MRSI index lesion which have reduced citrate and elevated choline. On the left side of the peripheral zone (right side of image), high levels of citrate indicate healthy glandular tissue. Tumor was confirmed by surgical pathology. 3D-MRSI required 17 minutes and yielded spatial resolution of 6.25 mm in all three dimensions with an interpolated voxel size of 0.12 cm3. Voxels were classified as suspicious for cancer if [Cho+Cr]/Cit (CC/C) was at least 2 standard deviations above the average healthy ratio for the peripheral zone (PZ) 30.
Clinical Data
Clinical, pathological, and biochemical recurrence data were obtained from a clinical database at our institution. Biochemical recurrence was defined as a PSA value > 0.1 ng/mL with subsequent confirmatory rise and/or treatment. PSA testing was performed every 3–4 months in the first year after surgery, every 6 months in the second year, and annually there after. The end date for reporting was January of 2009.
Statistical Analysis
Time-to-BCR was measured from the date of radical prostatectomy until the first documented BCR, and was estimated using the methods of Kaplan and Meier 15. Patients without a recurrence were censored at last follow-up. The associations between MRI and MRSI variables and time to recurrence were evaluated using Cox Proportional Hazards regression, adjusting for known predictors of recurrence such as clinical stage, biopsy Gleason score, and pre-treatment PSA. All p values <0.05 were considered statistically significant. Analyses were conducted using Stata 10.0 for Windows (StataCorp, College Station TX).
Results
Data summary for all subjects
The pre-operative clinical characteristics and the post-surgical pathologic findings of the patients are summarized in Table 1. The distribution of MRI risk scores is shown in Table 2. The vast majority of the patients had an MRI risk score of 2 (tumor seen, no ECE). The MRSI index lesion data are summarized in Table 3. MRSI lesions were detected in the PZ in 117 patients. The median number of voxels in an index lesion was 3.5, comprised mainly of intermediate and low grade voxels. High grade voxels were not as common: 76 of 117 index lesions contained no high grade voxels. In the 117 patients in whom an index lesion was assigned, 21 were false positives.
Table 1.
Clinical characteristics in 130 patients.
| Median | Interquartile Range | ||||
| Age | 59 | (54 – 63) | |||
| PSA | 5.70 | (4.46 – 8.20) | |||
| PRE-OPERATIVE | POST-OPERATIVE | ||||
| Biopsy Gleason Sum | N | % | Surgical Gleason sum | N | % |
| 5 | 1 | 1 | 6 | 58 | 45 |
| 6 | 69 | 53 | 7 | 60 | 46 |
| 7 | 47 | 36 | 8 | 5 | 4 |
| 8 | 9 | 7 | 9 | 7 | 5 |
| 9 | 4 | 3 | |||
| Clinical Stage* | N | % | Pathologic stage | N | % |
| T1** | 68 | 52 | pT2 | 94 | 72 |
| T2A | 42 | 32 | pT3a | 19 | 15 |
| T2B | 15 | 12 | pT3b | 10 | 8 |
| T2C | 5 | 4 | pT4 | 7 | 5 |
| Margin Status | N | % | |||
| negative | 111 | 85 | |||
| positive | 19 | 15 | |||
| Positive lymph nodes | N | % | |||
| 0 | 121 | 93 | |||
| ≥1 | 8 | 6 | |||
| unknown | 1 | 1 | |||
Clinical stage was determined without MRI information
The single stage-T1B patient in the population was grouped with the 67 stage T1C patients to form a T1 group.
Table 2.
MRI index score distribution for 130 patients
| MRI score | N | % |
|---|---|---|
| 1 | 1 | 0.8 |
| 2 | 90 | 69.2 |
| 3 | 16 | 12.3 |
| 4 | 16 | 12.3 |
| 5 | 2 | 1.5 |
| 6 | 4 | 3.1 |
| 7 | 1 | 0.8 |
Table 3.
MRSI index lesion data for 130 patients.
| Index Lesion Parameter | Median | Interquartile Range |
|---|---|---|
| Mean [Cho+Cr]/Cit* | 1.05 | (0.68 – 2.27) |
| # voxels in lesion | 3.5 | (2 – 8) |
| Maximum[Cho+Cr]/Cit* | 1.50 | (0.80 – 6.90) |
| # high grade voxels | 0 | (0 – 1) |
| # intermediate grade voxels | 2 | (1 – 5) |
| # low grade voxels | 1 | (0 – 1) |
| % High grade voxels | 0% | (0% – 20%) |
| % Intermediate grade voxels | 50% | (19% – 80%) |
| % Low grade voxels | 11% | (0%–50%) |
There were 13 MRSI false-negative patients whose metabolic ratios were not included.
MR parameters and time-to-biochemical recurrence
The median follow-up time was 68 months and there were 26 biochemical recurrences (see Fig. 2). The two and five year recurrence-free rates were 86% and 81% respectively. Pre-operative PSA, biopsy Gleason score, and clinical stage were associated with time-to-BCR in a univariate analysis(p < 0.0001, p = 0.0004, and p = 0.0007, respectively).
Figure 2.
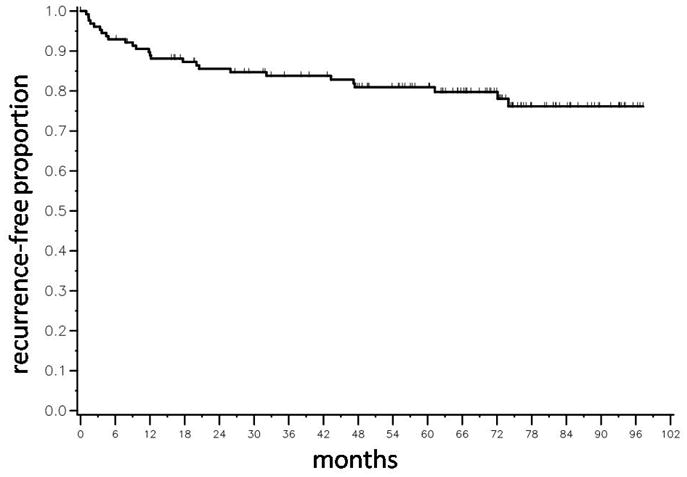
Kaplan-Meier time-to-biochemical recurrence (BCR) plot for 130 patients following radical prostatectomy. There were 26 biochemical recurrences. The median time to BCR was not reached.
The results for the analysis of MRI and MRSI variables vs. time-to-BCR are included in Table 4. Each MR parameter was included first as the only independent variable (“Covariate only model”) and then in a univariate model adjusted for clinical stage, biopsy Gleason score, and pre-operative PSA (“Adjusted model”). In the adjusted model, the MRI risk score and MRSI parameters including the number of voxels in the index lesion, the numbers of high and intermediate grade voxels, and the percentage of high grade voxels, were significantly associated with the risk of BCR. The mean and maximum [Cho+Cr]/Cit values were significant in the covariate-only model but not in the adjusted model.
Table 4.
Results of the univariate analysis of the relationship between MR parameters and time to biochemical recurrence. The adjusted model accounted for the effect of clinical stage, biopsy Gleason score and PSA. HG, IG, LG = high grade, intermediate grade, low grade. A hazard ratio greater than 1.0 indicates an increased risk of biochemical recurrence with an increase in the variable of interest.
| Covariate only model | Adjusted model | |||||
|---|---|---|---|---|---|---|
| HR | 95% CI | P value | HR | 95% CI | P value | |
| MRI risk score | 2.33 | (1.80 – 3.02) | <0.0001 | 1.68 | (1.15 – 1.24) | 0.007 |
| Index lesion variables: | ||||||
| Mean CC/C ratio* | 1.12 | (1.02 – 1.23) | 0.02 | 1.04 | (0.93 – 1.16) | 0.47 |
| # voxels in lesion | 1.10 | (1.06 – 1.13) | <0.0001 | 1.07 | (1.04 – 1.11) | <0.0001 |
| Max CC/C ratio* | 1.08 | (1.03 – 1.12) | 0.0003 | 1.04 | (0.99 – 1.09) | 0.06 |
| # HG voxels | 1.10 | (1.06 – 1.15) | <0.0001 | 1.08 | (1.03 – 1.13) | 0.002 |
| # IG voxels | 1.18 | (1.12 – 1.25) | <0.0001 | 1.13 | (1.06 – 1.21) | 0.003 |
| # LG voxels | 1.08 | (0.83 – 1.40) | 0.58 | 1.09 | (0.82 – 1.46) | 0.56 |
| # HG + IG voxels | 1.10 | (1.06 – 1.13) | <0.0001 | 1.07 | (1.03 – 1.11) | 0.0002 |
| % HG voxels | 1.03 | (1.02 – 1.13) | <0.0001 | 1.02 | (1.00 – 1.03) | 0.03 |
| % IG voxels | 1.00 | (0.99 – 1.01) | 0.57 | 1.0 | (0.98 – 1.01) | 0.51 |
| % LG voxels | 0.97 | (0.95 – 0.99) | 0.009 | 0.98 | (0.95 – 1.00) | 0.08 |
| % HG+IG voxels | 1.02 | (1.00 – 1.03) | 0.009 | 1.01 | (0.99 – 1.02) | 0.39 |
Mean and max CC/C values are based on the 117 patients in which an MRSI lesion was identified.
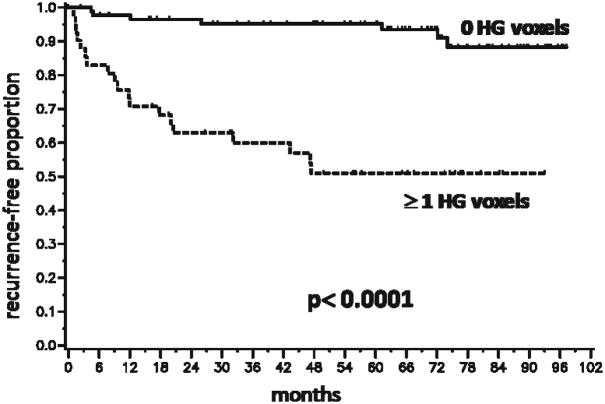
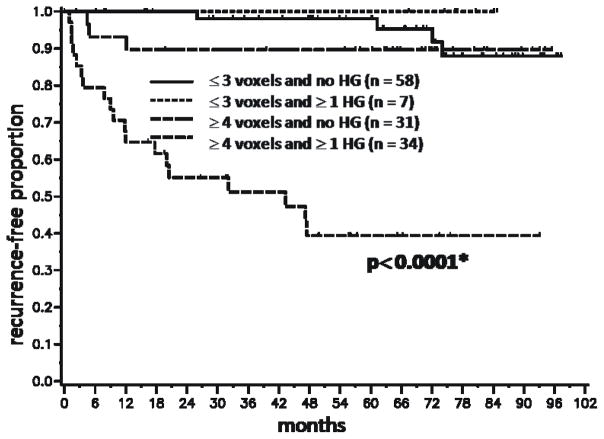
Because the number and grade of the voxels in the MRSI index lesion were significantly associated with BCR, we performed Kaplan-Meier analyses based on dichotomized variables reflecting these parameters(Figs.3 and 4). Figure 3 demonstrates a significant difference in outcome between patients with index lesions comprised of 3 or fewer voxels compared to those with index lesions comprised of 4 or more voxels (P < 0.0001). Based on a voxel volume of 0.125 cm3, 4 or more voxels corresponds to an index lesion volume greater than 0.5 cm3. The presence of at least one high grade voxel was associated with a higher rate of recurrence (P < 0.0001)(Fig. 4). To illustrate the combined effect of the number of voxels and a high grade component, a Kaplan-Meier analysis was done with patients segregated into four cohorts (Fig. 5). The cohort with 4 or more index lesion voxels of which at least one was high grade had significantly poorer BCR-free survival than the other cohorts (p < 0.0001). In fact, 19 of the 26 biochemical recurrences were in this “high risk” cohort. The pre-surgical clinical data for this cohort included median PSA of 7.0 (range 3.5–76.8), median biopsy Gleason score of 7 (range 6–9), and median clinical stage of T2a (rangeT1–T2c).
Figure 3.
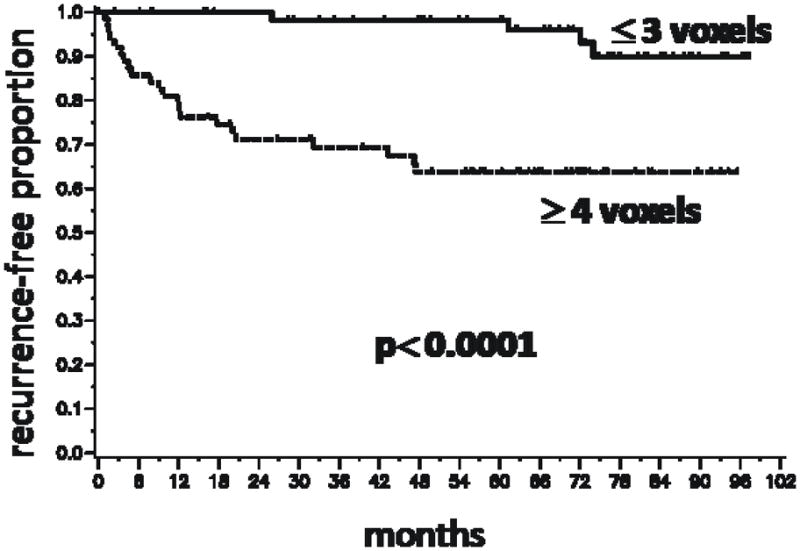
Kaplan-Meier time-to-biochemical recurrence plots for 130 patients following radical prostatectomy segregated by the number of voxels in the MRSI index lesion. The number of voxels in the index lesion was segregated into less than or equal to 3 vs. greater than or equal to 4 based on the median value of 3.5 voxels in all MRSI index lesions. A lesion size of 3 voxels corresponds to 0.5 cm3.
Figure 4.
Kaplan-Meier time-to-biochemical recurrence plots for 130 patients following radical prostatectomy segregated by the presence or absence of high grade voxels in the MRSI index lesion. HG = high grade. The segregation was based on the median number of HG voxels in an index lesion being 0.
Figure 5.
Kaplan-Meier time-to-biochemical recurrence plots for 130 patients following radical prostatectomy segregated by the number of index lesion voxels and the presence or absence of at least one high grade voxel in the index lesion. The cohorts included patients with ≤ 3 index lesion voxels and 0 high grade voxels, patients with ≤ 3 index lesion voxels and at least one high grade voxel, patients with ≥ 4 index lesion voxels and 0 high grade voxels, and patients with ≥ 4 index lesion voxels and at least one high grade voxel. HG = high grade. Asterisk indicates significance compared to each of the other three cohorts. The times-to-recurrence for the first 3 cohorts did not differ significantly from each other.
Patients with 4 or more index lesion voxels but without a high grade voxel fared significantly better than those with at least one high grade voxel (Fig. 4). The pathology findings in each of the 4 sub-groups were reviewed (Table 5). Eighteen of the 20 false positives were in the group of index lesions comprised of 1–3 voxels and no high grade voxels, i.e. small index lesions with relatively low metabolite ratios. Row 4 shows that in the population with 4 or more voxels in the index lesion but without high grade voxels, 30/31 lesions were true positives. Thus, there was a pathologically-confirmed tumor in all of these patients except one, but the lack of any high grade MRSI voxels conferred a better prognosis. All 34 lesions with 4 or more voxels and at least one high grade voxel were true positives.
Table 5.
MRSI index lesion data compared with pathology findings. The false negative lesions* are those where MRSI detected no abnormality but pathology detected at least one peripheral zone lesion.
| Patients (N) | voxels in index lesion (N) | high grade voxels in index lesion (N) | true positive lesions (N) | false positive lesions (N) | false negative lesions (N) |
|---|---|---|---|---|---|
| 13 | 0 | 0 | NA | NA | 13* |
| 45 | 1–3 | 0 | 27 | 18 | NA |
| 7 | 1–3 | ≥ 1 | 6 | 1 | NA |
| 31 | ≥ 4 | 0 | 30 | 1 | NA |
| 34 | ≥ 4 | ≥ 1 | 34 | 0 | NA |
When the dichotomized MRSI variables were incorporated in univariate models for prediction of BCR, the p value for ≤ 3 vs. ≥ 4 voxels was 0.0003, and the p value for 0 HG voxels vs. ≥ 1 o HG voxels was < 0.0001. In the adjusted model which included clinical data, the p value for number of voxels was 0.07, and the p value for HG voxels was 0.002. Thus, using the cutoff value of 3 or fewer voxels in the index lesion for predicting BCR was not quite significant in the adjusted model. The limited number of failure events in this study may preclude defining an optimal cutoff in voxel number. Finally, a multivariate analysis was performed including the clinical variables, the MRI risk score, the number of MRSI index lesion voxels as a continuous variable, and the presence or absence of at least one high grade voxel (Table 6). The two MRSI variables remained significant predictors of BCR(number of voxels in index lesion: p = 0.002, presence of at least one HG voxel: p = 0.02). The MRI index became insignificant if either MRSI variable was included in the model (p = 0.68, p = 0.71, respectively). Clinical stage was also insignificant.
Table 6.
Results of the multivariate model for predicting biochemical recurrence.
| HR | 95% CI | P value | |
|---|---|---|---|
| PSA | 1.03 | (1.00 – 1.05) | 0.05 |
| Gleason <=6 | ref | 0.002 | |
| Gleason 7+ | 25.0 | (3.3 – 190) | |
| Stage T1 | ref | 0.15 | |
| Stage T2A, T2B | 2.87 | (0.98 – 8.4) | |
| Stage T2C | 2.65 | (0.68 – 10.3) | |
| No high grade voxels | ref | - | 0.02 |
| ≥ 1 high grade voxel | 3.28 | (1.18 – 9.12) | |
| number of voxels in lesion | 1.06 | (1.02 – 1.10) | 0.002 |
Discussion
The current study demonstrates that pre-operative MRI and MRSI measurements are associated with time-to-BCR after radical prostatectomy. The MRI risk score was positively correlated with the probability of BCR and was an independent predictor of BCR in a model of recurrence which included standard pre-operative clinical data. This agrees with the results of an MRI-only study of a larger population conducted at our institution of which the current population was a subset 13 (see Methods). Very few studies to date have attempted to correlate endorectal MRI data with BCR after radical prostatectomy. D’Amico et. al. found that after controlling for clinical T stage, PSA, biopsy Gleason score and percentage of biopsy cores positive, MRI stage was prognostic in patients who were considered “intermediate risk” but not in low risk or high risk patients 16.
The number of voxels in the MRSI index lesion as a continuous variable and the presence of high grade voxels were significantly associated with BCR in a multivariate model including pre-operative clinical parameters. This indicates that not only the size, but the degree of metabolic abnormality in the MRSI index lesion is related to the risk of BCR. The predictive utility of the MRSI parameters studied here may be related to their ability to stand as surrogates for pathological parameters determined at surgery such as Gleason score and tumor volume. Multiple studies have linked one or both of these parameters to the risk of biochemical failure 4, 17–20. We previously showed in the same population a positive correlation between the metabolic abnormality as represented by [Cho+Cr]/Cit and the pathological lesion Gleason score 9. In the current study, the number and percentage of high grade voxels in the MRSI index lesion were correlated with BCR. Our results strikingly reflect the results of a pathological study by Stamey and colleagues which found that the volume of the largest tumor and the percentage of high grade (Gleason 4/5) cancer in the tumor were independently associated with BCR in 379 patients with peripheral zone cancer 18. Others have also reported that the amount or percentage of high grade cancer in either the biopsy specimen 21–22 or the radical prostatectomy specimen 21–23 correlated with BCR. In addition, Stamey, et. al. also noted that patients with relatively high percentages of high grade disease who did not fail had much smaller tumors than those who failed. This is similar to our result that patients with smaller index lesions (≤ 0.5 cm3) with at least one high grade voxel fared better than patients with larger lesions and at least one high grade voxel.
One might expect the presence of high grade MRSI voxels to correlate with increased biopsy Gleason grade. However, in this study, the presence of one or more high grade voxels remained significant in the model adjusted for PSA, clinical stage and biopsy Gleason score. This suggests that the MRSI grade information is independent of the biopsy Gleason score. One factor which may contribute to this is that due to sampling limitations, the biopsy Gleason score may not fully reflect the aggressiveness of the tumor. Others have shown that if the length or percentage of high grade cancer in the biopsy specimen is included in a multivariate pre-operative prognostic model, the biopsy Gleason score becomes insignificant 21.
In our multivariate model which included both the number of voxels in the index lesion and presence/absence of HG voxels, clinical stage became insignificant (p = 0.15)as a predictor of BCR. It is possible that the combined information provided by MRSI about tumor volume and degree of metabolic abnormality supplants the extent of disease given by the clinical stage. In addition, there were no clinical T3 patients which could have given clinical stage more impact. The MRI index, which also indicates local extent of disease, was also in significant when either MRSI variable was included. However, these results should be interpreted with caution due to the limited patient numbers in this study.
A limited number of studies have assessed endorectal MRSI as a prognostic indicator in prostate cancer. Yu, et. al. found that within a given lobe of the prostate, the number of suspicious MRSI voxels per cross-section correlated with the chance of pathologic ECE 24. Since ECE is a predictor of poor outcome in prostate cancer 25–26, this study tends to support the relationship between the number of index lesion voxels and BCR in the current study. The same group found the strongest predictor of BCR after radiation therapy to be MRSI tumor volume 27; however, the degree of MRSI metabolic abnormality was not reported. The finding with respect to MRSI tumor volume is similar to ours, suggesting MRSI may be prognostic for multiple treatment modalities. Finally, in a study of 92 men who selected active surveillance, the finding of in apparent tumor on MRI/MRSI did not predict which patients had eventually recurred 28.
The results of our study suggest that we can identify a population with a high likelihood of recurrence after radical prostatectomy based on high MRSI tumor volume and grade. This finding should be verified in a larger population. With such data, we could also determine whether baseline MRI/MRSI data gives incremental value to the pre-operative nomogram. Potentially, these high risk patients could be considered for inclusion in clinical trials investigating men with high risk but clinically localized prostate cancer.
The current study had some limitations. Information on the percentage of positive cores in the biopsy was not available for all patients and thus was not included in the model. MRI tumor volume was not assessed because the accuracy of MRI for measuring prostate cancer volume is limited 29. Patients with tumors only in the transition zone, as identified at surgical pathology, were not included (see Methods). It is well-known that biochemical failure does not necessarily reflect clinical failure and further followup on these patients would be valuable. Finally, due to the limited number of subjects, this study should be considered a preliminary analysis which requires validation in larger populations.
We did not include post-surgery pathological data in the multivariate model of recurrence. The goal of the current study was to test the hypothesis that baseline MRI/MRSI data correlated with biochemical recurrence and thus could have value in the pre-operative setting. We believe this value comes from acting as a non-invasive surrogate for tumor volume and aggressiveness.
Conclusions
In a model adjusted for clinical stage, biopsy Gleason score and PSA, the MRSI index lesion volume and the presence of high grade MRSI voxels correlated with time-to-biochemical failure after radical prostatectomy. Tumor metabolic information provided by endorectal MRI/MRSI identified patients with a high risk for relapse after radical prostatectomy and thus may be a predictive marker in prostate cancer. In the future, we plan to assess data from a larger population with the goal of determining whether baseline MRI/MRSI data gives incremental value to the pre-operative nomogram.
Supplementary Material
Acknowledgments
Authors Zakian, Hricak, Ishill, Shukla-Dave and Wang were supported by NIH R01-CA076423.
Footnotes
Portions of this work were presented at the Radiological Society of North America 95th Annual Meeting, 2009.
References
- 1.Kattan MW, Eastham JA, Stapleton AMF, et al. A Preoperative Nomogram for Disease Recurrence Following Radical Prostatectomy for Prostate Cancer. J NCI. 1998;90:766. doi: 10.1093/jnci/90.10.766. [DOI] [PubMed] [Google Scholar]
- 2.Stephenson AJ, Scardino PT, Eastham JA, et al. Preoperative nomogram predicting the 10-year probability of prostate cancer recurrence after radical prostatectomy. J Natl Cancer Inst. 2006;98:715. doi: 10.1093/jnci/djj190. [DOI] [PMC free article] [PubMed] [Google Scholar]
- 3.Han M, Partin AW, Zahurak M, et al. Biochemical (prostate specific antigen) recurrence probability following radical prostatectomy for clinically localized prostate cancer. J Urol. 2003;169:517. doi: 10.1097/01.ju.0000045749.90353.c7. [DOI] [PubMed] [Google Scholar]
- 4.Kattan MW, Wheeler TM, Scardino PT. Postoperative nomogram for disease recurrence after radical prostatectomy for prostate cancer. J Clin Oncol. 1999;17:1499. doi: 10.1200/JCO.1999.17.5.1499. [DOI] [PubMed] [Google Scholar]
- 5.Kattan MW, Vickers AJ, Yu C, et al. Preoperative and postoperative nomograms incorporating surgeon experience for clinically localized prostate cancer. Cancer. 2009;115:1005. doi: 10.1002/cncr.24083. [DOI] [PMC free article] [PubMed] [Google Scholar]
- 6.Wang L, Hricak H, Kattan MW, et al. Prediction of organ-confined prostate cancer: incremental value of MR imaging and MR spectroscopic imaging to staging nomograms. Radiology. 2006;238:597. doi: 10.1148/radiol.2382041905. [DOI] [PubMed] [Google Scholar]
- 7.Nakashima J, Tanimoto A, Imai Y, et al. Endorectal MRI for prediction of tumor site, tumor size, and local extension of prostate cancer. Urology. 2004;64:101. doi: 10.1016/j.urology.2004.02.036. [DOI] [PubMed] [Google Scholar]
- 8.Vigneron DB, Males R, Noworolski S, et al. 3D MRSI of Prostate Cancer: Correlation with Histologic Grade. Presented at the International Society of Magnetic Resonance in Medicine Sixth Scientific Meeting; Sydney. 1998. [Google Scholar]
- 9.Zakian KL, Sircar K, Hricak H, et al. Correlation of proton MR spectroscopic imaging with gleason score based on step-section pathologic analysis after radical prostatectomy. Radiology. 2005;234:804. doi: 10.1148/radiol.2343040363. [DOI] [PubMed] [Google Scholar]
- 10.Kurhanewicz J, Vigneron DB, Hricak H, et al. Three-dimensional H-1 MR Spectroscopic Imaging of the in Situ Human Prostate with High (0.24–0.7-cm3) Spatial Resolution. Radiology. 1996;198:795. doi: 10.1148/radiology.198.3.8628874. [DOI] [PubMed] [Google Scholar]
- 11.Star-Lack J, Nelson SJ, Kurhanewicz J, et al. Improved Water and Lipid Suppression for 3D PRESS CSI Using RF Band Selective Inversion with Gradient Dephasing (BASING) Magn Reson Med. 1997;38:311. doi: 10.1002/mrm.1910380222. [DOI] [PubMed] [Google Scholar]
- 12.Nelson SJ, Day MR, Carvajal L. Methods for Analysis of Serial Volume MRI and 1H MRS Data for the Assessment of Response to Therapy in Patients with Brain Tumors. Presented at the Society of Magnetic Resonance; 1995; Nice; 1995. [Google Scholar]
- 13.Fuchsjager MH, Shukla-Dave A, Hricak H, et al. Magnetic resonance imaging in the prediction of biochemical recurrence of prostate cancer after radical prostatectomy. BJU Int. 2009;104:315. doi: 10.1111/j.1464-410X.2009.08406.x. [DOI] [PubMed] [Google Scholar]
- 14.Pucar D, Koutcher JA, Shah A, et al. Preliminary assessment of magnetic resonance spectroscopic imaging in predicting treatment outcome in patients with prostate cancer at high risk for relapse. Clin Prostate Cancer. 2004;3:174. doi: 10.3816/cgc.2004.n.028. [DOI] [PubMed] [Google Scholar]
- 15.Kaplan EL, Meier P. Nonparametric estimation from incomplete observations. Journal of the American Statistical Association. 1958;53:457. [Google Scholar]
- 16.D’Amico AV, Whittington R, Malkowicz B, et al. Endorectal magnetic resonance imaging as a predictor of biochemical outcome after radical prostatectomy in men with clinically localized prostate cancer. J Urol. 2000;164:759. doi: 10.1097/00005392-200009010-00032. [DOI] [PubMed] [Google Scholar]
- 17.Nelson BA, Shappell SB, Chang SS, et al. Tumour volume is an independent predictor of prostate-specific antigen recurrence in patients undergoing radical prostatectomy for clinically localized prostate cancer. BJU Int. 2006;97:1169. doi: 10.1111/j.1464-410X.2006.06148.x. [DOI] [PubMed] [Google Scholar]
- 18.Stamey TA, McNeal JE, Yemoto CM, et al. Biological determinants of cancer progression in men with prostate cancer. JAMA. 1999;281:1395. doi: 10.1001/jama.281.15.1395. [DOI] [PubMed] [Google Scholar]
- 19.Noguchi M, Stamey TA, McNeal JE, et al. Preoperative serum prostate specific antigen does not reflect biochemical failure rates after radical prostatectomy in men with large volume cancers. J Urol. 2000;164:1596. [PubMed] [Google Scholar]
- 20.Epstein JI, Carmichael M, Partin AW, et al. Is tumor volume an independent predictor of progression following radical prostatectomy? A multivariate analysis of 185 clinical stage B adenocarcinomas of the prostate with 5 years of followup. J Urol. 1993;149:1478. doi: 10.1016/s0022-5347(17)36421-2. [DOI] [PubMed] [Google Scholar]
- 21.Vis AN, Roemeling S, Kranse R, et al. Should we replace the Gleason score with the amount of high-grade prostate cancer? Eur Urol. 2007;51:931. doi: 10.1016/j.eururo.2006.07.051. [DOI] [PubMed] [Google Scholar]
- 22.Graefen M, Noldus J, Pichlmeier U, et al. Early prostate-specific antigen relapse after radical retropubic prostatectomy: prediction on the basis of preoperative and postoperative tumor characteristics. Eur Urol. 1999;36:21. doi: 10.1159/000019922. [DOI] [PubMed] [Google Scholar]
- 23.Cheng L, Davidson DD, Lin H, et al. Percentage of Gleason pattern 4 and 5 predicts survival after radical prostatectomy. Cancer. 2007;110:1967. doi: 10.1002/cncr.23004. [DOI] [PubMed] [Google Scholar]
- 24.Yu KK, Scheidler J, Hricak H, et al. Prostate cancer: prediction of extracapsular extension with endorectal MR imaging and three-dimensional proton MR spectroscopic imaging. Radiology. 1999;213:481. doi: 10.1148/radiology.213.2.r99nv26481. [DOI] [PubMed] [Google Scholar]
- 25.Stephenson AJ, Scardino PT, Eastham JA, et al. Postoperative nomogram predicting the 10-year probability of prostate cancer recurrence after radical prostatectomy. J Clin Oncol. 2005;23:7005. doi: 10.1200/JCO.2005.01.867. [DOI] [PMC free article] [PubMed] [Google Scholar]
- 26.Swindle P, Eastham JA, Ohori M, et al. Do margins matter? The prognostic significance of positive surgical margins in radical prostatectomy specimens. J Urol. 2005;174:903. doi: 10.1097/01.ju.0000169475.00949.78. [DOI] [PubMed] [Google Scholar]
- 27.Joseph T, McKenna DA, Westphalen AC, et al. Pretreatment endorectal magnetic resonance imaging and magnetic resonance spectroscopic imaging features of prostate cancer as predictors of response to external beam radiotherapy. Int J Radiat Oncol Biol Phys. 2009;73:665. doi: 10.1016/j.ijrobp.2008.04.056. [DOI] [PMC free article] [PubMed] [Google Scholar]
- 28.Cabrera AR, Coakley FV, Westphalen AC, et al. Prostate cancer: is inapparent tumor at endorectal MR and MR spectroscopic imaging a favorable prognostic finding in patients who select active surveillance? Radiology. 2008;247:444. doi: 10.1148/radiol.2472070770. [DOI] [PMC free article] [PubMed] [Google Scholar]
- 29.Coakley FV, Kurhanewicz J, Lu Y, et al. Prostate cancer tumor volume: measurement with endorectal MR and MR spectroscopic imaging. Radiology. 2002;223:91. doi: 10.1148/radiol.2231010575. [DOI] [PubMed] [Google Scholar]
- 30.Males R, Vigneron D, Star-Lack J, et al. Clinical application of BASING and spectral/spatial water and lipid suppression pulses for prostate cancer staging and localization by in vivo 3D 1H magnetic resonance spectroscopic imaging. Magn Reson Med. 2000;43:17. doi: 10.1002/(sici)1522-2594(200001)43:1<17::aid-mrm3>3.0.co;2-6. [DOI] [PubMed] [Google Scholar]
Associated Data
This section collects any data citations, data availability statements, or supplementary materials included in this article.


