Abstract
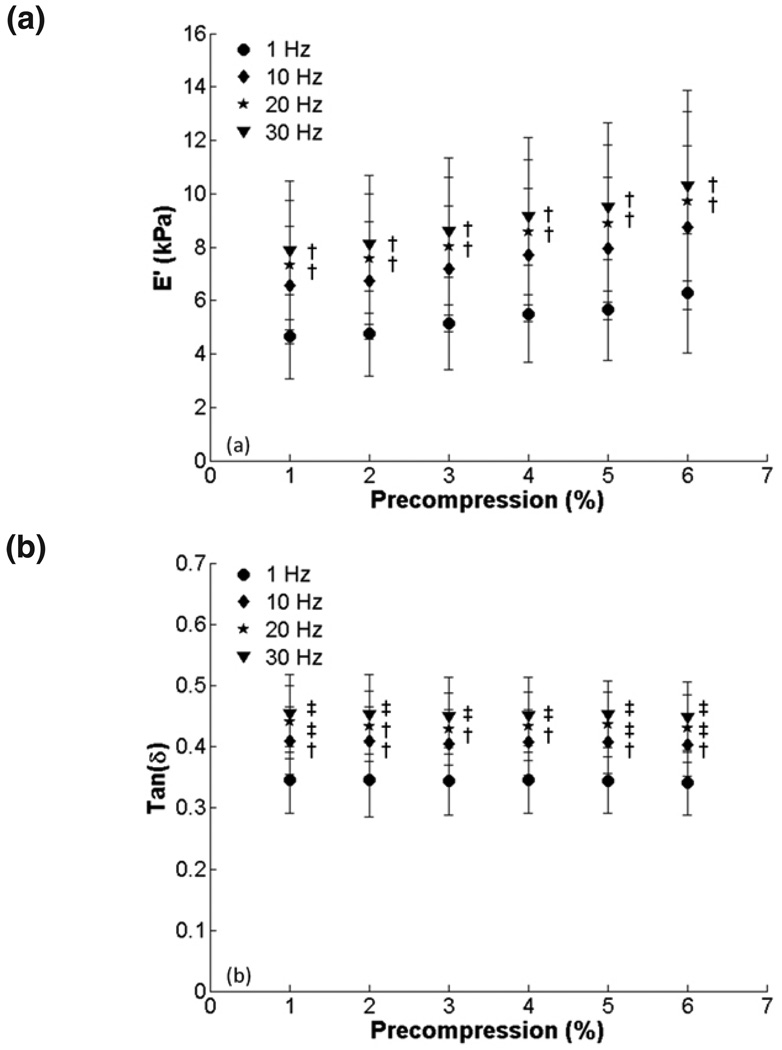
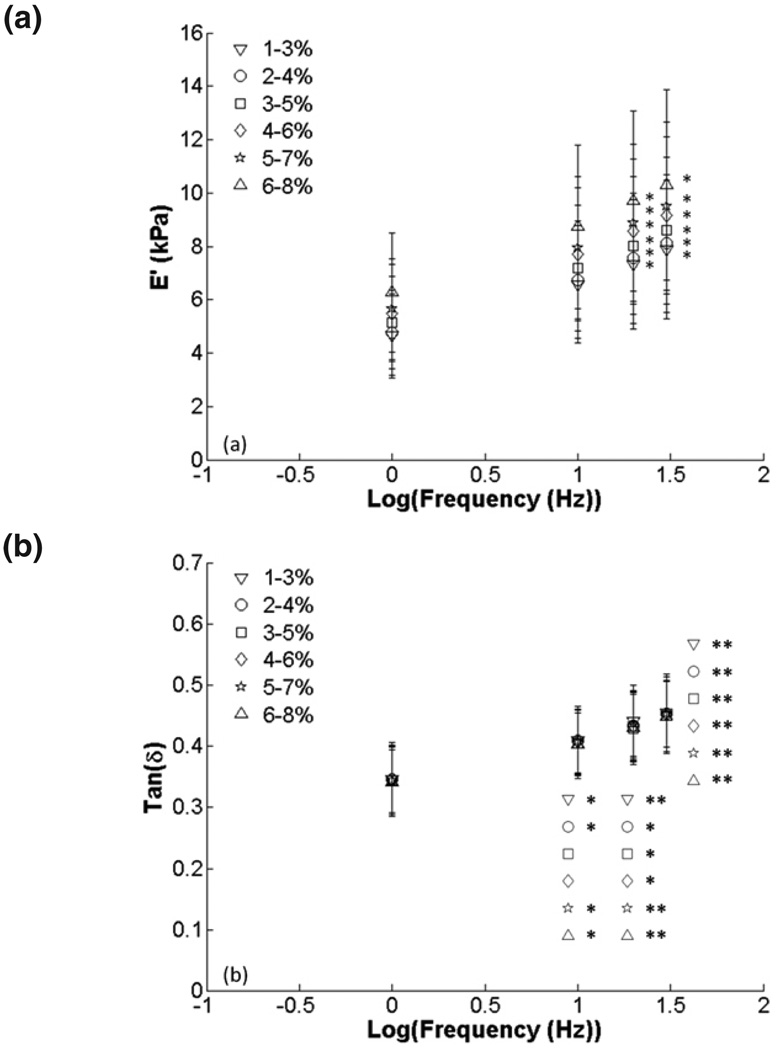
We have characterized the viscoelastic properties of human cervical tissue through a range of pre-compressional loads and testing frequencies. Mechanical testing is necessary to develop robust elasticity-based techniques for the diagnosis of cervical abnormalities. The storage modulus (E’) and material damping (tan δ) were measured in 13 patients, 40 to 76 years old. Our results showed that E’ increased monotonically from approximately 4.7 to 6.3 kPa over the precompression range (1–6%) for a testing frequency of 1 Hz. Increases in precompressions of 4% or greater significantly increased E’ obtained after dynamic compression testing when data were normalized to 1% precompression. Tan δ remained fairly constant (~0.35) and was not significantly affected by changes in precompression. E’ and tan δ increased significantly with frequency. E’ monotonically increased from 4.7 to 7.9 kPa for the 1–3% compression range (lowest precompression for 2% amplitude) and from 6.3 to 10.3 kPa for the 6–8% range (highest precompression for 2% amplitude) when increasing frequency from 1 to 30 Hz. Tan δ increased montonically from 0.35 to 0.45 for 2% amplitude compressions from 1 to 30 Hz regardless of initial precompression. Our results show that precompression and testing frequency must be taken into account in order to obtain consistent measurements in mechanical diagnostic tests developed for cervical abnormalities.
Keywords: Dynamic testing, storage modulus, tan δ, precompression, viscoelasticity
1. INTRODUCTION
Changes in tissue stiffness may correlate with pathological changes, as many diseases lead to structural modifications that alter tissue mechanical properties.1 Clinicians often exploit stiffness variations in tissue during palpation to qualitatively assess the health or disease in tissues such as the liver, breast and cervix. Liver diseases such as hepatitis B and hepatitis C cause inflammation, which leads to scarring.2 The gradual replacement of normal liver tissue with fibrotic scar tissue leads to progressive stiffening of the liver, which may be detected using manual palpation.3 Breast cancers often present as hard nodules in the surrounding soft background and are found by palpating the abnormality during examinations.4 Cervical insufficiency, a condition that may result in miscarriage as a result of mechanical failure, is diagnosed using the Bishop score, which uses palpation (i.e. consistency) as one of the criteria in diagnosis.5
Manual palpation provides a means of detecting abnormalities but can be very subjective. New techniques are being developed to quantify the mechanical properties of tissue that may provide more definitive diagnoses and more information about disease state. One approach that is gaining popularity is ultrasound elastography. Traditionally, ultrasound has been used to image tissue backscatter but echogenic properties of tissue have not been shown to correlate with disease.6– 7 Recently, ultrasound has been used to quantify and image mechanical properties of tissue through the development of elastographic techniques.
For example, 1-D transient elastography (Fibroscan®) has been developed to determine the degree of liver fibrosis. In this technique, shear waves are generated by an external transient perturbation. By tracking shear waves, shear wave velocity can be determined, which is related to the Young’s Modulus (i.e. stiffness) of the tissue. Studies using Fibroscan® have shown that shear wave velocity increases with increasing fibrosis score.8 Acoustic radiation force impulse (ARFI) imaging has shown the feasibility of quantifying shear wave velocity in the liver and breast by tracking shear waves generated with acoustic radiation force.9, 10
There has been increasing interest in using mechanical characterization for the diagnosis of cervical and uterine abnormalities. Compression-based elastography uses cross-correlation to compare pre- and postdisplacement radiofrequency data to generate a displacement or strain image.11 A preliminary study has demonstrated that compression-based elastography could differentiate endometrial polyps and leiomyomas in excised uteri, illustrating the potential for this technique to be used as an extension of routine transvaginal ultrasound examinations to detect uterine and cervical abnormalities.12 Clinically, this has been validated using real-time elastography to differentiate normal and malignant tissue during cervical examinations.13 The utility of elastography to diagnose cervical insufficiency has also been investigated. Preliminary results show that tissue stiffness is lower in the vicinity of the cervical canal and increases moving away from the canal.14 Fibroscan® and ARFI are other candidates that could be used in the diagnosis of cervical abnormalities. More work is needed before the utility of these approaches can be validated.
Other work has focused on developing a mechanical testing apparatus to be used to estimate cervical stiffness. For example, an aspiration device has been developed that uses negative pressure to lift the anterior lip of the cervix.15 Knowledge of the load (i.e. negative pressure) and displacement (i.e., height of the lift) allow calculation of the cervical stiffness.
Quantitative mechanical techniques hold promise as clinical diagnostic tools for cervical abnormalities. However, one must be careful when interpreting the results, as cervical tissue exhibits the nonlinear behavior of soft tissues.1 Compression can influence the results of these diagnostic tests but some amount of precompression is necessary for measuring tissue mechanical properties. The aspiration technique requires compression to ensure the formation of a vacuum within the device. Ultrasound-based techniques require compression to guarantee coupling between the transducer and the tissue. A question that one might ask is how much does this compression influence testing results?
Ex vivo analysis has been used to quantify mechanical properties of the cervix because of the relative control of mechanical testing over in vivo experiments. Ramp loading has been performed on cervical ring sections in confined and unconfined compression after compressing samples up to 20% nominal axial strain to quantify nonlinear elastic properties.16 However, viscoelastic (i.e. time- and frequency-dependent) properties were not quantified. Kiss et al quantified viscoelastic properties of samples of cervix tissue over a range of frequencies with small amounts of precompression (1–2%) but did not investigate changes in viscoelastic properties with increasing precompression.17 In this study, we build on this work by quantifying the viscoelastic properties of normal human cervix tissue through a range of precompressions, compression amplitudes and testing frequencies to investigate how varying compression affects the measured viscoelastic properties.
2. MATERIALS AND METHODS
2.1 Theory
Determining the properties of a viscoelastic material using dynamic testing is well-described.18, 19 A brief summary of these more extensive derivations is presented in this section. Viscoelastic materials exhibit time- and frequency-dependent behavior. That is, for an applied strain or stress, there is a corresponding time- or frequency-dependent stress or strain response, respectively. For a linearly viscoelastic, isotropic material subjected to a sinusoidal deformation (strain), the dynamic response of stress (σ) can be related to strain (ε) using the Boltzmann super position integral:
| (1) |
where E(t) is the relaxation modulus. The lower limit of the integral is −∝ because a true sinusoid has no starting point. The sinusoidal strain history can be represented as
| (2) |
where ε0 is the peak strain amplitude and ω is the angular frequency in radians per second. The stress response will follow the strain but will be shifted by a phase angle δ:
| (3) |
where σ0 is the peak stress amplitude. Substituting Eqs. (2) and (3) into Eq. (1) and taking the Fourier transform yields
| (4) |
where E*(ω) is the frequency-dependent complex modulus of the material. The phase shift between the stress and strain (Eq. 3) results in
| (5) |
where E’ is the storage modulus and E’’ is the loss modulus. E’ represents the energy stored each cycle, while E’’ represents the energy dissipated. Material damping is often expressed as the ratio of these two quantities:
| (6) |
2.2 Experiment
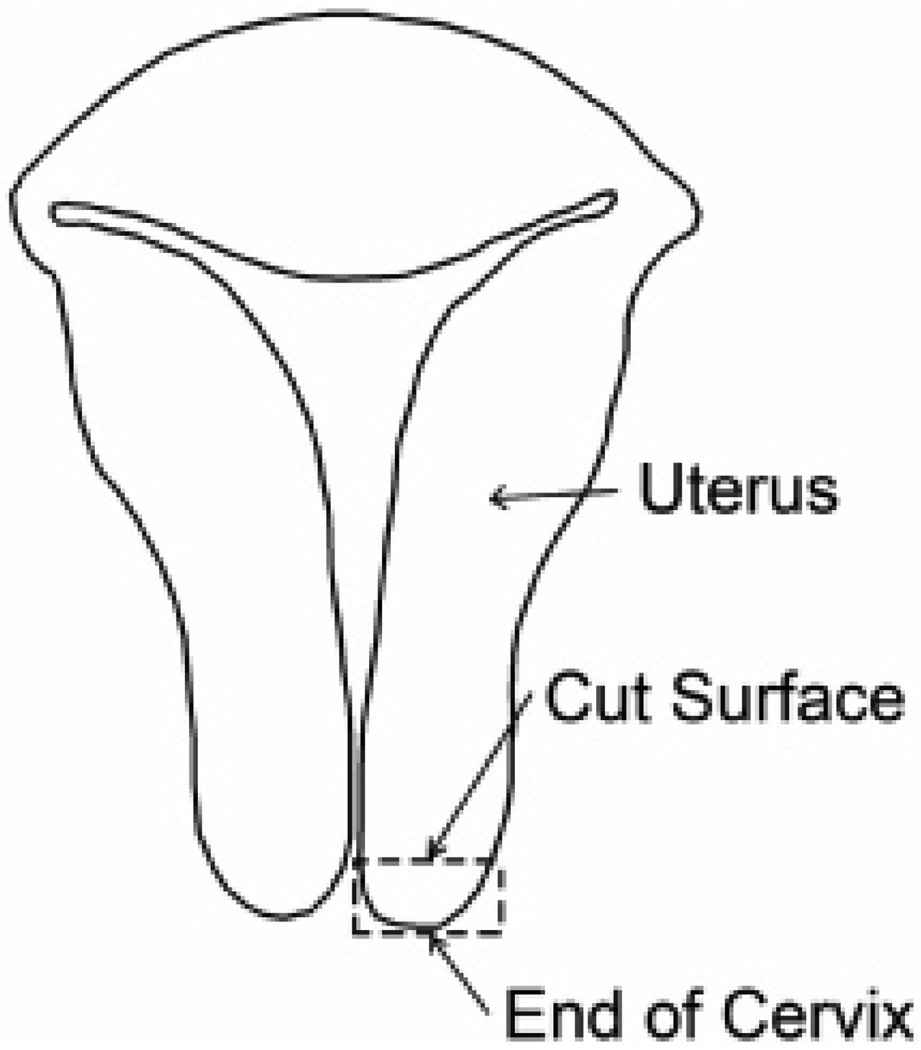
Cervix samples from 13 women aged 40 to 76 years (58.8 ± 12.5 years) were obtained from the UW Pathology Lab. Each sample was obtained from a patient who underwent a hysterectomy. All surgeries were performed at the University of Wisconsin Hospital and Clinics (Madison, WI). Following hysterectomy, the complete uterus was taken to the Surgical Pathology Laboratory, where a one cubic centimeter sample was removed from the end of the cervix, as in figure 1. Ten of the 13 cervices showed no signs of disease, as determined by a trained pathologist. Of the remaining two, one had small Nabothian cysts and the other had an adenocarcinoma in the deep stroma (Table 1). In these two cases, testing samples were taken away from the diseased tissue. The sample was placed in saline solution and transported to our laboratory for dynamic mechanical testing. Samples were typically tested within two hours of acquisition and were kept refrigerated until testing. Before testing, samples were raised to room temperature. If necessary, the samples were shaped on the cut sides to make them square. The dimensions of all sides were measured multiple times using a micrometer and averaged. All protocols and procedures for this study were approved by the University of Wisconsin Institutional Review Board.
FIG. 1.
Diagram of uterus. Cervical specimens were approximately one cubic centimeter and cut from the end of the cervix, as indicated by the dashed box. The cut surface was placed on the bottom platen of the ELF system and the end of the cervix contacted the upper platen.
Table 1.
Patient information.
| Patient | Pregnancies | Menopausal state | Cervical pathology |
|---|---|---|---|
| 1 | 2 | post | Adenocarcinoma in deep stroma |
| 2 | 1 | pre | None |
| 3 | 2 | post | Small Nabothian cysts |
| 4 | 8 | post | None |
| 5 | 2 | post | None |
| 6 | 2 | post | None |
| 7 | 2 | post | None |
| 8 | 4 | pre | None |
| 9 | 7 | post | None |
| 10 | 4 | post | None |
| 11 | 4 | pre | None |
| 12 | 2 | post | None |
| 13 | 2 | pre | None |
All samples were dynamically tested using an EnduraTEC ELF 3220 (Bose Corporation, EnduraTEC Systems Group, Minnetonka, MN). The samples and testing platens were coated with a thin layer of mineral oil to minimize tissue drying and friction at the contact surfaces. The anisotropy of the collagen fibrils comprising the cervix is well documented.20 Previous studies have shown small variations in the complex modulus of uterine tissue dynamically tested with fibers perpendicular or parallel to the compression platens.21 To ensure that the samples were tested with the same fiber orientation, the cut surface opposite the end of the cervix was always placed on the lower platen, which was attached to a load cell. The upper platen always contacted the other end of the cervix and provided the displacement.
Once the contact point was established, the sample was dynamically tested with sinusoidal compressions over a range of compressions and testing frequencies. The system was controlled using ELF dynamic mechanical analysis (DMA) software. Each sample was tested at precompressions ranging from 1 to 6%. For each precompression, samples were tested using dynamic compression amplitudes of 2, 3 and 4%. For example, a sample tested at 1% precompression and 2% amplitude was dynamically tested from 1 to 3% compression, with a mean compression of 2% and amplitude of 1%. For each precompression/amplitude combination, samples were tested at frequencies of 1, 10, 20 and 30 Hz. At each testing frequency, the system dynamically compressed the sample for several cycles before data collection to precondition the tissue.1 There was a 15-second hold between different testing frequencies, during which time the sample was held at the mean strain value (e.g. 2% for a 1–3% test), allowing relaxation before the next test. The DMA software output |E*|, E’, E’’ and tan δ for each testing frequency by determining the force amplitude, displacement amplitude and phase lag at the peak frequency. E’ output by the DMA assumes the area of the sample faces remains the same. Because of the incompressible nature of tissue, a correction factor was applied to the DMA data.
2.3 Statistics
Of the 13 cases, only four were from premenopausal women. Tukey multiple comparisons showed no significant differences between pre- and postmenopausal state for E’, tan δ, normalized E’ (described below) at any compression level and normalized tan δ below 5% precompression. Normalized tan δ showed no significance at the 0.001 level for 5% and 6% precompression. Because of the limited number of samples and the poor correlation between mechanical changes and menopausal state, statistical differences in cervical mechanical properties among different precompressions and frequencies were assessed with pre- and postmenopausal samples lumped into one group. The significance of the overall changes in E’ and tan δ over the precompression range and the frequency range was assessed using a one-way analysis of variance (ANOVA; p < 0.001). Tukey multiple comparisons were used to compare E’ and tan δ at each precompression level or frequency to E’ and tan δ at 1% precompression or 1 Hz frequency, respectively (*, p < 0.05; **, p < 0.001). The significance between groups (e.g. frequency) at each precompression level or frequency was also tested (†, p < 0.05; ‡, p < 0.001). All data are presented as mean ± standard deviation.
3. RESULTS
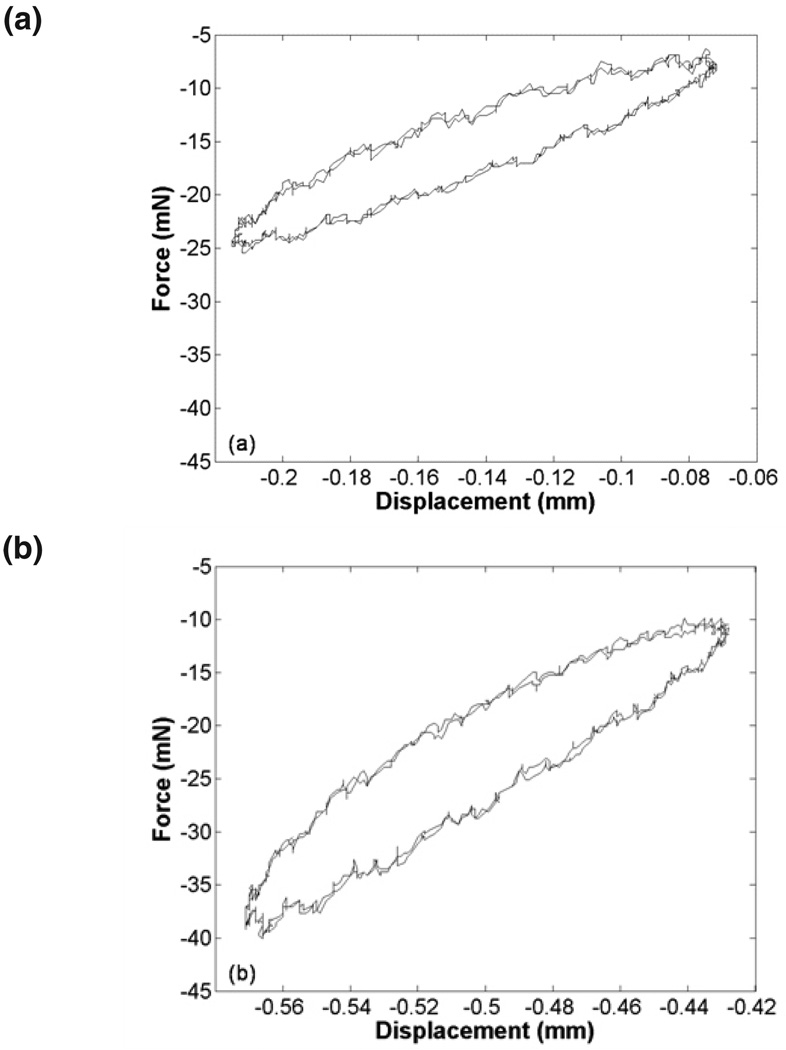
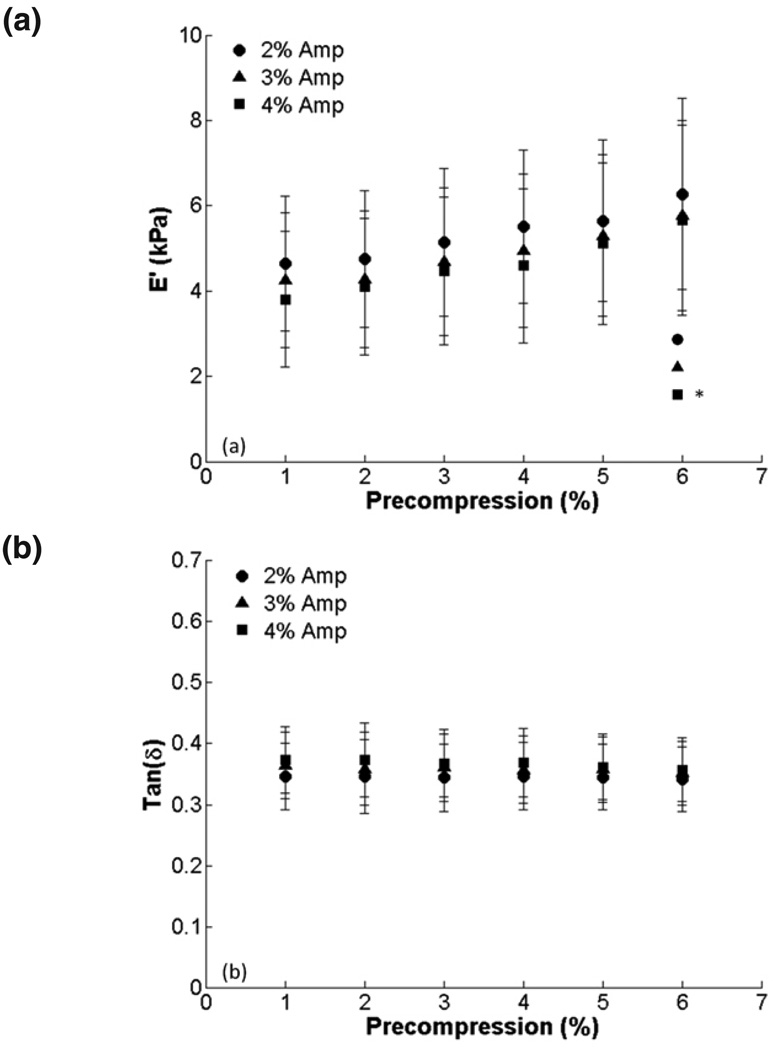
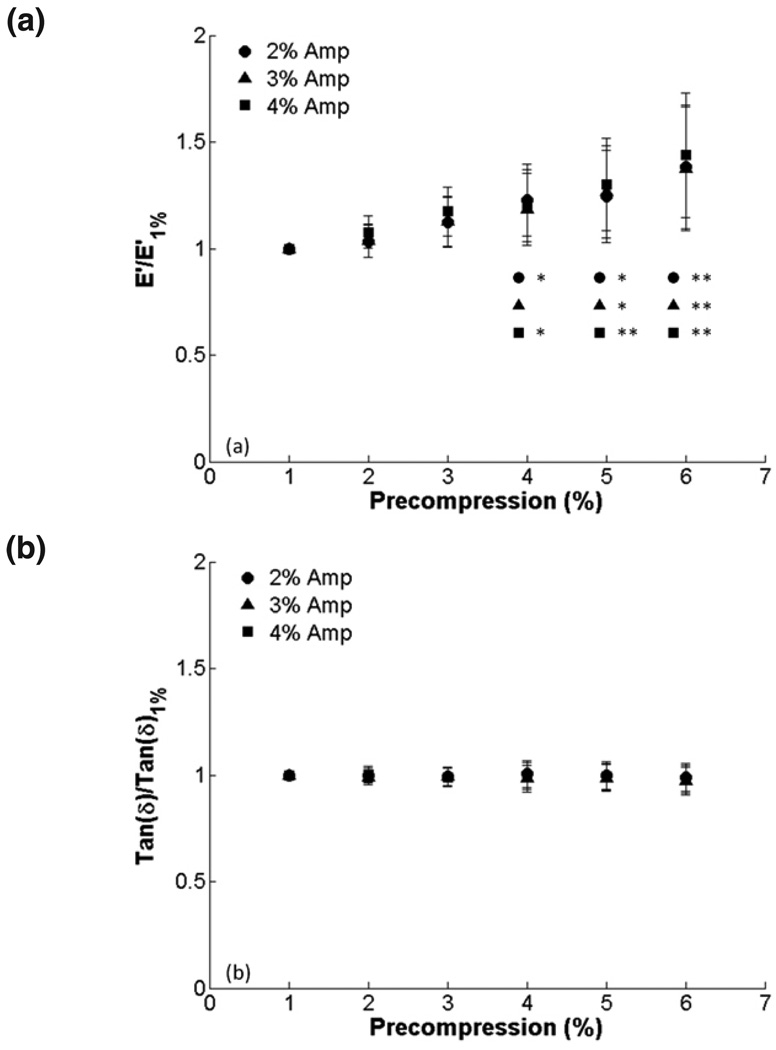
Raw data from a representative sample after 1–3% and 6–8% compression testing are shown in figure 2. In figure 3, E’ and tan δ are quantified for all samples at all the precompression levels for the three amplitude ranges. There is a trend of increasing E’ with increasing precompression, which was statistically significant for 6% precompression and 4% amplitude. Tan δ remained constant over the range of precompression levels. There were no differences among amplitude ranges at any level of precompression for E’ or tan δ. To show changes in E’ relative to minimal precompression for each sample, E’ and tan δ were normalized to the values obtained at 1% precompression. We found significant differences in E’ at 4, 5 and 6% (Fig. 4). Normalized tan δ remained constant, and no significant differences among amplitudes were observed for E’ or tan δ.
FIG. 2.
Representative force-displacement cycles from one cervical specimen: (a) 1–3% compression; (b) 6–8% compression. Note the slope increase for the 6–8% compression cycles.
FIG. 3.
Effect of precompression on viscoelastic properties for 2, 3 and 4 % compression amplitudes (1 Hz compression): (a) E’ and (b) tan δ (*, p < 0.05; **, p < 0.001).
FIG. 4.
Effect of precompression on viscoelastic properties for 2, 3, and 4 % compression amplitudes (1 Hz compression): (a) E’ and (b) tan δ normalized to 1% precompression. There were significant increases in normalized E’ for 4, 5 and 6% precompression when compared to 1% (*, p < 0.05; **, p < 0.001).
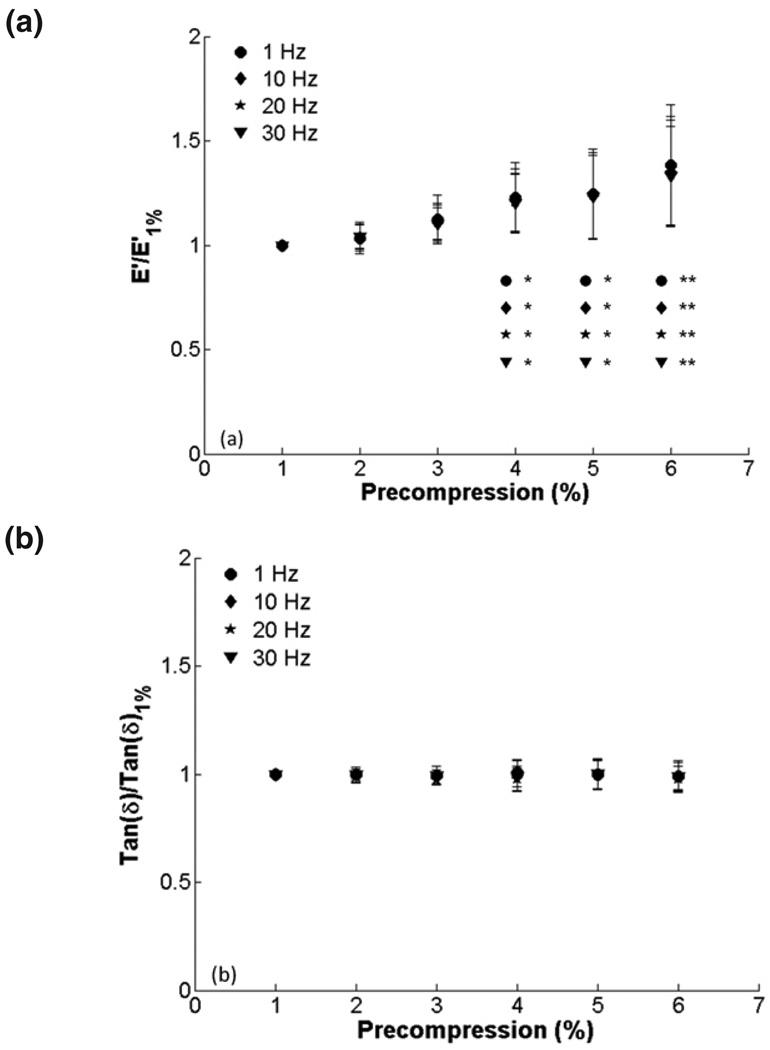
Figure 5 presents E’ and tan δ versus precompression for all testing frequencies. Because there were no differences among amplitudes (Figs. 3, 4), only the 2% amplitude is shown for clarity. There is again a trend of increasing E’ with increasing precompression, but the differences are not significant. Tan δ remained constant with increasing precompression. There were significant increases in E’ and tan δ when higher frequencies were compared to 1 Hz for each precompression level. After the data were normalized to 1% precompression (Fig. 6), E’ was significantly higher for 4% precompression and above, but tan δ was again fairly constant. There were no significant differences in tan δ between frequencies at each precompression level when normalized.
FIG. 5.
Effect of precompression on viscoelastic properties for 1, 10, 20, and 30 Hz testing frequencies (2% compression amplitude): (a) E’ and (b) tan δ. There were significant increases in E’ and tan δ with frequency when compared to 1 Hz at each precompression level (†, p < 0.05; ‡, p < 0.001).
FIG. 6.
Effect of precompression on viscoelastic properties for 1, 10, 20, and 30 Hz testing frequencies (2% compression amplitude): (a) E’ and (b) tan δ normalized to 1% precompression. There were significant increases in normalized E’ for 4, 5, and 6% precompression when compared to 1% (*, p < 0.05; **, p < 0.001).
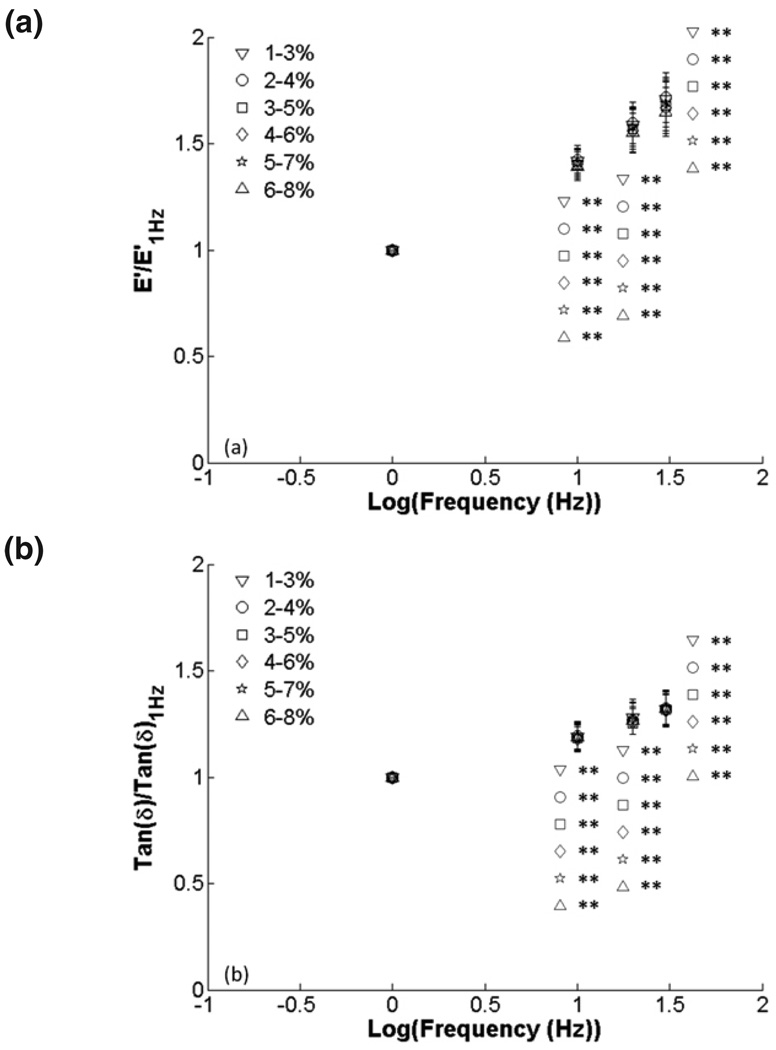
Finally, 2% amplitude data were plotted versus frequency to investigate frequency-dependent behavior (Fig. 7). There were significant increases in E’ at 20 Hz and 30 Hz when compared to 1 Hz and significant increases in tan δ from 10 to 30 Hz frequency. There were no differences among compression ranges at each frequency. Data normalized to 1 Hz frequency showed significant increases in E’ and tan δ (p < 0.001) for all compression ranges from 10–30 Hz but no changes among compression ranges (Fig. 8). All raw data are presented in tables 2 and 3.
FIG. 7.
Effect of frequency on viscoelastic properties for 2% amplitude ranges: (a) E’ and (b) tan δ. There were significant increases in E’ and tan δ with frequency when compared to 1 Hz (*, p < 0.05; **, p < 0.001). Symbols represent different precompression levels.
FIG. 8.
Effect of frequency on viscoelastic properties for 2% amplitude ranges: (a) E’ and (b) tan δ normalized to 1 Hz. There were significant increases in normalized E’ and tan δ with frequency when compared to 1 Hz (*, p < 0.05; **, p < 0.001). Symbols represent different precompression levels.
Table 2.
Changes in E’ with compression range and frequency.
| Compression range (%) | Frequency (Hz) | ||||
|---|---|---|---|---|---|
| 1 | 10 | 20 | 30 | ||
| 2% amplitude | 1–3 | 4.65 ± 1.58 | 6.58 ± 2.21 | 7.32 ± 2.41 | 7.87 ± 2.60 |
| 2–4 | 4.76 ± 1.60 | 6.74 ± 2.19 | 7.55 ± 2.43 | 8.11 ± 2.57 | |
| 3–5 | 5.15 ± 1.73 | 7.20 ± 2.35 | 8.03 ± 2.57 | 8.60 ± 2.76 | |
| 4–7 | 5.51 ± 1.80 | 7.71 ± 2.49 | 8.56 ± 2.72 | 9.15 ± 2.93 | |
| 5–8 | 5.65 ± 1.90 | 7.95 ± 2.66 | 8.89 ± 2.95 | 9.50 ± 3.15 | |
| 6–8 | 6.27 ± 2.23 | 10.30 ± 3.58 | 9.70 ± 3.38 | 10.30 ± 3.5 | |
| 3% amplitude | 1–4 | 4.25 ± 1.46 | 5.98 ± 1.95 | 6.67 ± 2.14 | 7.15 ± 2.27 |
| 2–5 | 4.28 ± 1.42 | 6.03 ± 1.93 | 6.73 ± 2.13 | 7.23 ± 2.29 | |
| 3–6 | 4.69 ± 1.41 | 6.58 ± 1.97 | 7.33 ± 2.16 | 7.88 ± 2.35 | |
| 4–7 | 4.94 ± 1.59 | 6.96 ± 2.21 | 7.79 ± 2.47 | 8.33 ± 2.64 | |
| 5–8 | 5.29 ± 1.94 | 7.39 ± 2.59 | 8.21 ± 2.84 | 8.78 ± 3.01 | |
| 6–9 | 5.77 ± 2.11 | 7.98 ± 2.84 | 8.84 ± 3.12 | 9.44 ± 3.30 | |
| 4% amplitude | 1–5 | 3.81 ± 1.12 | 5.42 ± 1.58 | 6.05 ± 1.76 | 6.50 ± 1.89 |
| 2–6 | 4.10 ± 1.22 | 5.81 ± 1.71 | 6.49 ± 1.90 | 6.96 ± 2.06 | |
| 3–7 | 4.48 ± 1.40 | 6.24 ± 1.91 | 6.96 ± 2.10 | 7.41 ± 2.25 | |
| 4–8 | 4.60 ± 1.60 | 6.46 ± 2.21 | 7.21 ± 2.42 | 7.70 ± 2.58 | |
| 5–9 | 5.11 ± 1.75 | 7.15 ± 2.38 | 7.95 ± 2.60 | 8.51 ± 2.77 | |
| 6–10 | 5.66 ± 2.02 | 7.79 ± 2.68 | 8.63 ± 2.90 | 9.18 ± 3.08 | |
Table 3.
Changes in tan δ with compression range and frequency.
| Compression range (%) | Frequency (Hz) | ||||
|---|---|---|---|---|---|
| 1 | 10 | 20 | 30 | ||
| 2% amplitude | 1–3 | 0.35 ± 0.05 | 0.41 ± 0.06 | 0.44 ± 0.06 | 0.46 ± 0.06 |
| 2–4 | 0.35 ± 0.06 | 0.41 ± 0.06 | 0.43 ± 0.06 | 0.45 ± 0.07 | |
| 3–5 | 0.34 ± 0.06 | 0.41 ± 0.06 | 0.43 ± 0.06 | 0.45 ± 0.06 | |
| 4–7 | 0.35 ± 0.06 | 0.41 ± 0.05 | 0.43 ± 0.06 | 0.45 ± 0.06 | |
| 5–8 | 0.35 ± 0.05 | 0.41 ± 0.05 | 0.44 ± 0.05 | 0.45 ± 0.06 | |
| 6–8 | 0.34 ± 0.05 | 0.40 ± 0.05 | 0.43 ± 0.06 | 0.45 ± 0.06 | |
| 3% amplitude | 1–4 | 0.36 ± 0.07 | 0.43 ± 0.07 | 0.46 ± 0.07 | 0.48 ± 0.07 |
| 2–5 | 0.36 ± 0.07 | 0.43 ± 0.06 | 0.46 ± 0.07 | 0.47 ± 0.07 | |
| 3–6 | 0.36 ± 0.06 | 0.43 ± 0.06 | 0.46 ± 0.06 | 0.48 ± 0.07 | |
| 4–7 | 0.36 ± 0.06 | 0.43 ± 0.06 | 0.46 ± 0.06 | 0.47 ± 0.06 | |
| 5–8 | 0.36 ± 0.06 | 0.43 ± 0.06 | 0.46 ± 0.06 | 0.48 ± 0.06 | |
| 6–9 | 0.35 ± 0.06 | 0.42 ± 0.06 | 0.45 ± 0.06 | 0.47 ± 0.06 | |
| 4% amplitude | 1–5 | 0.37 ± 0.07 | 0.45 ± 0.07 | 0.48 ± 0.07 | 0.50 ± 0.08 |
| 2–6 | 0.37 ± 0.06 | 0.44 ± 0.06 | 0.48 ± 0.07 | 0.50 ± 0.07 | |
| 3–7 | 0.37 ± 0.06 | 0.44 ± 0.06 | 0.47 ± 0.07 | 0.49 ± 0.07 | |
| 4–8 | 0.37 ± 0.06 | 0.44 ± 0.06 | 0.47 ± 0.06 | 0.49 ± 0.07 | |
| 5–9 | 0.36 ± 0.07 | 0.44 ± 0.07 | 0.47 ± 0.07 | 0.49 ± 0.07 | |
| 6–10 | 0.36 ± 0.07 | 0.43 ± 0.07 | 0.46 ± 0.07 | 0.48 ± 0.07 | |
4. DISCUSSION
We have characterized the viscoelastic properties of human cervix tissue for a range of compression amplitudes and testing frequencies. Qualitatively, one can see an increase in the slope of the ellipse (i.e. stiffness) in the 6–8% compression range data compared to the 1–3% range. Figure 3 demonstrates the inherent variability of soft tissue, as has been previously reported.22 Cervix samples were obtained from women over a wide age range with different pregnancy histories (Table 1). This may have contributed to differences in the mechanical properties among the samples; however, due to the poor correlation between mechanical properties and menopausal state in this study and limited number of specimens available, we did not create smaller, more homogenous subsets. Our E’ results were similar to the incremental modulus of stress-strain curves for ramp testing cervical samples from nonpregnant women when comparing similar compression ranges.16 Tan δ values were comparable to Kiss et al but our modulus values were much lower.17 They reported complex modulus values of approximately 40 kPa testing at 1 Hz from 2–4% compression. We reported E’ as opposed to the complex modulus, which is inherently lower. Initial precompression may have also been a factor. Establishing contact can be very subjective. Differences in the initial contact load (i.e., precompression) may explain differences in the results.
To investigate the effects of precompression for each sample relative to minimal precompression, we normalized E’ and tan δ for each patient to E’ and tan δ at 1% precompression, respectively (Fig. 4). These results showed that E’ increased significantly for precompressions of 4% or greater. At 6% precompression, E’ was approximately 1.4 times E’ at 1% precompression. These results stress the importance of considering precompression during mechanical characterization. There has been increasing interest in determining cervical function by studying the cervix as a biomechanical structure. The ‘TYVU’ effacement pattern revealed via sonography23 has also been shown by modeling the cervix as a mechanical structure.24 Aspiration techniques have demonstrated the potential to quantify cervical stiffness changes throughout gestation25 and ultrasound-based mechanical characterization methods such as elastography and shear-wave imaging may hold promise.14
We saw no significant differences in E’ or tan δ among amplitude ranges for raw or normalized data (Figs. 3, 4). Because of this, we chose to present the effects of frequency on the viscoelastic properties using just the 2% amplitude data for clarity. We saw significant increases in tan δ and E’ with increasing frequency for each compression range (Fig. 5) as previously reported.17 However, there were no significant differences among frequencies at each precompression level when normalized to a 1% precompression, indicating that increases in E’ caused by frequency or by precompression were independent (Fig. 6). Two percent amplitude data plotted versus frequency showed trends of monotonically increasing E’ and tan δ, similar to prior results for the same frequency range. Kiss et al showed a local minimum in tan δ below 1 Hz, frequencies which we did not test. However, the main purpose of our investigation was to evaluate the effects of precompression. Because of the increased time required to mechanically test our sample at more precompression levels, we had to sacrifice some testing frequencies to prevent tissue desiccation. To further investigate the effects of frequency, we normalized the data to the 1 Hz data for each. All data were significant (p < 0.001), confirming the importance of testing frequency on the outcome of mechanical tests.
We quantified the compression-dependent viscoelastic properties of human cervix tissue by compression testing samples with the end of the cervix contacting the displacement platen. In this study, we did not test other fiber orientations. However, compression caused by either an aspiration device or an ultrasound transducer would likely be in the direction we tested, making this testing orientation the most relevant for these diagnostic tests. It may be interesting to test different orientations in future studies.
The consequences of initial precompression on testing results are situation dependent. It is particularly relevant for diagnostic techniques that may be used to diagnose cervical insufficiency by quantifying a global value for cervical stiffness, such as the aspiration device or 1-D transient elastography. Based on our results, precompression can lead to stiffening that may result in a missed diagnosis of premature cervical softening. However, in the case of detection of cervical cancers, increased compression may actually be beneficial. Contrast between the elastic modulus of malignant tissue and surrounding background tissue has been shown to increase in the human liver with increasing compression as a result of strain hardening.26 This phenomenon could provide better boundary delineation on strain images. Unfortunately, we were unable to acquire cervical cancers through the duration of this study because of limited amounts of pathological tissue released for our study. Differences in mechanical properties between pre- and postmenopausal state should also be investigated. In the duration of this study, this was not possible because of the relative infrequency of premenopausal hysterectomies. Future work will focus on determining potential differences in cervical mechanics based on menopausal state. Cervical pathologies will also be tested in order to determine the strain- and frequency-dependent hardening effects when compared to normal cervical tissue.
ACKNOWLEDGEMENTS
The authors gratefully acknowledge the funding support of National Institutes of Health grant R21-CA140939-01 for this project. The authors would also like to thank Dr. Maritza A. Hobson, Ph.D for her consultation on this project.
REFERENCES
- 1.Fung YC. Biomechanics: Mechanical Properties of Living Tissues. New York: Springer; 1993. [Google Scholar]
- 2.Sherlock S, Dooley J. Diseases of the Liver and Biliary System. Malden: Blackwell Science; 2002. [Google Scholar]
- 3.Zoli M, Magalotti D, Grimaldi M, et al. Physical examination of the liver: is it still worth it? Am J Gastroenterol. 1995;90:1428–1432. [PubMed] [Google Scholar]
- 4.Krouskop TA, Wheeler TM, Kallel F, Garra BS, Hall T. Elastic moduli of breast and prostate tissues under compression. Ultrasonic Imaging. 1998;20:260–274. doi: 10.1177/016173469802000403. [DOI] [PubMed] [Google Scholar]
- 5.Bishop EH. Pelvic scoring for elective induction. Obstet Gynecol. 1964;24:266–268. [PubMed] [Google Scholar]
- 6.Rapaccini GL, Pompili M, Caturelli E, et al. Hepatocellular carcinomas <2 cm in diameter complicating cirrhosis: ultrasound and clinical features in 153 consecutive patients. Liver Int. 2004;24:124–130. doi: 10.1111/j.1478-3231.2004.0903.x. [DOI] [PubMed] [Google Scholar]
- 7.Scheipers U, Ermert H, Sommerfeld HJ, et al. Ultrasonic multifeature tissue characterization for prostate diagnostics. Ultrasound Med Biol. 2003;29:1137–1149. doi: 10.1016/s0301-5629(03)00062-0. [DOI] [PubMed] [Google Scholar]
- 8.Sandrin L, Fourquet B, Hasquenoph JM, et al. Transient elastography: a new noninvasive method for assessment of hepatic fibrosis. Ultrasound Med Biol. 2003;29:1705–1713. doi: 10.1016/j.ultrasmedbio.2003.07.001. [DOI] [PubMed] [Google Scholar]
- 9.Nightingale K, McAleavey S, Trahey G. Shear-wave generation using acoustic radiation force: in vivo and ex vivo results. Ultrasound Med Biol. 2003;29:1715–1723. doi: 10.1016/j.ultrasmedbio.2003.08.008. [DOI] [PubMed] [Google Scholar]
- 10.Palmeri ML, Wang MH, Dahl JJ, Frinkley KD, Nightingale KR. Quantifying hepatic shear modulus in vivo using acoustic radiation force. Ultrasound Med Biol. 2008;34:546–558. doi: 10.1016/j.ultrasmedbio.2007.10.009. [DOI] [PMC free article] [PubMed] [Google Scholar]
- 11.Ophir J, Cespedes I, Ponnekanti H, Yazdi Y, Li X. Elastography: a quantitative method for imaging the elasticity of biological tissues. Ultrasonic Imaging. 1991;13:111–134. doi: 10.1177/016173469101300201. [DOI] [PubMed] [Google Scholar]
- 12.Hobson MA, Kiss MZ, Varghese T, et al. In vitro uterine strain imaging: preliminary results. J Ultrasound Med. 2007;26:899–908. doi: 10.7863/jum.2007.26.7.899. [DOI] [PMC free article] [PubMed] [Google Scholar]
- 13.Thomas A, Kummel S, Gemeinhardt O, Fischer T. Real-time sonoelastography of the cervix: tissue elasticity of the normal and abnormal cervix. Acad Radiol. 2007;14:193–200. doi: 10.1016/j.acra.2006.11.010. [DOI] [PubMed] [Google Scholar]
- 14.Thomas A. Imaging of the cervix using sonoelastography. Ultrasound Obstet Gynecol. 2006;28:356–357. doi: 10.1002/uog.3813. [DOI] [PubMed] [Google Scholar]
- 15.Bauer M, Mazza E, Nava A, et al. In vivo characterization of the mechanics of human uterine cervices. Ann NY Acad Sci. 2007;1101:186–202. doi: 10.1196/annals.1389.004. [DOI] [PubMed] [Google Scholar]
- 16.Myers KM, Paskaleva AP, House M, Socrate S. Mechanical and biochemical properties of human cervical tissue. Acta Biomater. 2008;4:104–116. doi: 10.1016/j.actbio.2007.04.009. [DOI] [PubMed] [Google Scholar]
- 17.Kiss MZ, Hobson MA, Varghese T, et al. Frequency-dependent complex modulus of the uterus: preliminary results. Phys Med Biol. 2006;51:3683–3695. doi: 10.1088/0031-9155/51/15/006. [DOI] [PMC free article] [PubMed] [Google Scholar]
- 18.Lakes R. Viscoelastic Solids. Boca Raton: CRC Press; 1999. [Google Scholar]
- 19.Christensen RM. Theory of Viscoelasticity: An Introduction. New York: Academic Press Inc.; 1982. [Google Scholar]
- 20.Weiss S, Jaermann T, Schmid P, et al. Three-dimensional fiber architecture of the nonpregnant human uterus determined ex vivo using magnetic resonance diffusion tensor imaging. Anat Rec A Discov Mol Cell Evol Biol. 2006;288:84–90. doi: 10.1002/ar.a.20274. [DOI] [PubMed] [Google Scholar]
- 21.Kiss MZ, Hobson MA, Varghese T, et al. Frequency-dependent complex modulus of the uterus: preliminary results. Phys Med Biol. 2006;51:3683–3695. doi: 10.1088/0031-9155/51/15/006. [DOI] [PMC free article] [PubMed] [Google Scholar]
- 22.Snedeker JG, Niederer P, Schmidlin FR, et al. Strain-rate dependent material properties of the porcine and human kidney capsule. J Biomech. 2005;38:1011–1021. doi: 10.1016/j.jbiomech.2004.05.036. [DOI] [PubMed] [Google Scholar]
- 23.Zilianti M, Azuaga A, Calderon F, Pages G, Mendoza G. Monitoring the effacement of the uterine cervix by transperineal sonography: a new perspective. J Ultrasound Med. 1995;14:719–724. doi: 10.7863/jum.1995.14.10.719. [DOI] [PubMed] [Google Scholar]
- 24.House M, Paskaleva A, Myers K, et al. The biomechanics of cervical funneling: The effect of stroma properties, anatomic geometry and pelvic forces on funnel formation. Am J Obstet Gynecol. 2004;191:S17–S17. [Google Scholar]
- 25.Bauer M, Mazza E, Jabareen M, et al. Assessment of the in vivo biomechanical properties of the human uterine cervix in pregnancy using the aspiration test: a feasibility study. Eur J Obstet Gynecol Reprod Biol. 2009;144 Suppl 1:S77–S81. doi: 10.1016/j.ejogrb.2009.02.025. [DOI] [PubMed] [Google Scholar]
- 26.Yeh WC, Li PC, Jeng YM, et al. Elastic modulus measurements of human liver and correlation with pathology. Ultrasound Med Biol. 2002;28:467–474. doi: 10.1016/s0301-5629(02)00489-1. [DOI] [PubMed] [Google Scholar]


