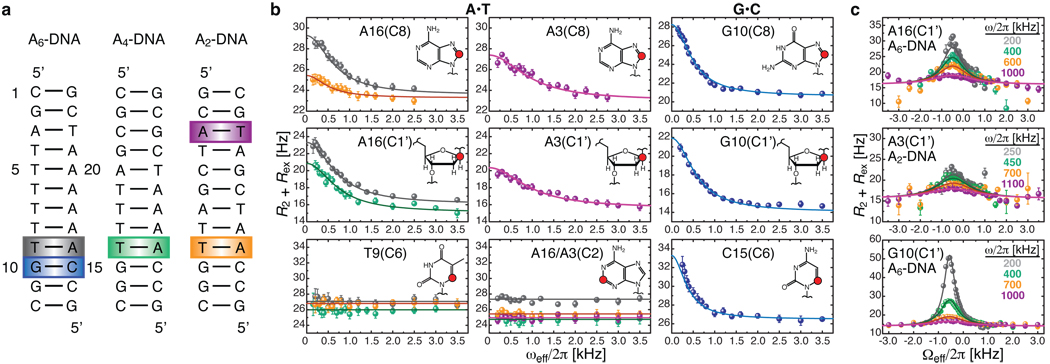
Figure 1. Detection of base-pair specific excited states in CA/TG steps of duplex DNA.
a, DNA constructs containing varying length A-tracts with color-coded A•T and G•C base-pairs at CA/TG steps that show carbon chemical exchange. b, On-resonance 13C R1ρ relaxation dispersion profiles for A•T (26.0 °C) and G•C (30.5 °C) showing CA/TG specific chemical exchange at purine base C8 and sugar C1’ and at cytosine base C6. Shown are the best base-pair global fits (solid line) to a two-state asymmetric exchange model (Supplementary Eq.1). c, Representative off-resonance relaxation dispersion profiles for corresponding C1’ sites and best global fits as in b. All error bars represent experimental uncertainty (one s.d.) estimated from mono-exponential fitting of duplicate sets of R1ρ data.

