

Abstract
A visual discrimination apparatus was developed to evaluate the visual sensitivity of normal pigmented rats (n=13) and S334ter-line-3 retinal degenerate (RD) rats (n=15). The apparatus is a modified Y maze consisting of two chambers leading to the rats' home cage. Rats were trained to find a one-way exit door leading into their home cage, based on distinguishing between two different visual alternatives (either a dark background or black and white stripes at varying luminance levels) which were randomly displayed on the back of each chamber. Within two weeks of training, all rats were able to distinguish between these two visual patterns. The discrimination threshold of normal pigmented rats was a luminance level of -5.37 ± 0.05 log cd/m2; whereas the threshold level of 100 day old RD rats was -1.14± 0.09 log cd/m2 with considerable variability in performance. When tested at a later age (about 150 days), the threshold level of RD rats was significantly increased (-0.82±0.09 log cd/m2, p<0.03, paired t-test). This apparatus could be useful to train rats at a very early age to distinguish between two different visual stimuli and may be effective for visual functional evaluations following therapeutic interventions.
Keywords: visual discrimination, visual threshold, pattern detection, retinal degeneration
Introduction
Animal models of retinal degeneration show progressive loss of visual function. These animal models, primarily rodents, have been tested with various types of therapeutic interventions aimed at preventing loss of visual sensitivity and or restoring the lost vision. Visual functional changes following therapeutic interventions may be monitored by behavioral and/or electrophysiological means (Woch et al., 2001; Lund et al., 2001a; Sagdullaev et al., 2003; Thomas et al., 2004b; Thomas et al., 2006).
A wide variety of visual behavioral tests have been employed in rodents. These include startle reflex tests (del Cerro et al., 1995), orientation tests (Hetherington et al., 2000), maze tests (Little et al., 1998; Kwan et al., 1999; Prusky et al., 2000; Coffey et al., 2002), and optokinetic tests (Thaung et al., 2002; Thomas et al., 2004c; Douglas et al., 2005; Schmucker et al., 2005). These various tests differ based not only on the apparatus design, but also in the aspect of visual function that is tested, and the requirement for animal training. As an example, the optokinetic instrument used to assess the visual acuity of rats and mice is based on the animal's ability to track a moving stimulus (i.e. motion detection). The optokinetic test was originally designed by Cowey (Cowey and Franzini, 1979) and was later modified by other investigators to improve its functional efficacy (Coffey et al., 2002; Thaung et al., 2002; Thomas et al., 2004c; Douglas et al., 2005; Schmucker et al., 2005). The optokinetic test, however, does not require training as the visual response is based on an autonomous reflex.
In certain other types of visual behavioral tests, animals must be initially trained to choose the correct visual stimuli via a positive reinforcement. One such device, described by Prusky and coworkers (Prusky et al., 2000), consists of a water maze. This device is based on the principle that mice and rats are instinctive swimmers and can be trained to escape onto a submerged platform based on a specific visual cue. Other types of visual behavioral testing devices that have been reported include modified forms of a ‘Y’ maze, where food and or water are used as rewards to train the animals (Muntz, 1967; Seymoure and Juraska, 1997; Gianfranceschi et al., 1999). A ‘Y’ maze consists of a starting chamber from which extend two paths (i.e. the arms of the ‘Y’) between which the animal must choose.
Our laboratory has utilized behavioral tests to assess the visual function in rats following therapeutic interventions such as retinal transplantation (Thomas et al., 2004c). Previously, we reported on the use of a modified optokinetic test to permit unilateral visual testing following transplantation, and correlated the visual behavioral results with brainstem (superior colliculus) electrophysiology (Thomas et al., 2004a). A good correlation was observed with bright-light stimulation (photopic). However, testing under scotopic conditions was difficult to perform with the optokinetic device because the amount of light required to monitor the optokinetic behavior of the rat exceeded the scotopic threshold. Scotopic testing and determination of the light intensity threshold, however, is very useful in transplant studies because a large part of the transplanted cells develop to rod photoreceptors that are especially sensitive to low light (Thomas et al., 2006). To address this limitation and to assess other aspects of visual function in rats, this report describes a new apparatus which may permit rapid and efficient assessment of vision in normal and retinal degenerate rats.
Material and Methods
Experimental animals
Animals were maintained in accordance with the NIH statement for the use of animals in research, and the research was approved by the Animal Care and Use Committee of the University of Southern California. Pigmented S334ter-line-3 transgenic rats (n=15) expressing a mutated human rhodopsin protein were evaluated in this study. The rats were produced by Xenogen Biosciences (formerly Chrysalis DNX Transgenic Sciences, Princeton, NJ), and developed and supplied with the support of the National Eye Institute by Dr. Matthew LaVail, University of California San Francisco (http://www.ucsfeye.net/mlavailRDratmodels.shtml). The F1 generation of a cross between homozygous line 3 and pigmented Copenhagen rats (Harlan, Indianapolis, IN) was used for the experiments. The time course of photoreceptor degeneration in these rats has been previously reported (Liu et al., 1999; Sagdullaev et al., 2003). At P18, 3 to 6 layers of photoreceptors are present in the retina, and declines to 1 to 2 layers by P28, with additional progressive loss of photoreceptors with increasing age. Normal pigmented rats (ACI strain, n=13) served as the controls, and rats of both sexes were used.
Visual discrimination apparatus
The apparatus (Fig.1A,B) is a modified ‘Y’ maze made of opaque plexiglass. It consists of a ‘starting chamber’ (20×20 cm, Fig.1B.2) that leads to two parallel ‘escape alleys’ (38 cm long, Fig.1B.3) which are identical and separated by a median plexiglass wall. Rats are introduced into the starting chamber through a bent plexiglass tube (Fig.1B.1). From the starting chamber, rats can enter into the ‘escape alleys’ through the first set of one-way transparent swing doors (entrance doors), and the alley chosen by the rats is indicated by an LED bulb placed outside the apparatus. At the far end, each ‘escape alley’ faces a clear plexiglass wall with an LCD computer screen (17 inch) behind (Figs.1B,4,5). At the distal corner of the alley, close to the median wall, a second set of small one-way swing doors (exit doors) are present that open into the “home cage”. Standard rat cages, modified to attach to the testing apparatus, were used as the home cage. All swing doors (entrance and exit) are made of clear plexiglass containing multiple holes which allow olfactory cues to pass across the chambers and from the home cage. All swing doors open only in the direction of the home cage. The exit swing doors into the home cage can be locked from outside using a lever.
Fig. 1.
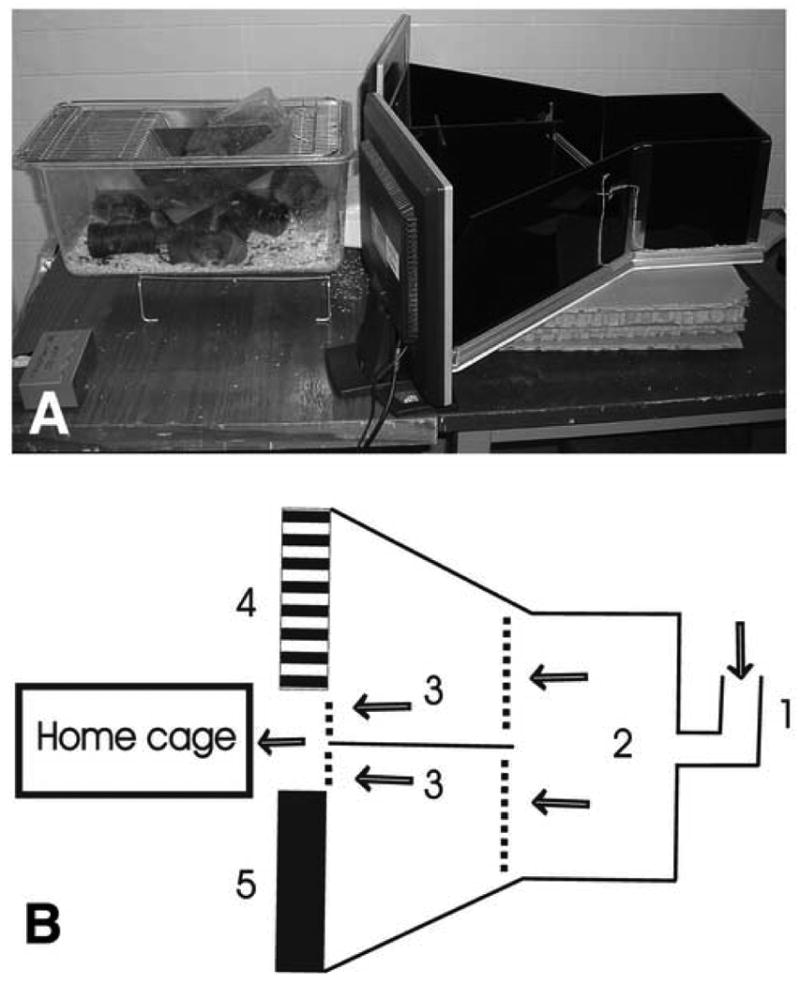
(A) Photograph from the side of the visual discrimination apparatus showing the chambers, computer monitors and the home cage. (B) Visual discrimination apparatus-schematic drawing. Rats are introduced through a bend tube (1) that leads to the introduction chamber (2) from where the rats can move into one of the two escape alleys (3) by passing the transparent swing doors (dotted lines). At the far end of the escape alleys, a second set of swing doors are present which open into the home cage. The rats are trained to find the unlocked exit door based on the ‘positive’ visual stimulus displayed on one of the computer monitors (4), whereas a ‘negative’ visual cue is displayed on the other side (5). The rats' pathway leading to the home cage is indicated by arrowheads.
Visual Stimuli
For the purpose of this study, we chose only two stimuli for testing the animals. For the ‘positive’ visual stimulus we chose a static alternating black and white stripe pattern, with a stripe width of 1cm. The monitor in the off position (‘black’ screen) was used as the ‘negative’ visual stimulus. To prevent the leakage of stray light from the positive visual stimulus, the monitors were placed close to the plexiglass wall and the edges of the computer screens were sealed using black insulation tape. In addition, the procedure room was properly sealed to block stray light from outside. The point of entry of the rats into the escape alleys was considered as the viewing distance at which the rats make their decision. The stimulus monitor was placed 30cm away from this point, at the far end of the corresponding escape ally. The luminance inside the apparatus was measured from this point using a 371 R Optical Power Meter (Graseby Optronics, Orlando, FL).
Training phase
To get accustomed to the testing arena, the rat pups (P18) were released into the ‘starting chamber’ and trained to find their way back into the home cage. During this ‘pre-training’ session, the swing doors remained open and computer screens displayed only the ‘positive’ visual cue. Although the ‘positive’ or ‘negative’ stimulus could be associated with a locked or unlocked exit door, for this study, the ‘positive’ stimulus (black and white stripes with a luminance level 0.00 log cd/m2 or 1.00 cd/m2) was always associated with an unlocked exit door, and the negative stimulus (black computer screen with luminance in the infinity level) was always associated with a locked exit door.
Rats were then trained to choose the correct escape alley (leading to the home cage) based on association with the ‘positive’ visual stimulus displayed on the computer monitor. The rats that made mistakes (rat choosing the wrong path and trapped in the escape alley), were picked up by the tail and temporarily housed in an isolation cage. Approximately 5 minutes later, the same rat was introduced again and the process was repeated until they learned to choose the correct ‘escape alley’. Before each rat was introduced (or reintroduced after a mistake), the ‘positive’ and ‘negative’ visual cues were interchanged between the two sides and the floor of the chamber was cleaned with 70% ethanol.
To streamline the ultimate determination of the visual threshold for each individual animal and to speed up the testing process, the approximate visual threshold for the entire cohort of rats was assessed first. For this study, each rat cohort or group consisted of 7-13 rats. Each contained rats of the same age and type, usually littermates. Rats were placed in the apparatus one at a time (randomly varying the stimulus/exit) and allowed to make their choice as described above. Once the cohort of rats had each completed one test run, the % of rats in the cohort making the correct choice was calculated. The testing was repeated starting with the first rat in the group. This group training and testing of the rats continued until the group reached a 70% success level. Based on previous literature (Prusky et al., 2000; Prusky et al., 2002), a 70%+ success level was considered as the passing criteria for ascertaining the preliminary threshold value for the group and an 80%+ success level was considered as the passing criteria for determining a more precise threshold value for individual animals.
Testing phase (Measuring the visual light sensitivity threshold level for individual rats)
Because the light sensitivity threshold was measured under scotopic conditions, the rats were dark adapted overnight and experiments were conducted in a dark room with the aid of a dim red light. To evaluate the behavioral light threshold level, the luminance level of the white stripes was reduced by steps of 0.5 log cd/m2 until the performance of the group dropped below the passing level of 70% success. If a group failed to reach the 70% passing level at a particular luminance level, the rats were tested once again at the same luminance level and if they continued to fail, the visual performance of the individual rats was evaluated at the previous higher luminance level. Thus a preliminary threshold level for the group was determined.
For determining the threshold level of individual rats, each rat was tested 10 times consecutively and an 80% success level was considered as the passing level (at least 8 correct choices during 10 consecutive tests). If a rat failed, it was tested at the next higher luminance level and the process was repeated until the threshold level of all the rats in the group was determined. The threshold luminance level of normal pigmented rats was evaluated at about 100 days of age, and in RD rats, the evaluations were performed at about 100 days and 150 days of age.
Results
Using the visual discrimination apparatus (Fig. 1A,B), rats can be trained to distinguish between two different visual patterns for which the home cage can be used as an effective positive reinforcement. The training can be commenced before the rat pups are weaned, beginning from postnatal day 18. The initial training using the rat pups is accomplished by keeping their parents in their home cage which provided additional reinforcement.
Introduction of the rats into the starting chamber through a bent tube ensures that the release of the animals into the testing arena is unbiased. From the starting chamber, the rats are able to see the LCD screens (visual stimulus) placed at the distal ends of the escape alleys. Rats can be easily trained to use the alleys as an escape route to reach their home cage.
During the training session, the position of the positive stimulus was changed before each rat was introduced. This helped to avoid the possible influence of habituation (example a rat simply choosing the same direction as the previous successful attempt) and olfactory (example rat may use the scent along the path to find the same path chosen on the last attempt) cues, and to reinforce the importance of the visual stimulus.
After training, the rats learned to readily push open the transparent swing doors to reach their home cage, based on the positive visual stimulus displayed on the computer monitor. The apparatus was designed in such a way that the animal was forced to make a single irreversible choice in each test. The time taken by the rats to choose an escape alley was less than one minute, making it possible to test/train several rats in a day.
The visual discrimination apparatus allowed visual behavioral testing under scotopic conditions. When both computer monitor's were set to the off position, the luminance inside the apparatus remained well below -5.00 log cd/m2. No apparent increase in the luminance level was noticed in the ‘negative’ chamber, even when the ‘positive stimulus’ was displayed on the other side. The luminance level of the visual stimulus could be modulated to permit assessment of the animals' visual sensitivity thresholds.
Generally, the rats attained the 70%+ passing success level within two weeks of training (Fig. 2). After about18 trials (at the rate of three trials on each alternative day), both normal pigmented rats and RD rats were able to distinguish between a dark background versus a pattern with white stripes (the luminance of the white stripes was 0.00 log cdm2). At the end of the training phase, control non-degenerate rats (10/13) as well as the line3 RD rats (13/15) were able to reach the 70% passing level. When the stimulus intensity was lowered, the line-3 RD rats failed to maintain their visual performance, whereas, the normal control rats continued to maintain the passing level (>70% success) until a very low visual sensitivity threshold level was reached. The normal pigmented rats (age 101-115 days) were able to distinguish between the two visual patterns up to a luminance level (white stripes) of -5.37 ± 0.05 log cd/m2 (Fig.2). At about 100 days (range 98-105), RD rats were able to distinguish between the above visual patterns only at a considerably higher luminance level (-1.14± 0.09 log cd/m2). When tested at a later age (range 146-153 days), the threshold luminance level in RD rats was found to be significantly increased (-0.82±0.09 log cd/m2, p<0.03, paired t-test, Fig.3). In the case of RD rats, a higher individual variability existed in their visual sensitivity level. At about 100 days of age, the line-3 transgenic rats were divided into three different groups based on their visual performance (Fig. 4A). When tested at a later age (approximately 150 days), the line-3 rats were divided into four groups based on their light sensitivity threshold (Fig. 4B). The normal pigmented rats (age 101-115 days) on the other hand showed better consistency in their visual performance with majority of them (92%) belonging to the same light sensitivity group (Fig.4C).
Fig. 2.
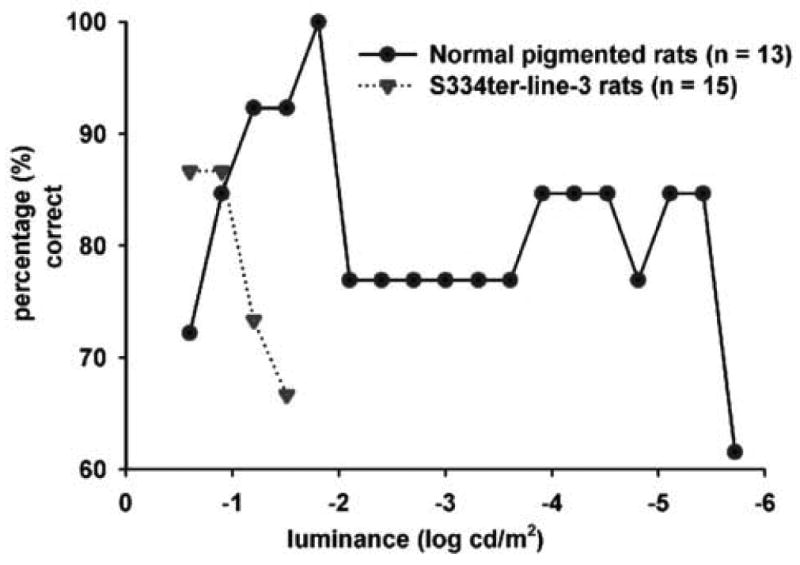
Line graph demonstrating the behavioral light sensitivity of normal pigmented rats and S334ter-line-3 retinal degenerate rats. Visual behavior of rat cohort was evaluated using the visual discrimination apparatus. Once the cohort of rats had completed one test run, the % of rats in the cohort making the correct choice was calculated. Each data point represents the percentage of success level at the corresponding stimulus intensity (log cd/m2). Initially, when a higher luminance level was used for visual stimulation, both normal pigmented rats and RD rats maintained a 70% + passing level with the line-3 RD rats demonstrating an apparently higher success rate. When the luminance level was gradually reduced (-1.51 log cd/m2), the line-3 RD rats failed to maintain the passing level. On the other hand, the normal pigmented rats continued to maintain their good visual performance until they reached the threshold luminance level of -5.42 log cd/m2.
Fig. 3.
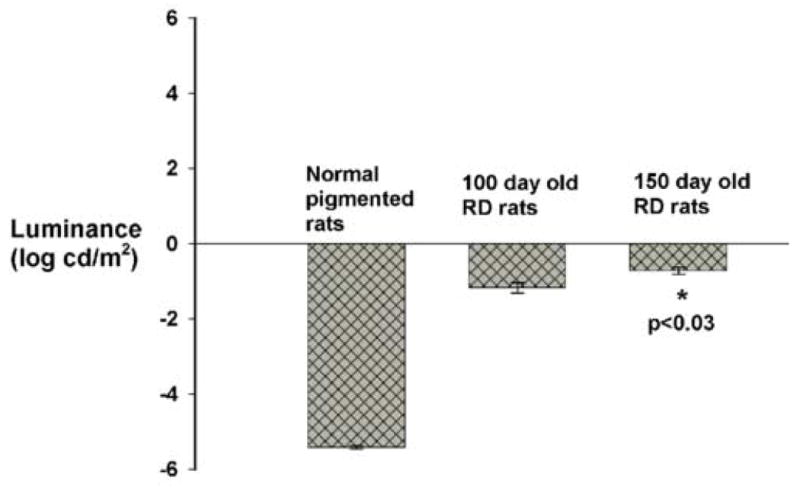
Visual sensitivity threshold levels in normal (non-degenerate) control rats and retinal degenerate line-3 rats tested at about 100 days and 150 days of age. Each bar represents the threshold luminance level (mean±SE). In S334ter-line-3 RD rats, at the age of about 100 days, the visual sensitivity threshold was considerably higher compared to the normal pigmented rats (age 101-115 days). The line-3 RD rats when tested at a later age (about 150 days), showed significant loss in their visual sensitivity.
Fig. 4.
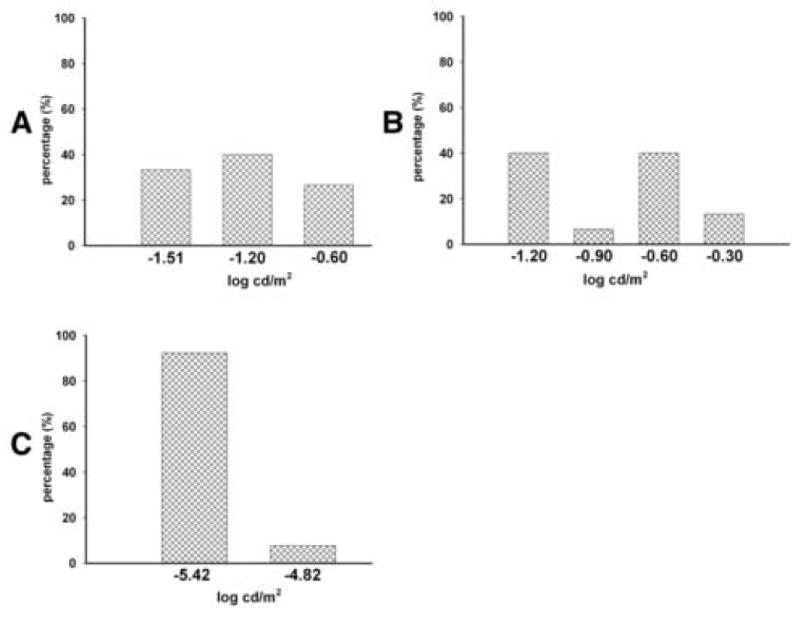
Bar diagram demonstrating higher individual variation in visual sensitivity among S334ter-line-3 rats. The visual sensitivity threshold was measured using the visual discrimination apparatus and rats were divided into various groups based on their visual performance. Each bar represents the percentage of rats belonging to a specific level of visual sensitivity. (A) At about 100 days of age, the line-3 transgenic rats were divided into three different groups based on their visual performance. (B) When tested at a later age (approximately 150 days), the line-3 rats were divided into four groups based on their light sensitivity threshold. (C) The normal pigmented rats (age 101-115 days) on the other hand showed better consistency in their visual performance with majority of them (92%) belonging to the same light sensitivity group.
Discussion
This study describes the application of a visual discrimination apparatus for measuring visual sensitivity in rats. This apparatus can be used to effectively train rats to distinguish between specific visual stimuli. The performance of the rats in this study suggests that the presence of the ‘home cage’ alone is a sufficient positive reinforcement to motivate rats to choose the correct path (as indicated by the positive visual stimulus). Rats separated from their home cage (and separated from their cage mates) appear to show a great preference to return to their home cage. Once the rats reached the ‘starting chamber’, they could sense the presence of their home cage (and cage mates). The most influential factors guiding this ‘instinctive’ behavior include acoustic, olfactory and or visual cues.
Most of the previously described visual behavioral tests (Muntz, 1967; Seymoure and Juraska, 1997; Gianfranceschi et al., 1999; Prusky et al., 2000) require extensive training of the rats which usually can only be started after the pups are weaned. An example of such a test is the water maze (Prusky et al., 2000), which like the pattern discrimination apparatus described in this report, is also a modified form of a ‘Y’ maze. However, in the water maze, the device is filled with water, and rats are trained to swim across the water body to find a hidden platform. Several days of training may be required before the visual performance of the rats can be assessed with this test, and training can only begin after the weaning period. Another potential concern regarding the water maze is that rats are subjected to excessive wet conditions. Regardless, these training requirements would delay the earliest age at which the actual functional evaluation of the animals could be performed. It is important to note that with the apparatus described in this report, training was initiated before the pups were weaned. This was likely possible because the rat pups showed a strong preference of their home cage due to the presence of their parents. Thus, this visual discrimination apparatus permits the evaluation of the visual function in rats at an earlier age.
Visual behavioral testing based on optokinetic head tracking (Cowey and Franzini, 1979; Coffey et al., 2002; Thaung et al., 2002; Thomas et al., 2004c; Douglas et al., 2005) have an important advantage in that no training is required prior to the testing. However, these instruments are primarily designed to measure a form of grating visual acuity, and may not be as well-suited for measuring other aspects of visual behavior such as light sensitivity threshold, color discrimination, and pattern detection. Furthermore, the optokinetic reflex is a response driven by subcortical pathways and has been suggested to be a less accurate measure of visual function compared to certain other testing procedures (Douglas et al., 2005). Also, the optokinetic method does not work well in albino animals because of their abnormal visual sensory system (Precht and Cazin, 1979). On the other hand, the visual discrimination apparatus may be used to evaluate various aspects of visual behavior including visual acuity, light sensitivity threshold, and pattern detection all by simply changing the visual pattern displayed on the computer screen.
Another advantage of the visual discrimination apparatus is that it permits visual behavioral testing to be performed under scotopic conditions. In our experiments, the luminance level in the testing arena could be maintained well below the scotopic level. Such a scotopic environment may be required for measuring the dark adapted (rod-mediated) behavioral light sensitivity threshold in rats.
The computer screens positioned at the end of the escape alleys permit any visual patterns to be presented to the rats, potentially allowing for a variety of different visual functional tests. For example, a static pattern (stripes) could be shown on one screen and a moving pattern could be shown on the other screen in order to determine whether the animal can detect motion. Alternatively, vertical stripes could be presented on one screen and horizontal stripes could be presented on the other to assess whether the animal can perceive line orientation.
The present investigation also demonstrates that the visual capability of normal and retinal degenerate rats can be assessed using the visual discrimination apparatus. After 2 weeks of training, both normal pigmented rats and S334 ter-line-3 RD rats were able to distinguish between a striped pattern (photic) versus a uniformly dark alternative. At the end of the training phase, the line-3 rats were comparatively better in their visual performance compared to the normal controls (Fig.2, left end of graph), suggesting positive adaptations taking place in the cognitive system consequent to visual sensitivity loss.
Using this apparatus, it was also possible to measure the light sensitivity threshold in the rats. The threshold luminance level of normal pigmented rats was found to be -5.37 ± 0.05 log cd/m2, an even lower threshold level than that obtained by direct electrophysiological recording from the visual center (SC) of the brain (-5.25 log cd/m2) (Thomas et al., 2005). However, it should be noted that the SC visual responses were measured during full-field light stimulation, whereas black and white stripes were used for behavioral visual stimulation in the visual discrimination apparatus. The luminance level of the individual white stripes used for visual stimulation may be much higher than the threshold luminance level reported here, which presumably includes the sum of both the black and white stripes.
The present investigation also demonstrates that in S334ter-line-3 retinal degenerate rats, a considerable loss of visual sensitivity is observable at about 100 days of age and a measurable progressive loss of vision occurs over the next 2 months (at about 150 days of age). This pattern of visual sensitivity loss is reported to occur in RD rats concomitant with the loss of retinal photoreceptors (Liu et al., 1999; Sagdullaev et al., 2003). The significant individual variation in the level of visual sensitivity observed among RD rats (even among litter mates) suggests that the rate of progression of the disease is variable, and is consistent with the previous reports in mouse RD models (LaVail et al., 1997). This finding must be considered when assessing the functional outcome of various therapeutic interventions performed in RD models.
In summary, the visual discrimination apparatus described in this report permits rapid and efficient functional evaluation of the visual sensitivity in both normal and retinal degenerate rats. The apparatus permits testing in scotopic conditions, and allows a variety of different aspects of visual function to be assessed. The device is easy to use and training and testing of the rats can be performed by laboratory personnel without special skills or expertise. Behavioral training can be commenced at an earlier age, and the time required for testing is relatively short. Finally, whereas the commercially available visual behavioral testing instruments are comparatively expensive, the visual discrimination apparatus can be constructed with a modest budget. Due to these reasons, the apparatus has become our preferred instrument for evaluating visual function in rats, and may be a useful tool to study visual functional changes during progressive retinal degenerations and the effect of therapeutic interventions.
Acknowledgments
Supported by: Foundation Fighting Blindness, Anonymous Sponsor, Foundation for Retinal Research, Fletcher Jones Foundation, NIH EY03040. Proprietary interest: none. The authors wish to thank Dr. Mathew M. Oommen Ph. D, Department of Zoology, University of Kerala, India, for his valuable comments on behavioral training and Dennis Evans, University of Louisville, for help with building the apparatus.
Footnotes
Publisher's Disclaimer: This is a PDF file of an unedited manuscript that has been accepted for publication. As a service to our customers we are providing this early version of the manuscript. The manuscript will undergo copyediting, typesetting, and review of the resulting proof before it is published in its final citable form. Please note that during the production process errors may be discovered which could affect the content, and all legal disclaimers that apply to the journal pertain.
References
- Coffey PJ, Girman S, Wang SM, Hetherington L, Keegan DJ, Adamson P, et al. Long-term preservation of cortically dependent visual function in RCS rats by transplantation. Nat Neurosci. 2002;5:53–6. doi: 10.1038/nn782. [DOI] [PubMed] [Google Scholar]
- Cowey A, Franzini C. The retinal origin of uncrossed optic nerve fibers in rats and their role in visual discrimination. Experimental Brain Research. 1979;35(3):443–56. doi: 10.1007/BF00236763. [DOI] [PubMed] [Google Scholar]
- del Cerro M, DiLoreto D, Jr, Cox C, Lazar ES, Grover DA, del Cerro C. Neither intraocular grafts of retinal cell homogenates nor live non-retinal neurons produce behavioral recovery in rats with light-damaged retinas. Cell Transplant. 1995;4:133–9. doi: 10.1177/096368979500400117. [DOI] [PubMed] [Google Scholar]
- Douglas RM, Alam NM, Silver BD, McGill TJ, Tschetter WW, Prusky GT. Independent visual threshold measurements in the two eyes of freely moving rats and mice using a virtual-reality optokinetic system. Vis Neurosci. 2005;22:677–84. doi: 10.1017/S0952523805225166. [DOI] [PubMed] [Google Scholar]
- Gianfranceschi L, Fiorentini A, Maffei L. Behavioural visual acuity of wild type and bcl2 transgenic mouse. Vision Res. 1999;39:569–74. doi: 10.1016/s0042-6989(98)00169-2. [DOI] [PubMed] [Google Scholar]
- Hetherington L, Benn M, Coffey PJ, Lund RD. Sensory capacity of the royal college of surgeons rat. Invest Ophthalmol Vis Sci. 2000;41:3979–83. [PubMed] [Google Scholar]
- Kwan AS, Wang S, Lund RD. Photoreceptor layer reconstruction in a rodent model of retinal degeneration. Exp Neurol. 1999;159:21–33. doi: 10.1006/exnr.1999.7157. [DOI] [PubMed] [Google Scholar]
- LaVail MM, Matthes MT, Yasumura D, Steinberg RH. Variability in rate of cone degeneration in the retinal degeneration (rd/rd) mouse. Exp Eye Res. 1997;65:45–50. doi: 10.1006/exer.1997.0308. [DOI] [PubMed] [Google Scholar]
- Little CW, Cox C, Wyatt J, del Cerro C, del Cerro M. Correlates of photoreceptor rescue by transplantation of human fetal RPE in the RCS rat. Exp Neurol. 1998;149:151–60. doi: 10.1006/exnr.1997.6642. [DOI] [PubMed] [Google Scholar]
- Liu C, Li Y, Peng M, Laties AM, Wen R. Activation of caspase-3 in the retina of transgenic rats with the rhodopsin mutation s334ter during photoreceptor degeneration. J Neurosci. 1999;19:4778–85. doi: 10.1523/JNEUROSCI.19-12-04778.1999. [DOI] [PMC free article] [PubMed] [Google Scholar]
- Lund RD, Kwan AS, Keegan DJ, Sauve Y, Coffey PJ, Lawrence JM. Cell transplantation as a treatment for retinal disease. Prog Retin Eye Res. 2001a;20:415–49. doi: 10.1016/s1350-9462(01)00003-9. [DOI] [PubMed] [Google Scholar]
- Muntz WR. A behavioural study on photopic and scotopic vision in the hooded rat. Vision Res. 1967;7:371–6. doi: 10.1016/0042-6989(67)90045-4. [DOI] [PubMed] [Google Scholar]
- Precht W, Cazin L. Functional deficits in the optokinetic system of albino rats. Experimental Brain Research. 1979;37(1):183–6. doi: 10.1007/BF01474264. [DOI] [PubMed] [Google Scholar]
- Prusky GT, Harker KT, Douglas RM, Whishaw IQ. Variation in visual acuity within pigmented, and between pigmented and albino rat strains. Behav Brain Res. 2002;136:339–48. doi: 10.1016/s0166-4328(02)00126-2. [DOI] [PubMed] [Google Scholar]
- Prusky GT, West PW, Douglas RM. Behavioral assessment of visual acuity in mice and rats. Vision Res. 2000;40:2201–9. doi: 10.1016/s0042-6989(00)00081-x. [DOI] [PubMed] [Google Scholar]
- Sagdullaev BT, Aramant RB, Seiler MJ, Woch G, McCall MA. Retinal transplantation-induced recovery of retinotectal visual function in a rodent model of retinitis pigmentosa. Invest Ophthalmol Vis Sci. 2003;44:1686–95. doi: 10.1167/iovs.02-0615. [DOI] [PubMed] [Google Scholar]
- Schmucker C, Seeliger M, Humphries P, Biel M, Schaeffel F. Grating acuity at different luminances in wild-type mice and in mice lacking rod or cone function. Invest Ophthalmol Vis Sci. 2005;46:398–407. doi: 10.1167/iovs.04-0959. [DOI] [PubMed] [Google Scholar]
- Seymoure P, Juraska JM. Vernier and grating acuity in adult hooded rats: the influence of sex. Behav Neurosci. 1997;111:792–800. doi: 10.1037//0735-7044.111.4.792. [DOI] [PubMed] [Google Scholar]
- Thaung C, Arnold K, Jackson IJ, Coffey PJ. Presence of visual head tracking differentiates normal sighted from retinal degenerate mice. Neurosci Lett. 2002;325:21–4. doi: 10.1016/s0304-3940(02)00223-9. [DOI] [PubMed] [Google Scholar]
- Thomas BB, Aramant RB, Qiu GT, Arai S, Chen Z, Sadda SR, et al. BDNF microsphere treatment increases functional effects of retinal transplants. ARVO abstract 5184/B508 2004a [Google Scholar]
- Thomas BB, Aramant RB, Sadda SR, Seiler MJ. Light response differences in the superior colliculus of albino and pigmented rats. Neurosci Lett. 2005;385:143–7. doi: 10.1016/j.neulet.2005.05.034. [DOI] [PubMed] [Google Scholar]
- Thomas BB, Aramant RB, Sadda SR, Seiler MJ. Retinal transplantation A treatment strategy for retinal degenerative diseases. In: Joe G, Hollyfield REA, LaVail Mathew M, editors. Retinal degenerative diseases. New York: USA: 2006. pp. 367–76. [PubMed] [Google Scholar]
- Thomas BB, Seiler MJ, Sadda SR, Aramant RB. Superior colliculus responses to light - preserved by transplantation in a slow degeneration rat model. Exp Eye Res. 2004b;79:29–39. doi: 10.1016/j.exer.2004.02.016. [DOI] [PubMed] [Google Scholar]
- Thomas BB, Seiler MJ, Sadda SR, Coffey PJ, Aramant RB. Optokinetic test to evaluate visual acuity of each eye independently. J Neurosci Methods. 2004c;138:7–13. doi: 10.1016/j.jneumeth.2004.03.007. [DOI] [PubMed] [Google Scholar]
- Woch G, Aramant RB, Seiler MJ, Sagdullaev BT, McCall MA. Retinal transplants restore visually evoked responses in rats with photoreceptor degeneration. Invest Ophthalmol Vis Sci. 2001;42:1669–76. [PubMed] [Google Scholar]