

Abstract
Ongoing synaptic function and rapid, bidirectional plasticity are both controlled by regulatory mechanisms within dendritic spines. Spine actin dynamics maintain synapse structure and function, and cytoskeletal rearrangements in these structures trigger structural and functional plasticity. Therefore, proteins that interact with actin filaments are attractive candidates to regulate synaptic actin dynamics and, thus, synapse structure and function. Here, we have cloned the rat isoform of class II myosin heavy chain MyH7B in brain. Unexpectedly, this isoform resembles muscle-type myosin II rather than the ubiquitously expressed nonmuscle myosin II isoforms, suggesting that a rich functional diversity of myosin II motors may exist in neurons. Indeed, reducing the expression of MyH7B in mature neurons caused profound alterations to dendritic spine structure and excitatory synaptic strength. Structurally, dendritic spines had large, irregularly shaped heads that contained many filopodia-like protrusions. Neurons with reduced MyH7B expression also had impaired miniature EPSC amplitudes accompanied by a decrease in synaptic AMPA receptors, which was linked to alterations of the actin cytoskeleton. MyH7B-mediated control over spine morphology and synaptic strength was distinct from that of a nonmuscle myosin, myosin IIb. Interestingly, when myosin IIb expression and MyH7B expression were simultaneously knocked-down in neurons, a third, more pronounced phenotype emerged. Together, our data provide evidence that distinct myosin II isoforms work together to regulate synapse structure and function in cultured hippocampal neurons. Thus, myosin II motor activity is emerging as a broad regulatory mechanism for control over complex actin networks within dendritic spines.
Introduction
The majority of forebrain excitatory synapses are located on dendritic spines, and these structures house essential molecular processes that trigger circuit plasticity and memory formation (Segal, 2005; Kasai et al., 2010). Dynamic F-actin is densely concentrated within dendritic spines of cultured neuronal preparations (Star et al., 2002; Zito et al., 2004) and in young rodents in vivo (Gray et al., 2006), and this process mediates rapid changes to spine size and shape (Fischer et al., 1998). Depolymerization of actin filaments induces spine shrinkage and a contaminant decrease in AMPA receptor-mediated synaptic currents (Allison et al., 1998; Kim and Lisman, 1999), while high-frequency stimulations that elicit synaptic plasticity induce polymerization of new actin filaments and an enlargement of spines (Okamoto et al., 2004; Lin et al., 2005; Honkura et al., 2008). Furthermore, actin filament assembly is necessary for long-term potentiation (LTP), memory formation, and extinction of fear (Krucker et al., 2000; Fukazawa et al., 2003; Fischer et al., 2004). Thus, identifying proteins that regulate actin dynamics will facilitate the discovery of novel mechanisms controlling synaptic plasticity and memory formation.
Studies on the regulation of actin dynamics in dendritic spines have focused on actin-binding proteins that regulate treadmillling, branching, and stabilization of individual filaments (Star et al., 2002; Lynch et al., 2007). However, in nearly all cell types and organ systems, actin dynamics are fundamentally regulated by myosin II motors (Vallee et al., 2009; Vicente-Manzanares et al., 2009). These motors are hexameric protein complexes containing two heavy chains and four light chains. Myosin II isoforms are classified based on the primary sequence of the motor domain, and genes encoding heavy chains are subdivided into sarcomeric (muscle) (MyH1, 2, 3, 4, 6, 7, 7B, 8, 11, 13, 15, 16) and nonmuscle (MyH9, 10, 14) isoforms. In the neuronal growth cone, for example, nonmuscle myosin IIb (MyH10 heavy chain) stimulates both depolymerization and polymerization of F-actin, promoting the phenomenon of retrograde actin flow (Medeiros et al., 2006), an essential process that mediates growth cone propulsion (Lin and Forscher, 1995). Interestingly, at least three nonmuscle myosin II motors, IIa (MyH9), IIb (MyH10), and IIc (MyH14), are present in dendritic spines (Cheng et al., 2000; Miyazaki et al., 2000; Ryu et al., 2006; Ishmael et al., 2007). MyH10 is enriched at synapses and regulates dendritic spine morphology and synaptic strength (Zhang et al., 2005; Ryu et al., 2006). Recently, we reported that myosin II motors stimulate de novo synthesis of actin filaments in response to LTP induction and that these filaments stabilize synaptic plasticity and memory formation (Rex et al., 2010). Therefore, understanding the role of individual myosin II motors in dendritic spines will advance our understanding of how mechanical forces at synapses shape synaptic plasticity, ensemble circuit function, and memory encoding.
In this study, we report the cloning, expression, and characterization of a sarcomeric class II myosin heavy chain, MyH7B, in neuronal tissue. MyH7B conforms to a sarcomeric motor consensus, which suggests it has a unique function relative to the nonmuscle isoforms expressed in neurons. Knock-down of MyH7B dramatically disrupted synapse structure, function, and surface AMPA receptor (AMPAR) content. Many of the observed effects on synapse structure and function were distinct from that of MyH10, a canonical nonmuscle myosin II heavy chain. In addition, we show that MyH7B maintains excitatory synaptic function by regulating F-actin filaments associated with AMPA receptors. Our current work indicates that multiple myosin II isoforms contribute to the structural integrity of dendritic spines, and each may functionally mediate distinct pools of F-actin at excitatory synapses.
Materials and Methods
Cloning/analysis of rat MyH7B.
Oligo(dT)-primed and random-primed cDNAs were made from a mixed population of male and female rat brain poly(A)+ RNA using SuperScript III reverse transcriptase (Invitrogen). The full-length rat MyH7B coding sequence was constructed by reverse transcription (RT)-PCRs generating a set of seven overlapping fragments (F1-F7), including a putative start methionine in F1 and stop codon in F7 (see Fig. 1A). Primers were designed based on either GenBank accession no. XM_230774 (predicted rat MyH7B mRNA) or GenBank accession no. NW_047658 (rat chromosome 3 genomic DNA containing MyH7B). Primers incorporated either EcoRI sites (sense) or XbaI sites (antisense) for cloning purposes. PCR products were cloned into pBluescript II SK(−), sequenced, and compared with NW_047658. All generated PCR fragments spanned at least three introns in genomic DNA, thus ruling out any potential for artifacts generated by genomic DNA contamination in RT-PCRs. Of note, both the 5′ and 3′ ends generated by our cloning differ from that predicted by XM_230774. The complete sequence of our rat MyH7B clone can be found in the National Center for Biotechnology Information database (accession no. EU241478). To detect MyH7B message in a pure neuronal population, cDNA was prepared from 2.4 μg of cultured rat neuron total RNA or 300 ng of rat brain polyA+ using SuperScript III reverse transcriptase (Invitrogen) primed with either oligo(dT)20 or random hexamers. Two microliters were then used as template for PCR with Platinum Taq polymerase (Invitrogen). Primers for PCR were directed against the C-terminal region of MyH7B. A mock reaction without SuperScript III added to neuron RNA was included (see Fig. 2C).
Figure 1.

Cloning of a novel myosin II isoform from rat brain tissue. A, RT-PCR fragments on brain mRNA to deduce the putative coding sequence of MyH7B gene product. Seven overlapping fragments were generated (F1–F7), including a start methionine at F1 and a stop codon at F7. B, Domain structure of MyH7B protein. C, Alignment of MyH7B cDNA with a sarcomeric myosin II heavy chain (MyH7) and a nonmuscle myosin II heavy chain (MyH10) in the conserved switch I region. D, Alignment of MyH7B with MyH7 and MyH10 cDNAs in the conserved switch II region. E, Alignment of MyH7B with MyH7 and MyH10 cDNAs in a region that is conserved among sarcomeric or muscle-type myosin II isoforms. F, All myosin isoforms should contain a hyper-variable loop 1 region. MyH7B is not homologous to other myosin II isoforms in this region, which is suggestive of a distinct function.
Figure 2.
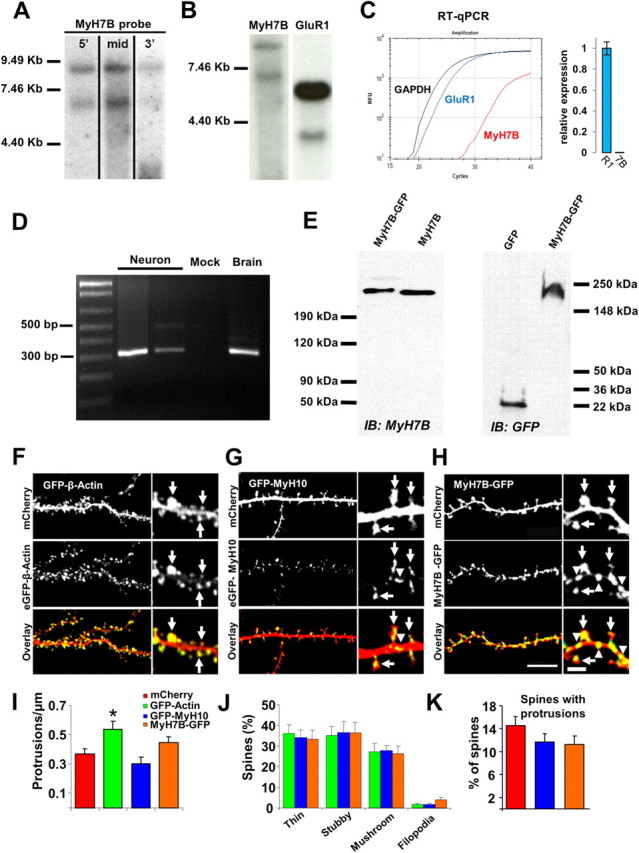
MyH7B-GFP is localized to neurons and its exogenous overexpression does not alter dendritic spine density nor their architecture. A, Northern blot analysis of rat brain tissue with probes targeting three distinct regions of a putative MyH7B mRNA sequence. B, Northern blot analysis of rat brain tissue with probes targeted against MyH7B and GluR1 sequences, showing low expression levels of MyH7B. MyH7B was developed for 8 d while GluR1 was developed for 4 h. C, Left, Example traces from 250 ng of purified mRNA from adult rat hippocampus reverse transcribed and then amplified with GAPDH, GluR1, or MyH7B real-time PCR probes. Right, GluR1 (R1) and MyH7B (7B) relative expression levels in the hippocampus were determined by comparisons to the housekeeping gene GAPDH (see Materials and Methods). MyH7B (n = 3) expression relative to GLuR1 (n = 3) was then calculated by normalizing these two genes to each other. D, RT-PCR using primers directed against the C-terminal region of MyH7B, amplifying a 313bp fragment. Second and third lanes from the left (Neuron) correspond to cDNA from pure rat hippocampal neuronal cultures primed with oligo(dT)20 or random hexamers, respectively. Importantly, neuronal cultures conditions were modified to remove all traces of glia. Fourth lane from the left (Mock) contains sample buffer. Far right land (Brain) contains mRNA purified from adult rat forebrain. E, Left, MyH7B and MyH7B:GFP cDNAs were transfected into HEK293T cells. Two days later, cells were lysed and proteins were separated by SDS-PAGE. Samples were immunoblotted (IB) with custom-made anti-MyH7B IgG. Right, HEK293FS cells were transfected with GFP (left lane) and MyH7B:GFP (right lane) to confirm that GFP is fused to the full-length cDNA of MyH7B. Three days later cells were lysed and samples were immunoblotted with GFP monoclonal antibodies. F–H, Differential intracellular distribution of actin, MyH10 and MyH7B. Representative images of live DIV 18 primary hippocampal neuronal cultures cotransfected with mCherry (n = 6), mCherry and GFP:β-Actin (F, n = 5), GFP:MyH7B (G, n = 6), or MyH7B:GFP (H, n = 8). Arrows indicate location of dendritic spines. Arrowheads indicate dendritic localization. Scale bars (in H): left, 20 μm; right, 2 μm. I, Quantification of dendritic spine density expressed as number of protrusions per micrometer of the neurons shown in F, H). Neurons expressing GFP-actin show an increase in dendritic spine density compared with mCherry controls; mCherry: 0.37 ± 0.04; GFP-actin: 0.53 ± 0.06; GFP-MyH10: 0.3 ± 0.05; MyH7B-GFP: 0.45 ± 0.04. Data are expressed as mean ± SEM; one-way ANOVA followed by Fisher's LSD; *p < 0.05. J, Quantification of dendritic spine morphology expressed as a percentage of total spines counted. One-way ANOVA analysis within groups shows that overexpression of MyH7B-GFP does not modify dendritic spine morphology. Thin: GFP-actin: 35.9 ± 4.4%; GFP-MyH10: 34.06 ± 3.6%; MyH7B-GFP: 33.3 ± 4.3%. Stubby: GFP-actin: 35.1 ± 4.3%; GFP-MyH10: 36.5 ± 5.5%; MyH7B-GFP: 36.4 ± 5.2%. Mushroom: GFP-actin: 27.25 ± 4.1%; GFP-MyH10: 27.6 ± 2.8%; MyH7B-GFP: 26.4 ± 3.5%. Filopodia: GFP-Actin: 1.7 ± 4.1%; GFP-MyH10: 1.7 ± 2.8%; MyH7B-GFP: 3.9 ± 3.5%. Data are expressed as mean ± SEM. K. Quantification of dendritic spines with protrusions arising from their head expressed as a percentage of total spines counted. mCherry: 14.45 ± 1.6%; GFP-MyH10: 11.62 ± 1.5%; MyH7B-GFP: 11.21 ± 1.6%. One-way ANOVA analysis did not show significant differences among groups. Data are expressed as mean ± SEM.
Northern analyses.
Total RNA was prepared from adult whole rat brain using TRIzol (Invitrogen). Poly(A)+ RNA was prepared using the Promega poly(A)Tract mRNA isolation system. Five micrograms of poly(A)+ RNA were loaded along with 0.24–9.5 kb RNA ladder (Invitrogen) on a 0.9% agarose gel containing formaldehyde. After electrophoresis and transfer to Hybond-XL membrane (GE Healthcare), the blot was cut into strips and hybridized with random primed probes using standard techniques. Probes were prepared from three regions of rat MyH7B as follows: 5′ (nucleotides 1-406), middle (nucleotides 1938-2638), and 3′ (nucleotides 5744-6097).
Real-time, quantitative reverse transcription PCR.
Quantitative RT- PCR for analysis of mRNA from rat hippocampal tissue and small interfering RNA (siRNA)-transfected neuronal cultures was performed in one step using commercially available reagents (iScript one-step supermix, Bio-Rad) and TaqMan probes for Rattus norvegicus MyH7b, MyH10, GluR1, and glutaraldehyde 3-phosphate dehydrogenase control (GAPDH) (Applied Biosystems). All probes were designed to span exon boundaries, ensuring amplification of only mRNA. Equal amounts of RNA were analyzed in triplicate for each probe used. Accurate loading and probe efficiency were confirmed by appropriate changes in cycle threshold (CT) with RNA dilution (750, 250 and 83.3 ng) and comparison with GAPDH amplification. Probe efficiency was further validated by comparing CT changes associated with amplification of plasmid cDNA (MyH7b and GluR1; 500, 50 and 5 pg) using commercially available reagents (Applied Biosystems) and MyH7b and GluR1 TaqMan probes. All CT values were chosen in the linear range of amplification, and the comparative CT method was used to calculate relative differences in gene expression.
Western blot.
Western blots were performed as described previously (Rex et al., 2010). Briefly, MyH7B and MyH7B:green fluorescent protein (GFP) cDNAs were transfected into HEK293T cells using Lipofectamine 2000 (Invitrogen). Two days later, cells were lysed and proteins were separated by SDS-PAGE. Samples were immunoblotted with custom-made anti-MyH7B IgGs. For enhanced GFP (eGFP) detection, HEK293FS cells were transfected with 1 μg of MyH7B:GFP using the method described below and immunoblotted using an anti-GFP antibodies (1:5000, Abcam). For MyH10 expression studies, primary neuronal cultures were transfected with control or MyH10-specific siRNAs using Lipofectamine 2000 (Invitrogen). Three days later, cultures were lysed, separated by SDS-PAGE, and immunoblotted with anti-MyH10 and anti-tubulin IgG.
Cell culture and plasmid transfection.
Medium-density hippocampal cultures (1 × 10⁶ cells/coverslip) from embryonic day 18 Sprague Dawley rats were prepared as described previously (Rumbaugh et al., 2006). At 15 days in vitro (DIV), 1 μg of MyH7B:GFP, GFP:β-actin, or GFP:MyH10 were cotransfected with 0.5 μg of mCherry as a transfection indicator using CaPO4 (Stratagene). Imaging was done 3 d later to ensure maximum expression of the plasmids. For siRNA-mediated knock-down experiments, we obtained a pool of four double-stranded oligonucleotides (ON-TARGET-Plus siRNA, Dharmacon) specific for either MyH7B (accession no. XM_230774; catalog #L-093061-00) or MyH10 (accession no. NM_031520; catalog #L-098035-01-0010). Each pool potently reduced expression of transfected constructs containing the cDNA for each respective gene in heterologous cells. A pool of control siRNAs were also purchased from this company (Dharmacon). To transfect oligonucleotides into neurons, we cotransfected 1 μg/ml siRNA (75–80 nm) and 0.5 μg of eGFP or mCherry with Lipofectamine 2000 (Invitrogen) or CaPO4. For all siRNA experiments, we waited at least 3 d to ensure maximal protein knock-down. Pooled siRNA sequences targeted against MyH7B (accession no. EU241478) were as follows: #5 (4589–4607), 5′-GCACCGAGCUCUUUCGAUU-3′; #6 (5825–5843), 5′-GUACCAACCUGGCUAAGUA-3′; #7 (1899–1917), 5′-CGUGGUACCUUAUAGCAUU-3′; #8 (1458–1476), 5′-GCUGGUAUCUCGAAUCAAU-3′. To construct a siRNA-insensitive form of MyH7B, we engineered five silent mutations within the siRNA #5 complimentary region (C4590T, G4596A, C4597T, C4599A, C4603A).
HEK293FS cell transfection.
HEK293FS cells were transfected with 1 μg/ml siRNA (75–80 nm) and 0.5 μg of eGFP using a modified CaPO4 method. Briefly, HEK293FS cells were incubated with serum-free DMEM 30 min before transfection and then incubated with a solution of CaCl2, Hank's balanced salts, and DNA in a 37°C, 5% CO2 incubator. Three hours later, medium containing the DNA solution was removed and replaced with acidified DMEM to dissolve CaPO4 crystals. Cells were then incubated in a 37°C, 5% CO2 incubator for 20 min, after which the acidified medium was replaced with warm serum containing DMEM. Twenty-four hours later cells were collected and mRNA was extracted using TRIzol.
Electrophysiology and miniature EPSC analysis.
Whole-cell patch-clamp recordings were performed essentially as described previously (Rumbaugh et al., 2006). In all electrophysiological experiments, a similar amount of data was acquired from both control siRNA-transfected and gene-specific siRNA-expressing neurons on the same day. Data from each group were then averaged, and statistical significance was determined by Student's t test unless noted otherwise.
Immunocytochemistry.
In general, primary neurons were processed for immunocytochemistry as described previously (Rumbaugh et al., 2006). For GluR1 surface staining, transfected cells were incubated for 20 min with rabbit anti-GluR1 primary antibody (1:10, EMD Chemicals) in complete medium at 24°C in an incubator with an O2/CO2 ratio of 95/5%. After brief washes in artificial CSF (ACSF) at room temperature cells were fixed in 4% paraformaldehyde in ACSF, washed in PBS, permeabilized with 0.2% Triton-X in PBS for 10 min, washed in PBS again, and blocked for 1 h in blocking solution [1% bovine serum albumin (BSA) and 5% normal goat serum (NGS) in PBS]. Neurons were then washed with PBS and incubated for 1 h in goat anti-rabbit Alexa Fluor 555 (1:1000, Invitrogen) secondary antibodies diluted in probing solution (1% BSA and 1% NGS in PBS) to label GluR1. After washing in PBS, cells were incubated in normal rabbit IgG (1:500) in probing solution for 1 h at room temperature, washed in PBS, and labeled with rabbit anti-GFP Alexa Fluor 488 (1:1000, Invitrogen) in probing solution. Neurons were then washed in PBS and mounted using 4′,6-diamidino-2-phenylindole mounting solution (Invitrogen). For total GluR1 experiments, we blotted permeabilized cultured hippocampal cells with primary antibodies against the cytoplasmic domain of GluR1 (1:500, Millipore) and GFP (1:300, Abcam), followed by secondary antibodies anti-rabbit Alexa Fluor 555 and anti-mouse Alexa Fluor 488 (1:1000, Invitrogen). For GluR1 cluster analysis, all confocal microscope settings were kept the same to measure fluorescence intensity. To measure cluster intensity each image was thresholded to 3 SDs above average background intensity, and the area and intensity values from the thresholded images were obtained. For each neuron, the area and intensity of individual clusters were averaged into a single value, and this value was used to obtain the mean and SEM.
Microscopy.
All images were acquired with a LSM 510 META confocal scanning laser microscope (Carl Zeiss) except for fixed cells (for sGluR1 experiments), which were imaged on an LSM 710 confocal scanning microscope (Carl Zeiss). Spine analysis and localization studies were performed in live neurons using a 63× Plan-Apochromat water-dipping objective (numerical aperture,1.0). Images were acquired as multichannel 8-bit TIFF files with a 1024 × 1024 resolution. A stack of images was obtained with an interval of 0.35 μm except for surface and total GluR1 immunostained neurons, where images were taken as a single plane. ImageJ (Invitrogen) or MetaMorph 7.0 (Molecular Devices) was used to convert image stacks to single image Z-projections (maximum intensity) for subsequent analysis.
Spine analysis.
All measurements were performed using MetaMorph 7.0 software except for the circularity index, which was analyzed using ImageJ software. For each neuron we traced 200 μm dendritic segments and analyzed their protrusions. Morphometric measurements were obtained following the guidelines described in previous studies (supplemental Fig. S1A, available at www.jneurosci.org as supplemental material) (Ryu et al., 2006), and spines were classified into thin, stubby. or mushroom as described previously (Harris et al., 1992). To analyze dendritic spine head circularity index and area, each individual head, including any protrusion arising from it, was manually outlined in ImageJ software to obtain the area and perimeter from where the circularity index (4 * π * (area/perimeter2)) was calculated (supplemental Fig. S1B). It is important to note that the spine head circularity index was measured only in dendritic spines bearing heads, namely mushroom and thin. Any spine head with a circularity index of >1 was excluded from the analysis, because these correspond to small dendritic spine heads that give an erroneous measurement. The data collected were then logged into a spreadsheet and plotted as a cumulative frequency curve and a frequency distribution histogram, the latter normalized to the total number of spines. For each spine or filopodia, the total length was measured by drawing a line from the proximal insertion in the dendritic shaft to the opposite distal end, excluding any abnormal protrusion emitted from the spine head (supplemental Fig. S1A, red line). Width refers to the maximum distance perpendicular to the length (supplemental Fig. S1A, blue line), also excluding abnormal protrusions. The enrichment of GFP-actin in spines was performed by first acquiring a single channel image of the GFP signal. The resulting image was thresholded to 2× background, and a circular region of five pixels was outlined on a dendritic spine. Subsequently, a region totaling five pixels was also drawn in the dendritic shaft directly adjacent from the spine. The integrated intensity of the spine was then normalized to the integrated intensity of the shaft to give a relative measure that yields a spine targeting value.
Statistical analysis.
All data were analyzed using Microsoft Excel software. Data are presented as mean ± SEM. Student's t test or one-way ANOVA followed by Fisher's least significant difference (LSD) test was used as stated. Data parametric distribution was analyzed using GB-STAT 6.5 (Dynamic Microsystems). Hartigan's dip test was performed to test for modality of the circularity index distribution using the R 2.11.0 software with dip test package installed (The R Foundation for Statistical Computing).
Results
Identification of a novel myosin II isoform expressed in rat brain
We performed a yeast-two-hybrid (YTH) screen, using the C terminus of SynGAP1 as bait to discover novel proteins that regulate synaptic function. Once the screen was completed, we focused on clone 11a, which had high homology to a recently discovered human sarcomeric myosin II heavy chain (NM_020884) (Desjardins et al., 2002). Clone 11a aligned perfectly with a region on chromosome 3 of R. norvegicus and was predicted to encode the rat isoform of MyH7B. Using the rat genome as a guide, we performed a series of RT-PCRs on rat brain mRNA to deduce the coding sequence of a putative gene product (Fig. 1A). The resulting full-length cDNA was highly homologous to human MyH7B, strongly suggesting that this was the rat homolog of this myosin II heavy chain. Analysis of the 1941-residue open reading frame uncovered a classical myosin II domain structure (Fig. 1B). Within the myosin II head domain, MyH7B conformed to the switch I and switch II ATPase motifs, and these regions were highly homologous to other rat myosin II isoforms (Fig. 1C,D). We next analyzed a region in the ATPase domain that contains consensus residues for sarcomeric or muscle-like myosin II heavy chains (Fig. 1E). As expected, rat MyH7B shared no homology with the nonmuscle heavy chain MyH10 in this region, which suggested that these two myosin II heavy chains are functionally distinct. MyH7B was, however, highly homologous to rat MyH7 (NM_017240), a sarcomeric myosin II heavy chain that is expressed in heart tissue and drives ventricular contraction (Wendel et al., 2000). MyH7B shared no homology with any of these myosin II isoforms in the hypervariable “loop 1” area, a region which serves as the nucleotide binding domain (Fig. 1F), again indicating that this heavy chain isoform may have a distinct function from other myosin II isoforms.
To confirm MyH7B expression in rat brain, we purified mRNA from brain tissue and probed for putative transcripts of this myosin II heavy chain. Using three distinct probes targeted to the 5′, middle, and 3′ regions of the mRNA, we identified two prevalent bands of 6.5 and 9 kb (Fig. 2A) corresponding to the canonical sequence and an alternative splicing form of MyH7B, respectively. Interestingly, the Northern blot signal was extremely weak as demonstrated by comparison to GluR1 expression (Fig. 2B), suggesting that this mRNA is present but scarce in rat brain. To confirm that MyH7B message was scarce in brain tissue, we performed quantitative real-time PCR on purified rat hippocampal mRNA. Indeed, MyH7B message was ∼863-fold less abundant than GluR1 (Fig. 2C). Control experiments confirmed that these real-time probes had similar amplification efficiencies (supplemental Fig. S2A,B, available at www.jneurosci.org as supplemental material). We then proceeded to determine whether MyH7B was expressed in neurons by performing RT-PCR in 18 DIV hippocampal neuronal cultures lacking astroglia. A band of ∼300 bp was obtained using two different sets of primers directed to the C-terminal portion of MyH7B (Fig. 2D), thus confirming the expression of MyH7B mRNA in neurons. We were unable to generate antibodies capable of detecting endogenous MyH7B protein in brain tissue or cultured neurons (supplemental Fig. S2C). These antibodies were, however, able to detect recombinant MyH7B, indicating that the antibodies were specific and that cDNAs of MyH7B produce a full-length protein (Fig. 2E). Considering that MyH7B message is scarce in brain (Fig. 2C), we were most likely unable to detect endogenous MyH7B protein because it is expressed at very low levels in the brain.
MyH10 and β-actin are fundamental regulators of spine morphology, and MyH10 is often expressed at locations of high actin content (Ryu et al., 2006). However, because MyH7B belongs to a different subclass of myosin II motors (Desjardins et al., 2002), we sought to determine whether this isoform was also localized in dendritic spines. We tested this possibility by cotransfecting DIV 15 hippocampal neurons with mCherry (as a cytoplasmic marker) along with GFP:β-actin, GFP:MyH10, or MyH7B:GFP for 3 d. Our results showed that β-actin and MyH10 were both enriched in dendritic spines (Fischer et al., 1998; Ryu et al., 2006) (Fig. 2 F,G), while MyH7B is localized to both dendritic spines and dendritic shafts (Fig. 2H). To ensure that exogenous expression of GFP-tagged MyH7B does not modify dendritic spine density and/ or its morphology, we analyzed these parameters in neurons expressing MyH7B-GFP (Fig. 2H) and compared it to those expressing GFP-tagged actin or MyH10. We found, as was previously reported (Johnson and Ouimet, 2006), that overexpression of GFP-actin increased protrusion density while overexpression of either myosin II heavy chain had no effect (Fig. 2I). In addition, these three transgenes had no effect on spine morphology classification (Fig. 2J) or dendritic spine head morphology (Fig. 2K).
MyH7B maintains synaptic strength in hippocampal neurons through an actin-dependent mechanism
We initially discovered rat MyH7B through a YTH screen with the synaptically enriched protein SynGAP1, which is a potent regulator of synapse structure (Vazquez et al., 2004) and function (Rumbaugh et al., 2006) and is believed to cause certain forms of nonsyndromic mental retardation (Hamdan et al., 2009). This information, together with MyH7B-GFP localization to dendritic spines, led us to hypothesize that MyH7B is involved in processes that support synaptic function. To test this idea, we recorded miniature EPSCs (mEPSCs) from hippocampal neurons transfected with a pool of siRNAs targeted to four distinct locations of MyH7B mRNA, along with a fluorescent protein to visualize neurons expressing the siRNA pool (Rumbaugh et al., 2006). While the mEPSC frequency was not significantly affected (Fig. 3A,B), the mEPSC amplitude from cells expressing a pool of four MyH7B-specific siRNAs (pool) was significantly reduced when compared with cells expressing control siRNA (Fig. 3A,C,D). The reduction in mEPSC amplitude was robust and easily identifiable in all cells recorded. We also observed a decrease in mEPSC amplitude in cells expressing a single siRNA targeted against MyH7B (Fig. 3D, siRNA #5). We then performed site-directed mutagenesis on our MyH7B cDNA to create a siRNA-insensitive “rescue” construct (supplemental Fig. S3A-C, available at www.jneurosci.org as supplemental material). This rescue construct has five silent mutations in the siRNA #5 targeting region of the MyH7B rat cDNA (C4590T, G4596A, C4597T, C4599A, C4603A). Neurons coexpressing siRNA #5 together with the rescue construct had normal mEPSC amplitudes (Fig. 3D), indicating that exogenous expression of rescue MyH7B was able to reverse the disruption caused by our siRNA. Importantly, overexpression of only the rescue form of MyH7B had no effect on mEPSCs (Fig. 3D, GFP-MyH7B). Using two independent methods, we also confirmed that MyH7B siRNAs do not decrease MyH10 transcripts. First, we transfected MyH7B siRNAs into neurons and then purified total RNA 3 d later. We found that MyH7B siRNA decreased its own mRNA, but surprisingly increased MyH10 transcript levels by ∼17-fold (supplemental Fig. S3D). To more directly test target specificity of these siRNAs, we transfected GFP-tagged MyH10 and MyH7B along with the siRNA pool into HEK cells and then measured expression levels of each fusion protein 3 d later (supplemental Fig. S3E). We found that MyH7B expression was decreased ∼5-fold, whereas MyH10 expression was again increased but to a much lesser extent this time, confirming that MyH7B siRNAs do not decrease MyH10 expression.
Figure 3.
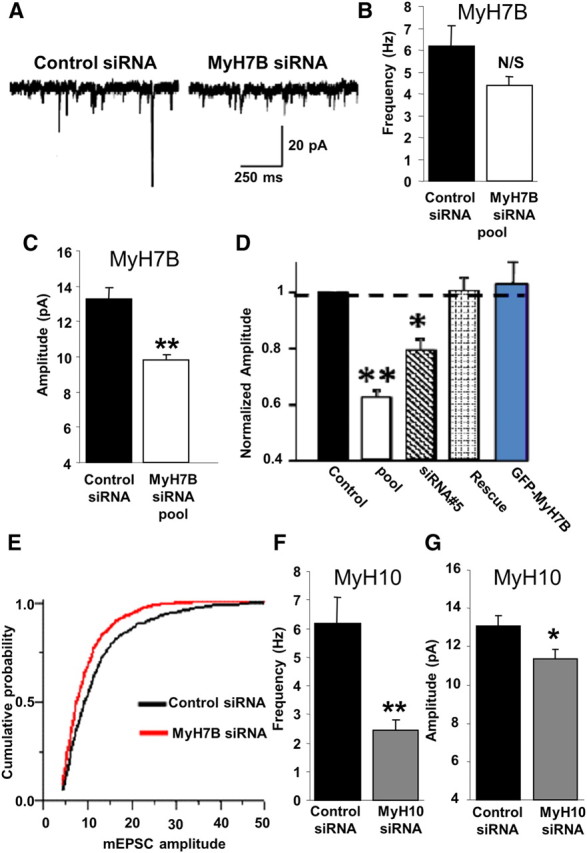
Distinct regulation of synaptic function by MyH7B and MyH10 siRNAs. A, mEPSC traces were selected from whole-cell recordings of primary hippocampal neurons cotransfected with eGFP and control siRNA (n = 18) or a pool of four different siRNA sequences targeted to four different MyH7B regions (n = 19). B, Quantification of mEPSCs frequency for neurons recorded on A. Control siRNA: 6.17 Hz ± 0.92 Hz; MyH7B siRNA: 4.39 Hz ± 0.39 Hz. Student's t test statistical analysis did not show a statistical significance between groups; N/S, not significant. Data expressed as mean ± SEM. C, Quantification of mEPSCs amplitude for neurons recorded in A. Only mEPSCs with amplitudes > 4 pA were considered successful events. Control siRNA: 13.28 ± 0.65 pA, n = 18; MyH7B siRNA: 9.8 ± 0.3 pA, n = 19; Student's t test: **p < 0.01. Data are expressed as mean ± SEM. D, Normalized mEPSC amplitudes from several experiments looking at the effect of MyH7B on synaptic function. To arrive at the normalized amplitude, events from each neuron were averaged, and then the mean from all cells in a group was derived. In each condition, mean siRNA mEPSCs were normalized to control. Control refers to mEPSC amplitudes from neurons (13.8 ± 0.6 pA, n = 10) expressing control siRNA pools. Pool refers to the MyH7B-specific siRNA data shown in C. siRNA #5 refers to a single siRNA that effectively reduced mEPSC amplitude (11.8 ± 0.4 pA, n = 10) when compared with control siRNAs. Rescue refers to neurons coexpressing siRNA #5 together with a rescue construct (13.9 ± 0.5 pA, n = 8), which is a siRNA #5-insensitive MyH7B cDNA normalized to control siRNAs. GFP-MyH7B refers to neurons expressing the rescue construct by itself (16.2 ± 2.1 pA, n = 11) normalized to untransfected neighboring neurons (15.3 ± 1.5 pA, n = 11); *p < 0.05; **p < 0.01. Data are expressed as mean ± SEM. E, Cumulative probability distribution plotted from all events acquired from neurons transfected with control (n = 1256) or MyH7B-specific (n = 1471) siRNA pools. F, G, Mean mEPSC frequency and amplitude from neurons expressing GFP and control siRNA (n = 5; frequency: 6.18 Hz ± 0.9 Hz; amplitude: 13.06 ± 0.58 pA) or MyH10 siRNA pool (n = 6; frequency: 2.45 Hz ± 0.34 Hz; amplitude: 11.37 ± 0.5 pA); Student's t test: *p < 0.05; **p < 0.01. Data are expressed as mean ± SEM.
Our data show that lowering the expression of MyH7B causes a significant decrease in mEPSC amplitude with no effect on mEPSC frequency. This, together with the fact that MyH7B is localized to dendritic spines, led us to hypothesize that MyH7B controls a general process that regulates nearly all functional excitatory synapses. It has been shown previously that a multiplicative shift in the cumulative probability fraction of mEPSCs amplitudes is indicative of a cell-wide change in synaptic strength (O'Brien et al., 1998; Turrigiano et al., 1998). Indeed, mEPSC events from cells transfected with MyH7B siRNAs were decreased by a multiplicative factor of 0.62 relative to controls. These data suggest that loss of MyH7B from neurons causes a reduction in synaptic strength across nearly all excitatory synapses. We then transfected either control or MyH7B-specific siRNA pool into hippocampal neurons and measured the density of excitatory synapses using vGlut1 antibodies. We found that there was no effect of MyH7B siRNA expression on the density of excitatory synapses (supplemental Fig. S4, available at www.jneurosci.org as supplemental material) (control, n = 14, 0.64 ± 0.1 puncta/μm; MyH7B siRNA pool, n = 14, 0.73 ± 0.11 puncta/μm), supporting the idea that MyH7B has a direct role in supporting synaptic function.
We next sought to understand whether MyH7B and MyH10 have similar effects on the maintenance of synaptic strength. Thus, we recorded mEPSCs from cultured hippocampal neurons transfected with either a control pool or a pool of siRNAs directed against four different regions of the MyH10 mRNA, together with a cytoplasmic marker. Pool siRNAs targeting MyH10 disrupted its expression in cultured neurons (supplemental Fig. S5, available at www.jneurosci.org as supplemental material). Reducing expression of MyH10 did affect synaptic function, though there was a pronounced decrease on mEPSC frequency and only a mild effect on amplitude (Fig. 3F,G), which was in stark contrast to the effects seen with MyH7B siRNAs.
MyH7B regulates actin dynamics and AMPAR trafficking in hippocampal neurons
Disrupting actin filaments in pyramidal neurons causes a decrease in synaptic strength (Kim and Lisman, 1999). Therefore, we hypothesized that the observed reduction of AMPAR-mediated mEPSCs resulting from expression of MyH7B siRNAs are mechanistically linked to disruption of the actin cytoskeleton. To study this possibility, we first examined the effect of MyH7B on actin filaments in dendritic spines. Indeed, when we measured the relative enrichment of GFP-actin in dendritic spines of neurons expressing a pool of MyH7B siRNAs, there was a significant shift of GFP-actin from dendritic spines to the shaft (Fig. 4A,B). To further test this idea, we internally perfused latrunculin A into hippocampal neurons and measured the mEPSCs amplitude over time. Latrunculin A is a compound with high affinity for monomeric G-actin that depolymerizes the cytoskeleton in a rapid, reversible, and specific fashion. In agreement with previous studies (Kim and Lisman, 1999) we observed that in control nontransfected neurons, mEPSC amplitude decreased rapidly in the presence of latrunculin A, while vehicle (DMSO) had no effect on mEPSC amplitudes (Fig. 4C). Internal perfusion of latrunculin A into neurons expressing control siRNAs resulted in a significant decrease in mEPSC amplitude, whereas this drug had no additional effect on neurons expressing MyH7B siRNAs (Fig. 4D). mEPSCs frequency remained unchanged in every condition tested (Fig. 4E).
Figure 4.
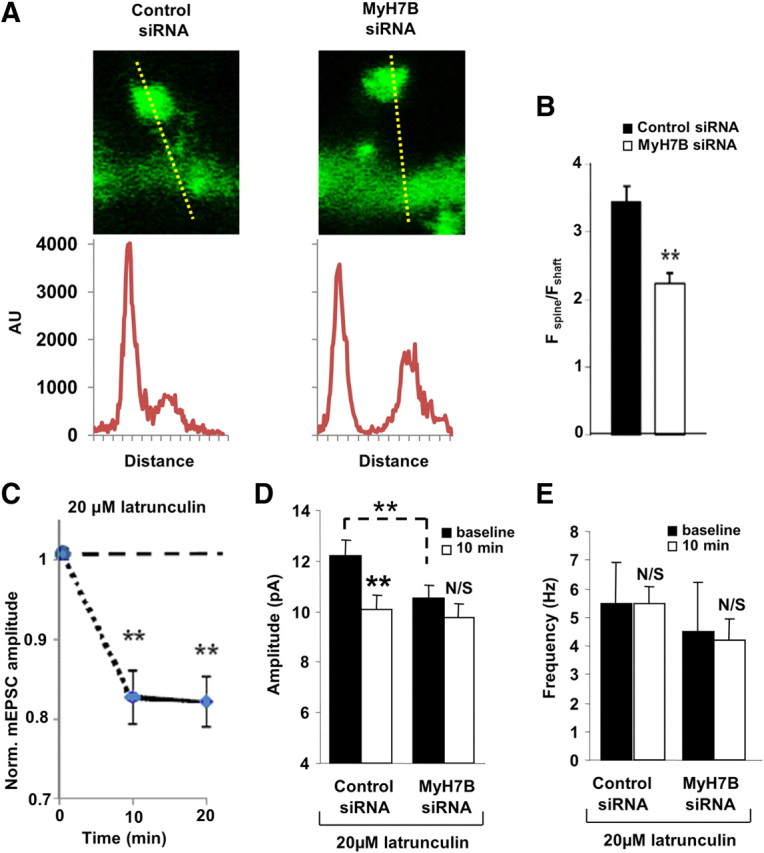
MyH7B maintains synaptic function through an actin-mediated mechanism. A, Representative image of a DIV 18 neuron expressing GFP-β-actin and either a pool of control siRNAs (left) or a pool of siRNAs targeted to MyH7B (right). A line scan through a spine and adjacent dendritic shaft yielded an intensity versus distance profile, allowing the assessment of relative actin density in these structures. AU, Arbitrary units. B, Quantification of the spine/shaft ratio of GFP-β-actin in neurons expressing control (n = 23 spines) or MyH7B-specific (n = 23 spines) siRNA pools; Student's t test: ** p < 0.01. Data are expressed as mean ± SEM. C, The effect of latrunculin A on mEPSC amplitude over time. Control nontransfected DIV 14–17 neurons (n = 6) were patch-clamped with 20 μm latrunculin or vehicle (DMSO) in the internal saline. At 2 min after “break-in,” events over next minute were average to yield a baseline mEPSC amplitude. Events were then averaged 10 and 20 min after baseline and these averages were normalized to that baseline; Student's t test: **p < 0.01. D, DIV 14–15 neurons were assessed for effects of latrunculin A in the presence of siRNAs. Comparison between mEPSC average amplitude at baseline (black bars) and after 10 min (white bars) in neurons transfected with mCherry and control siRNA pool (control siRNA, n = 6, baseline: 12.23 ± 0.59 pA; 10 min: 10.11 ± 0.57 pA) or MyH7B-specific siRNA pool (MyH7B siRNA, n = 7, baseline: 10.56 ± 0.47 pA; 10 min: 9.78 ± 0.53 pA) that were patch-clamped with 20 μm latrunculin A in the internal saline; Student's t test: **p < 0.01. Data are expressed as mean ± SEM. E, Average frequency plot of the cells tested in D. Control baseline: 5.5 Hz ± 1.41 Hz; 10 min: 5.47 Hz ± 1.74 Hz; MyH7B siRNA baseline: 4.48 Hz ± 0.59 Hz; 10 min: 4.21 Hz ± 0.71 Hz. Student's t test: N/S, not significant. Data expressed as mean ± SEM.
In addition to reducing synaptic strength, depolymerizing synaptic F-actin also causes removal of AMPA receptors from dendritic spines (Allison et al., 1998). mEPSC amplitude is dependent upon the concentration of functional AMPARs apposed to presynaptic vesicle release sites, and AMPAR function can be regulated by phosphorylation (Banke et al., 2000) or through dynamic receptor trafficking to and from the synaptic surface (Kessels and Malinow, 2009). To understand whether altered receptor trafficking could explain reduced synaptic function seen after MyH7B knock-down, we performed immunostaining of surface GluR1 AMPA receptor subunits (sGluR1) in DIV 18 neurons expressing a pool of either control or MyH7B siRNAs. eGFP was cotransfected to visualize the cytoplasm and to identify neurons expressing siRNAs (Fig. 5A). Compared with the control condition, cells lacking MyH7B had smaller and less intense sGluR1 clusters (Fig. 5B,C), which is consistent with our observation of reduced mEPSC amplitudes in cells containing MyH7B siRNAs. MyH7B knock-down had no effect on total GluR1 cluster area (Fig. 5D) or intensity (Fig. 5E), indicating that MyH7B siRNAs alter GluR1 trafficking and/or anchoring at the synapse.
Figure 5.
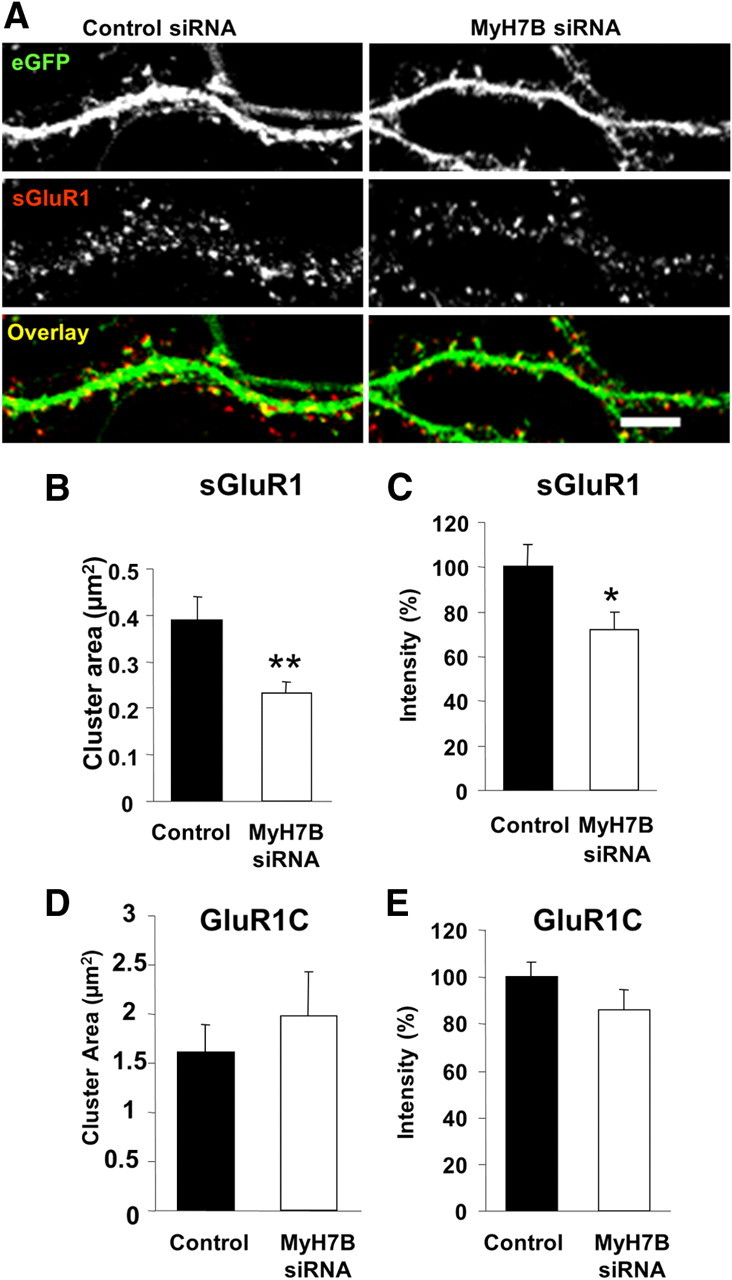
MyH7B regulates AMPAR surface expression at excitatory synapses. A, DIV 18 primary hippocampal neurons were cotransfected with eGFP and either control (left) or MyH7B siRNA (right) pools. Neurons were then stained for sGluR1, fixed, permeabilized, and stained for eGFP. Figure shows eGFP (top), GluR1 (center), and colocalization of both (bottom, yellow areas). Scale bar, 5 μm. B, Quantification of surface GluR1 cluster area from neurons cotransfected with eGFP and control (n = 5, 0.39 ± 0.05 μm2) or MyH7B siRNA pools (n = 7, 0.24 ± 0.024 μm2); Student's t test: **p < 0.01. Data expressed as mean ± SEM. C, Quantification of surface GluR1 cluster pixel intensity from the same neurons as in B. Control: 100% ± 10.02%; MyH7B siRNA pool: 71.86 ± 7.92%. Images were averaged and normalized to control. Data are expressed as mean percentage intensity of control neurons ± SEM. Student's t test: *p < 0.05. D, Quantification of total GluR1 cluster area from neurons cotransfected with eGFP and control (n = 5, 1.62 ± 0.27 μm2) or MyH7B siRNA pools (n = 7, 1.98 ± 0.45 μm2). Data are expressed as mean ± SEM. E, Quantification of total GluR1 cluster pixel intensity from the same neurons as in D. Control: 100 ± 6.6%; MyH7B siRNA pool: 86.5 ± 8.7%. Images were averaged and normalized to control. Data expressed as mean percentage intensity of control neurons ± SEM.
MyH7B regulates dendritic spine morphology in hippocampal neurons
Given the cell-wide effects of MyH7B siRNAs on mEPSC amplitude, the localization of MyH7B-GFP in dendritic spines, and the likelihood of an interaction with actin filaments, we hypothesized that this protein would be involved in the regulation of dendritic spine morphology in hippocampal neurons. Indeed, expression of MyH7B-specific siRNAs resulted in abnormally shaped and unusually large dendritic spines (Fig. 6A). Many dendritic protrusions were positive for postsynaptic proteins (Fig. 5) but lacked traditional spine morphology. In addition, spine-like protrusions from dendrites expressing MyH7B-specific siRNAs often had long filopodia-like protrusions extending from their head (Fig. 6A), which was reversed by cotransfection of the rescue construct (Fig. 6A,B). To further quantify spine head distortions in response to reducing MyH7B expression, we measured the spine head's circularity index (CI) (Amaral and Dent, 1981; Pak et al., 2001), where a value of 1 corresponds to a perfect circle. We found that neurons that contained MyH7B siRNAs had more irregularly shaped (less circular) dendritic spine heads relative to control (Fig. 6C), a phenomenon that was partially rescued by coexpression of the siRNA #5-insensitive form of MyH7B:GFP. We next analyzed the cumulative probabilities of the CI for all spines measured (Fig. 6D; supplemental Fig. S6, available at www.jneurosci.org as supplemental material). Reducing MyH7B expression dramatically shifted the CI population to the left. Assessment of the interquartile area in control neurons uncovered a spread that spanned 0.9 to 1, indicative of normal, round spine heads. However, there was a far greater spread of the CI interquartile area in MyH7B knock-down neurons, which covered a range from 0.5 to 1. Interestingly, CI distribution was unimodal in control neurons (Fig. 6D, Hartigan's dip test p < 0.01), but shifted to a multimodal distribution in cells expressing MyH7B siRNAs (Fig. 6D, Hartigan's dip test: p > 0.05; supplemental Fig. S6, available at www.jneurosci.org as supplemental material). These data indicate that only a subpopulation of spines was morphologically affected by MyH7B disruption, but spines that were affected had dramatic alterations in their CI. Furthermore, MyH7B knock-down neurons had larger heads (Fig. 6E), and a quantitative morphometric analysis revealed a switch in the overall characteristics of spine shapes in neurons expressing MyH7B siRNAs (supplemental Fig. S7A, available at www.jneurosci.org as supplemental material). Dendritic spine head width, neck width, and spine length were measured and spines were classified into thin, stubby, mushroom, or filopodia, as described previously (Harris et al., 1992). Our results revealed that MyH7B siRNAs induce a significant increase in the ratio of thin spines and filopodia, with a concomitant decrease in stubby spines (supplemental Fig. S7A). The percentage of mushroom spines remained unchanged, and spine length was unaltered (Fig. 6F). We then wished to determine whether knocking down MyH7B promoted outgrowth of irregular spines or if these were the result of a disruption of previously existing “normal” spines. For this, we counted the number of protrusions for every micrometer of dendritic shaft (Fig. 6G). Interestingly, we observed a reduction in the number of protrusions in neurons expressing MyH7B siRNAs compared with controls, suggesting an involution of dendritic spines and supporting the idea that a population of pre-existing, morphologically normal dendritic spines undergoes a molecular change that causes a distorted head shape.
Figure 6.
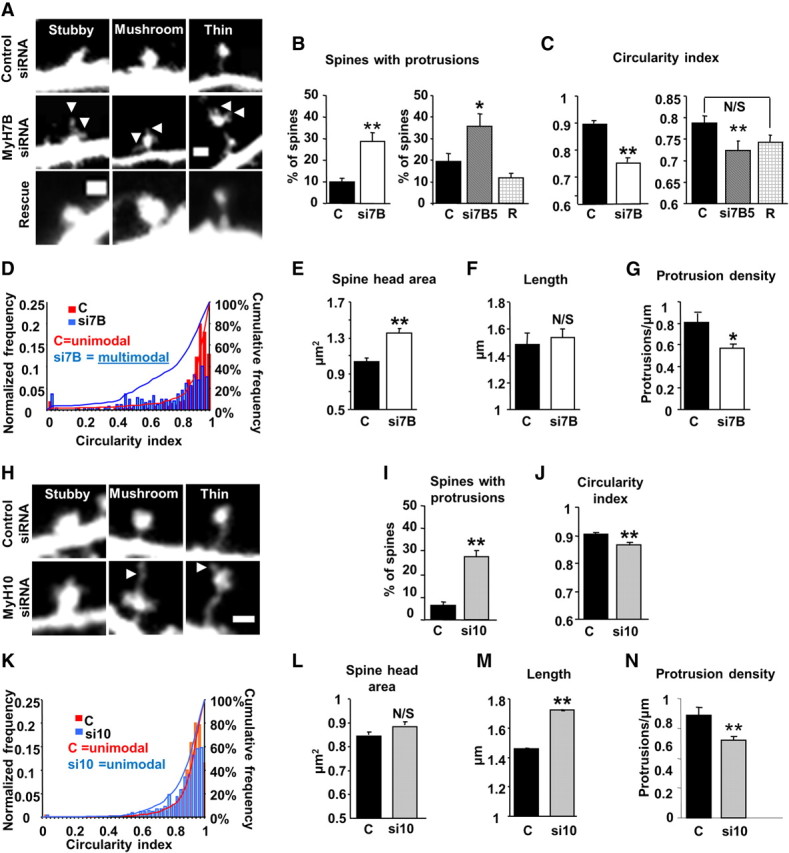
MyH10 and MyH7B have distinct effects on spine morphology. A, Representative stubby (left), mushroom (center), and thin (right) dendritic spines from a DIV 18 neuron cotransfected with mCherry and either control siRNA pool (top), MyH7B siRNA pool (middle) or MyH7B #5 and recue construct (bottom, Rescue). Arrowheads indicate filopodia-like protrusions extending from dendritic spine heads. Scale bars, 1 μm. B, Left: Quantification of dendritic spines showing protrusions arising from the heads of neurons transfected with mCherry and control siRNAs (C, n = 8, 9.99 ± 1.8%) or MyH7B siRNA pool (si7B, n = 8, 28.85 ± 4.16%); Student's t test: **p < 0.01. Data are expressed as mean ± SEM. Right: Quantification of dendritic spines showing protrusions arising from the heads of neurons transfected with mCherry and control siRNAs (C, n = 8, 19.24 ± 3.72%), MyH7B siRNA #5 (si7B5, n = 8, 35.55 ± 6.09%) or GFP-MyH7B rescue construct (R, n = 8, 12.01 ± 1.95%); one-way ANOVA followed by Fisher's LSD test: **p < 0.01. Data are expressed as mean ± SEM. C, The dendritic spine head circularity index of the neurons shown in A was measured to determine the degree of irregularity of the dendritic spine heads for each group. Circularity index = 4 * π * (area/perimeter2). Left: Circularity index of dendritic spine heads of neurons expressing mCherry and control (C, n = 8, CI: 0.89 ± 0.001) or a pool of MyH7B siRNAs (si7B, n = 7, CI: 0.75 ± 0.015); Student's t test: **p < 0.01. Data are expressed as mean ± SEM. Right: To test whether the effect of MyH7B knock-down on dendritic spine heads could be rescued, neurons transfected with mCherry and control siRNA pool (C, n = 8, CI: 0.79 ± 0.01), MyH7B siRNA #5 (si7B5, n = 8, CI: 0.72 ± 0.017), or MyH7B siRNA #5 and rescue construct (R, n = 8, CI: 0.74 ± 0.22) were analyzed for dendritic spine head circularity index; ANOVA followed by Fisher LSD; **p < 0.01; N/S, not significant. Data are expressed as mean ± SEM. D, Frequency distribution, cumulative frequency, and circularity index plot for DIV 18 neurons cotransfected with mCherry and control siRNA pool (red) or MyH7B siRNA pool (blue). The frequency distribution was normalized to the total number of spines measured (control, n = 272 dendritic spines; siRNA MyH7B pool, n = 248 dendritic spines). Hartigan's dip test: control, p < 0.01, unimodal distribution; MyH7B, p > 0.05, multimodal distribution. E, Quantification of dendritic spine head area in DIV 18 hippocampal neurons cotransfected with mCherry and control siRNA pool (n = 8, 1.04 μm2 ± 0.04 μm2) or MyH7B siRNA pool (n = 8, 1.36 μm2 ± 0.05 μm2). Student's t test: **p < 0.01. Data are expressed as mean ± SEM. F, Quantification of dendritic spine length from neurons expressing control (n = 8, 1.49 ± 0.08 μm) or MyH7B siRNAs (n = 8, 1.54 ± 0.07 μm). Student's t test: N/S, not significant. Data are expressed as mean ± SEM. G, Quantification of number of protrusions (dendritic spines plus filopodia) per micrometer of dendrite of neurons cotransfected with mCherry and control siRNA (0.19 ± 0.04) or MyH7B siRNA pool (0.24 ± 0.05); Student's t test: *p < 0.05. Data are expressed as mean ± SEM. H, Representative images of DIV 18 neurons that were transfected with mCherry and either control siRNAs (top, n = 11) or MyH10 siRNAs (bottom, n = 12). Dendritic spines were classified into stubby, mushroom, or thin following the same parameters as in A. Arrowheads indicate filopodia-like protrusions extending from dendritic spine heads. Scale bar, 1 μm. I, Quantification of dendritic spines showing protrusions arising from the heads of neurons transfected with mCherry and control siRNAs (C, n = 11, 6.5 ± 1.12%) or MyH10 siRNA pool (si10, n = 12, 27.89 ± 2.38%). Student's t test: **p < 0.01. Data expressed as mean ± SEM. J, Circularity index of dendritic spine heads from neurons described in H. Control: CI: 0.9 ± 0.006, MyH10 siRNA: CI: 0.87 ± 0.01; Student's t test: **p < 0.01. Data are expressed as mean ± SEM. K, Frequency distribution, cumulative frequency, and circularity index plot for of dendritic spine heads of neurons transfected with control or MyH10 siRNAs. The frequency distribution was normalized to the total number of spines measured (control n = 833, siRNA MyH10, n = 752). Hartigan's dip test: control, p < 0.01 unimodal distribution; MyH10, p < 0.05, unimodal distribution. L, Quantification of dendritic spine head area in neurons described in H. Control: 0.85 μm2 ± 0.03 μm2; MyH10 siRNA pool: 0.89 μm2 ± 0.04 μm2); Student's t test: N/S, Not significant. Data are expressed as mean ± SEM. M, Quantification of dendritic spine length from neurons transfected with control (1.46 ± 0.005 μm) or MyH10 siRNAs (1.72 ± 0.005 μm); Student's t test: **p < 0.01. Data are expressed as mean ± SEM. N, Quantification of number of protrusions per micrometer of dendrite of neurons cotransfected with mCherry and control (0.69 ± 0.05) or MyH10 siRNA pool (0.52 ± 0.03); Student's t test: **p < 0.01. Data are expressed as mean ± SEM.
MyH7B and MyH10 have distinct and overlapping effects on spine morphology
MyH10 and MyH7B are structurally distinct motors, and each has a unique impact on synaptic strength (Fig. 3). Thus, it is reasonable to hypothesize that these motors might also mediate distinct aspects of spine morphology maintenance. To test this idea, we expressed a pool of control or MyH10-specific siRNAs in hippocampal neurons and quantified various parameters relating to spine morphology (Fig. 6H). Spines from these neurons exhibited irregularly shaped heads as shown by a significant increase in the percentage of dendritic spine heads showing protrusions (Fig. 6I) and a difference in the spine head CI (Fig. 6J). Although they exhibited a significant left shift of the cumulative frequency distribution curve (Fig. 6K), the circularity index range in the interquartile area was comparable to control (0.85 to 1 compared with 0.9 to 1 for control) and was not nearly as left shifted as spines from MyH7B siRNA-expressing neurons (Fig. 6D,K). In addition, population analysis of individual CIs revealed that spines with reduced MyH10 exhibited a unimodal distribution (Fig. 6K, Hartigan's dip test for control and MyH10 siRNA, p < 0.01), which was in stark contrast to the multimodal CI distribution of spines with reduced MyH7B. In addition, MyH10 siRNA-containing neurons had normal spine head area (Fig. 6L), a measure that was disrupted in MyH7B siRNA-expressing neurons. The differential effect of these two myosin II heavy chains in neurons was also apparent when we performed a morphometrical analysis of spines. Similar to what we found in neurons lacking MyH7B, MyH10 siRNA-expressing neurons showed an abundance of thin spines with a reduction of the number of stubby shaped ones compared with control (supplemental Fig. S7B). However, we observed a reduction in mushroom-shaped spines while the number of filopodia-like protrusions remained unaffected (supplemental Fig. S7B). We also found that, in accordance to previous studies (Ryu et al., 2006) and opposite to what we saw in MyH7B knock-down neurons (Fig. 6F), dendritic spines were longer than their control counterparts (Fig. 6M). However, they did also show an overall reduction of the protrusions density, comparable to neurons lacking MyH7B (Fig. 6N), demonstrating both distinct and overlapping functions relating to spine morphology.
Considering that MyH7B and MyH10 have both distinct and overlapping effects on synapse structure and function, we next wanted to test the idea that simultaneous knock-down of both isoforms would result in a drastic alteration in spine morphology. We imaged neurons expressing siRNAs targeting both MyH7B and MyH10, together with mCherry. Indeed, we found that when MyH10 and MyH7B were both disrupted in the same cells, dendritic spines were drastically altered (Fig. 7A). As expected, there was an increase in the number of dendritic spines with protrusions arising from their heads (Fig. 7B) accompanied by a significant decrease in the CI (Fig. 7C), where the population distribution showed a multimodal pattern similar to that of MyH7B siRNA-expressing neurons together with a shift to the left of the cumulative probability curve (Fig. 7D, Hartigan's dip test: control, p < 0.01; MyH7B, p < 0.01). Morphologically, disruption of both isoforms resulted in an increase in filopodia and thin spines with a concomitant decrease in mushroom and stubby spines (supplemental Fig. S7C). Altogether, thin spines and filopodia composed ∼70% of the protrusions, whereas in control neurons this number descended to ∼45%. Interestingly, spine head area did not change compared with control (Fig. 7E). Because the spine head area is calculated as a mean of all spines analyzed and this experiment showed a coexistence of narrow filopodia and wide irregular heads, the mean spine head area was not significantly altered. These neurons presented spines that became longer than controls (Fig. 7F) and had fewer protrusions than their control counterparts (Fig. 7G). Because knocking down both MyH7B and MyH10 simultaneously resulted in an additive effect on spine structure, these data suggest that these myosin II motors act in concert to regulate dendritic spine structure and function.
Figure 7.

MyH10 and MyH7B siRNAs show an additive effect on dendritic spine morphology. A, Representative images of DIV 18 neurons that were transfected with mCherry and either control siRNAs (top, n = 7) or MyH10 plus MyH7B siRNAs (bottom, n = 7). Dendritic spines were classified into stubby, mushroom, or thin following the same parameters as in Figure 7. Scale bar, 5 μm. B, Quantification of dendritic spines showing protrusions arising from the heads of neurons transfected with mCherry and control siRNAs (C, 7.68 ± 2.02%) or MyH7B plus MyH10 siRNAs (si7B + si10, 18.19 ± 3.33%); Student's t test: *p < 0.05. Data expressed as mean ± SEM. C, Circularity index of dendritic spine heads of neurons transfected with control (0.86 ± 0.02) or MyH7B plus MyH10 (0.75 ± 0.01) siRNAs. Student's t test: **p < 0.01. Data are expressed as mean ± SEM. D, Frequency distribution, cumulative frequency, and circularity index plot for of dendritic spine heads of neurons transfected with control or MyH7B plus MyH10 siRNAs. The frequency distribution was normalized to the total number of spines counted (control, n = 118; siRNA MyH7B, n = 75). Hartigan's dip test: Control, p < 0.05, unimodal distribution, MyH10, p > 0.05, multimodal distribution. E, Quantification of dendritic spine head area of neurons transfected with control (0.66 ± 0.04 μm2) or MyH7B plus MyH10 siRNAs (0.79 μm2 ± 0.09 μm2); Student's t test: N/S, not significant. Data are expressed as mean ± SEM. F, Quantification of dendritic spine length from neurons transfected with control (1.04 ± 0.04 μm) or MyH7B plus MyH10 siRNAs (2.09 ± 0.03 μm); Student's t test: **p < 0.01. Data are expressed as mean ± SEM. G, Quantification of number of protrusions per micrometer of dendrite of neurons cotransfected with mCherry and control (0.75 ± 0.09) or MyH7B and MyH10 siRNA pools (0.46 ± 0.06); Student's t test: *p < 0.05. Data are expressed as mean ± SEM.
Discussion
In this study, we report that a novel muscle-type myosin II heavy chain regulates synapse structure and function. Based on its unique motor domain, we hypothesized that MyH7B would have a distinct function relative to the known synapse regulator, MyH10. Indeed, we found specific structural and physiological differences between these two distinct myosin II motors expressed in neurons.
MyH7B, synaptic function and the actin cytoskeleton
Our data demonstrate that MyH7B is necessary for steady-state synaptic transmission in hippocampal neurons. Reducing the expression of MyH7B caused a selective decrease in mEPSC amplitude, while having no concomitant effect on mEPSC frequency, indicating that MyH7B regulates postsynaptic function. This effect observed on synaptic function is partly explained by a reduction in surface AMPA receptors located at synapses. Our electrophysiology results, combined with antibody labeling studies, indicate that MyH7B acts in the postsynapses to stabilize AMPA receptor clusters apposing neurotransmitter release sites. Future studies will determine whether the effects on neurotransmission are due to MyH7B regulation of traditional modes of AMPAR trafficking, such as endocytosis and exocytosis. Alternatively, MyH7B may have a more nuanced role in trafficking by regulating lateral diffusion of surface AMPARs that might influence receptor capture at synapses (Kessels and Malinow, 2009).
AMPAR trafficking and synaptic expression of AMPARs are both regulated by dynamic spine F-actin (Zhou et al., 2001; Yang et al., 2008; Renner et al., 2009; Rust et al., 2010). Thus, we hypothesized that MyH7B, which is an actin-based molecular motor, may stabilize steady-state synaptic transmission by linking the cytoskeleton to AMPARs. Our data support this model, as MyH7B knock-down by siRNAs occluded the effect of the actin-depolymerizing compound, latrunculin A. How might MyH7B, actin and AMPAR synaptic function be linked? High levels of latrunculin A completely remove F-actin from spines, and this effect results in dispersion of synaptic AMPARs (Allison et al., 1998). In addition, similar concentrations of this compound result in a rapid rundown of AMPAR currents (Kim and Lisman, 1999), and our data support these previous studies. More recently, Yang et al. (2008) demonstrated that the actin cytoskeleton controls transport of AMPARs from perisynaptic sites to the synapse proper, which is a necessary step in the full expression of LTP. Thus, AMPAR expression at synapses appears dependent on the integrity of multiple pools of neuronal actin. In our studies, we found that neurons with reduced levels of MyH7B had an altered spine F-actin distribution. These data, together with the occlusion of latrunculin A on mEPSC amplitudes, leads us to the conclusion that MyH7B regulates a pool of actin that stabilizes AMPARs at the postsynapse.
MyH7B and dendritic spine morphology
In addition to regulating AMPAR trafficking, F-actin dynamics also control dendritic spine morphology (Fisher et al., 1998). Our results show that overexpression of exogenous MyH7B did not modify the dendritic spine density nor their morphological classification, while siRNA knock-down of MyH7B resulted in a reduction of dendritic spine density and a shift in their classification. This effect is consistent with the idea that MyH7B regulates spine maintenance rather than controlling spinogenesis. Reducing MyH7B expression caused a subpopulation of spines to become large and irregular, with filopodia-like protrusions emerging from their heads. This abnormal spine phenotype is strikingly similar to morphological changes described after SPAR overexpression in a similar culture system (Pak et al., 2001). SPAR is a PSD-associated Rap-GAP that reorganizes the actin cytoskeleton and acts as a link between PSD-95 and F-actin. Interestingly, SynGAP1, which has been linked to mental retardation and autism spectrum disorders (Hamdan et al., 2009; Pinto et al., 2010), has potent Rap-GAP activity (Krapivinsky et al., 2004) arising from an interaction between its GAP and C2 domains (Pena et al., 2008). Manipulating SynGAP expression at excitatory synapses bidirectionally regulates AMPA receptor trafficking (Rumbaugh et al., 2006) and spine morphology (Vazquez et al., 2004). Spine defects caused by reducing SynGAP expression are likely due to actin dysregulation (Carlisle et al., 2008). Interestingly, we isolated a MyH7B fragment from rat brain using the C terminus of SynGAP1. Therefore, it is reasonable to speculate that MyH7B regulates synapse structure and function through a complex interaction with SynGAP1 and small GTPases. Perhaps MyH7B tethers SynGAP1 in close proximity to a critical pool of F-actin, thus enabling local GTPase regulation of the cytoskeleton. Future studies will be aimed at determining whether MyH7B and SynGAP interact at synapses to regulate dendritic spine structure and AMPAR function.
Similarity and differences between MyH7B and MyH10 in neurons
Myosin II motors control actin dynamics and growth structure morphology in nearly all cell types. In neuronal growth cones, for example, actin/myosin II interactions play a fundamental role in actin depolymerization. In these structures, myosin II acts as a “molecular scissor” such that it mechanically shears F-actin bundles, promoting their disassembly and subsequent depolymerization into G-actin (Medeiros et al., 2006). F-actin is the major cytoskeletal entity located at excitatory synapses (Fifkova and Delay, 1982). Thus, it is not surprising that reducing expression of MyH10 (Ryu et al., 2006) or MyH7B had such profound effects on synapse structure and function. What was unexpected, however, was that reducing expression of MyH7B had a distinct effect on spine morphology and synaptic function when compared with MyH10 siRNAs. Knocking down expression of MyH7B caused a large change in spine head area, no effect on spine length, and a selective effect on mEPSC amplitude. In contrast, reducing expression of MyH10 had no effect on spine head area and spine length was significantly increased, while both mEPSC amplitude and frequency were reduced. Based on these data, we hypothesize that MyH7B controls a pool of actin dynamics that operates primarily in the spine head, while MyH10 is especially important for regulating spine neck dynamics. The finding that spine shape and neck dimensions are independent from each other further supports this idea (supplemental Fig. S8, available at www.jneurosci.org as supplemental material). Recently, super-resolution microscopy of actin flow in spines revealed a highly branched and weakly polarized actin cytoskeleton (Tatavarty et al., 2009; Frost et al., 2010), suggesting that multiple pools of dynamic actin exist simultaneously in resting spines in addition to the recently characterized enlargement pool of actin that appears in response to synaptic stimulation (Honkura et al., 2008). Furthermore, electron microscopy methods that leave cytoskeletal elements intact revealed that spine necks and spine heads have distinct cytoskeletal organization (Korobova and Svitkina, 2010). Interestingly, this group also found a high concentration of myosin II within the neck and spine head base. Therefore, we present the idea that distinct myosin II motors at excitatory synapses enable selective control over spine subdomains.
Our data also demonstrate that reducing MyH7B expression in neurons disrupted the positive correlation between synapse size and synapse function (Matsuzaki et al., 2001). Knocking down MyH7B increases spine head area but reduces mEPSC amplitude and synaptic AMPAR expression. These data contrast with our results obtained after reducing MyH10 expression. In these experiments, spine head area was unchanged, but mEPSC amplitude and frequency were reduced. These unexpected results highlight the complex morphologies of spines that result from disturbing myosin II expression in neurons. In the case of MyH7B siRNAs, spine head area is increased because of the large numbers of filopodia emanating from many of the heads, which also causes extreme changes to the circularity of spines. Thus, it is possible that these filopodia emerging from spine heads may disrupt expression of synaptic AMPARs. Alternatively, distinct pools of actin may control spine head morphology and AMPAR synaptic expression. In support of this alternative, a cumulative probability distribution of individual mEPSC amplitudes revealed that nearly all functional synapses were affected by MyH7B knock-down. However, a cumulative probability distribution of circularity index measurement from individual spines revealed a multimodal distribution, with a discrete population of spines within a normal range of values. Thus, synapse structure and function appear differentially regulated by MyH7B knock-down. Future experiments that combine simultaneous structural and functional measurements at individual dendritic spines in neurons with targeted disruptions of myosin II motors will be necessary to resolve the specific roles of myosin II motors at synapses.
One of the main obstacles of the study of MyH7B is that expression of the endogenous protein is so low that it escapes detection by antibodies (Fig. 2). To overcome this limitation, we relied on the use of multiple MyH7B-specific siRNAs to study the functional role of this low-expressed protein. Indeed, we were able to rescue both functional and structural siRNA phenotypes by coexpression of a MyH7B cDNA. It was surprising that a protein with low expression had such profound effects on synapse structure and function. However, a specific DNA methyltransferase that maintains DNA CpG methylation in neurons escaped detection by immunoblotting (Feng et al., 2010). In that study, the authors were not able to detect DNMT3a protein, though they detected neuronal expression using RT-PCR. In addition, they confirmed that this protein had a function by using conditional knock-out mice. Thus, the Feng et al. (2010) study, along with our experiments, highlights the fact that low-expressing proteins, which fall below the detection threshold of antibodies, perform critical cellular functions. Combining modern genetic tools with sensitive structural and functional neuronal assays allows the systematic study of proteins with unusually low levels of expression.
In conclusion, our results demonstrate that divergent myosin II motors control unique aspects of synapse structure and function. Thus, understanding myosin II function at neurons will provide insight into the organization of synaptic actin dynamics and may contribute to the discovery of novel mechanisms governing steady-state and plastic neuronal mechanisms.
Footnotes
This work was supported by the Evelyn F. McKnight Brain Institute, The Scripps Research Institute, and National Institutes of Neurological Disorders and Stroke Grant R01 NS064079 (G.R.). We thank Drs. Courtney Miller, Thomas Creson, and Christopher Rex for their critical evaluation of this manuscript and Dr. Noriko Murakami for kindly providing us the eGFP:MyH10 plasmid.
References
- Allison DW, Gelfand VI, Spector I, Craig AM. Role of actin in anchoring postsynaptic receptors in cultured hippocampal neurons: differential attachment of NMDA versus AMPA receptors. J Neurosci. 1998;18:2423–2436. doi: 10.1523/JNEUROSCI.18-07-02423.1998. [DOI] [PMC free article] [PubMed] [Google Scholar]
- Amaral DG, Dent JA. Development of the mossy fibers of the dentate gyrus: I. A light and electron microscopic study of the mossy fibers and their expansions. J Comp Neurol. 1981;195:51–86. doi: 10.1002/cne.901950106. [DOI] [PubMed] [Google Scholar]
- Banke TG, Bowie D, Lee H, Huganir RL, Schousboe A, Traynelis SF. Control of GluR1 AMPA receptor function by cAMP-dependent protein kinase. J Neurosci. 2000;20:89–102. doi: 10.1523/JNEUROSCI.20-01-00089.2000. [DOI] [PMC free article] [PubMed] [Google Scholar]
- Carlisle HJ, Manzerra P, Marcora E, Kennedy MB. SynGAP regulates steady-state and activity-dependent phosphorylation of cofilin. J Neurosci. 2008;28:13673–13683. doi: 10.1523/JNEUROSCI.4695-08.2008. [DOI] [PMC free article] [PubMed] [Google Scholar]
- Cheng XT, Hayashi K, Shirao T. Non-muscle myosin IIB-like immunoreactivity is present at the drebrin-binding cytoskeleton in neurons. Neurosci Res. 2000;36:167–173. doi: 10.1016/s0168-0102(99)00123-6. [DOI] [PubMed] [Google Scholar]
- Desjardins PR, Burkman JM, Shrager JB, Allmond LA, Stedman HH. Evolutionary implications of three novel members of the human sarcomeric myosin heavy chain gene family. Mol Biol Evol. 2002;19:375–393. doi: 10.1093/oxfordjournals.molbev.a004093. [DOI] [PubMed] [Google Scholar]
- Feng J, Zhou Y, Campbell SL, Le T, Li E, Sweatt JD, Silva AJ, Fan G. Dnmt1 and Dnmt3a maintain DNA methylation and regulate synaptic function in adult forebrain neurons. Nat Neurosci. 2010;13:423–430. doi: 10.1038/nn.2514. [DOI] [PMC free article] [PubMed] [Google Scholar]
- Fifková E, Delay RJ. Cytoplasmic actin in neuronal processes as a possible mediator of synaptic plasticity. J Cell Biol. 1982;95:345–350. doi: 10.1083/jcb.95.1.345. [DOI] [PMC free article] [PubMed] [Google Scholar]
- Fischer A, Sananbenesi F, Schrick C, Spiess J, Radulovic J. Distinct roles of hippocampal de novo protein synthesis and actin rearrangement in extinction of contextual fear. J Neurosci. 2004;24:1962–1966. doi: 10.1523/JNEUROSCI.5112-03.2004. [DOI] [PMC free article] [PubMed] [Google Scholar]
- Fischer M, Kaech S, Knutti D, Matus A. Rapid actin-based plasticity in dendritic spines. Neuron. 1998;20:847–854. doi: 10.1016/s0896-6273(00)80467-5. [DOI] [PubMed] [Google Scholar]
- Frost NA, Shroff H, Kong H, Betzig E, Blanpied TA. Single-molecule discrimination of discrete perisynaptic and distributed sites of actin filament assembly within dendritic spines. Neuron. 2010;67:86–99. doi: 10.1016/j.neuron.2010.05.026. [DOI] [PMC free article] [PubMed] [Google Scholar]
- Fukazawa Y, Saitoh Y, Ozawa F, Ohta Y, Mizuno K, Inokuchi K. Hippocampal LTP is accompanied by enhanced F-actin content within the dendritic spine that is essential for late LTP maintenance in vivo. Neuron. 2003;38:447–460. doi: 10.1016/s0896-6273(03)00206-x. [DOI] [PubMed] [Google Scholar]
- Gray NW, Weimer RM, Bureau I, Svoboda K. Rapid redistribution of synaptic PSD-95 in the neocortex in vivo. PLoS Biol. 2006;4:e370. doi: 10.1371/journal.pbio.0040370. [DOI] [PMC free article] [PubMed] [Google Scholar]
- Hamdan FF, Gauthier J, Spiegelman D, Noreau A, Yang Y, Pellerin S, Dobrzeniecka S, Côté M, Perreau-Linck E, Perreault-Linck E, Carmant L, D'Anjou G, Fombonne E, Addington AM, Rapoport JL, Delisi LE, Krebs MO, Mouaffak F, Joober R, Mottron L, et al. Mutations in SYNGAP1 in autosomal nonsyndromic mental retardation. N Engl J Med. 2009;360:599–605. doi: 10.1056/NEJMoa0805392. [DOI] [PMC free article] [PubMed] [Google Scholar]
- Harris KM, Jensen FE, Tsao B. Three-dimensional structure of dendritic spines and synapses in rat hippocampus (CA1) at postnatal day 15 and adult ages: implications for the maturation of synaptic physiology and long-term potentiation. J Neurosci. 1992;12:2685–2705. doi: 10.1523/JNEUROSCI.12-07-02685.1992. [DOI] [PMC free article] [PubMed] [Google Scholar]
- Honkura N, Matsuzaki M, Noguchi J, Ellis-Davies GC, Kasai H. The subspine organization of actin fibers regulates the structure and plasticity of dendritic spines. Neuron. 2008;57:719–729. doi: 10.1016/j.neuron.2008.01.013. [DOI] [PubMed] [Google Scholar]
- Ishmael JE, Safic M, Amparan D, Vogel WK, Pham T, Marley K, Filtz TM, Maier CS. Nonmuscle myosins II-B and Va are components of detergent-resistant membrane skeletons derived from mouse forebrain. Brain Res. 2007;1143:46–59. doi: 10.1016/j.brainres.2007.01.061. [DOI] [PubMed] [Google Scholar]
- Johnson OL, Ouimet CC. A regulatory role for actin in dendritic spine proliferation. Brain Res. 2006;1113:1–9. doi: 10.1016/j.brainres.2006.06.116. [DOI] [PubMed] [Google Scholar]
- Kasai H, Fukuda M, Watanabe S, Hayashi-Takagi A, Noguchi J. Structural dynamics of dendritic spines in memory and cognition. Trends Neurosci. 2010;33:121–129. doi: 10.1016/j.tins.2010.01.001. [DOI] [PubMed] [Google Scholar]
- Kessels HW, Malinow R. Synaptic AMPA receptor plasticity and behavior. Neuron. 2009;61:340–350. doi: 10.1016/j.neuron.2009.01.015. [DOI] [PMC free article] [PubMed] [Google Scholar]
- Kim CH, Lisman JE. A role of actin filament in synaptic transmission and long-term potentiation. J Neurosci. 1999;19:4314–4324. doi: 10.1523/JNEUROSCI.19-11-04314.1999. [DOI] [PMC free article] [PubMed] [Google Scholar]
- Korobova F, Svitkina T. Molecular architecture of synaptic actin cytoskeleton in hippocampal neurons reveals a mechanism of dendritic spine morphogenesis. Mol Biol Cell. 2010;21:165–176. doi: 10.1091/mbc.E09-07-0596. [DOI] [PMC free article] [PubMed] [Google Scholar]
- Krapivinsky G, Medina I, Krapivinsky L, Gapon S, Clapham DE. SynGAP-MUPP1-CaMKII synaptic complexes regulate p38 MAP kinase activity and NMDA receptor-dependent synaptic AMPA receptor potentiation. Neuron. 2004;43:563–574. doi: 10.1016/j.neuron.2004.08.003. [DOI] [PubMed] [Google Scholar]
- Krucker T, Siggins GR, Halpain S. Dynamic actin filaments are required for stable long-term potentiation (LTP) in area CA1 of the hippocampus. Proc Natl Acad Sci U S A. 2000;97:6856–6861. doi: 10.1073/pnas.100139797. [DOI] [PMC free article] [PubMed] [Google Scholar]
- Lin B, Kramár EA, Bi X, Brucher FA, Gall CM, Lynch G. Theta stimulation polymerizes actin in dendritic spines of hippocampus. J Neurosci. 2005;25:2062–2069. doi: 10.1523/JNEUROSCI.4283-04.2005. [DOI] [PMC free article] [PubMed] [Google Scholar]
- Lin CH, Forscher P. Growth cone advance is inversely proportional to retrograde F-actin flow. Neuron. 1995;14:763–771. doi: 10.1016/0896-6273(95)90220-1. [DOI] [PubMed] [Google Scholar]
- Lynch G, Rex CS, Gall CM. LTP consolidation: substrates, explanatory power, and functional significance. Neuropharmacology. 2007;52:12–23. doi: 10.1016/j.neuropharm.2006.07.027. [DOI] [PubMed] [Google Scholar]
- Matsuzaki M, Ellis-Davies GC, Nemoto T, Miyashita Y, Iino M, Kasai H. Dendritic spine geometry is critical for AMPA receptor expression in hippocampal CA1 pyramidal neurons. Nat Neurosci. 2001;4:1086–1092. doi: 10.1038/nn736. [DOI] [PMC free article] [PubMed] [Google Scholar]
- Medeiros NA, Burnette DT, Forscher P. Myosin II functions in actin-bundle turnover in neuronal growth cones. Nat Cell Biol. 2006;8:215–226. doi: 10.1038/ncb1367. [DOI] [PubMed] [Google Scholar]
- Miyazaki T, Watanabe M, Yamagishi A, Takahashi M. B2 exon splicing of nonmuscle myosin heavy chain IIB is differently regulated in developing and adult rat brain. Neurosci Res. 2000;37:299–306. doi: 10.1016/s0168-0102(00)00130-9. [DOI] [PubMed] [Google Scholar]
- O'Brien RJ, Kamboj S, Ehlers MD, Rosen KR, Fischbach GD, Huganir RL. Activity-dependent modulation of synaptic AMPA receptor accumulation. Neuron. 1998;21:1067–1078. doi: 10.1016/s0896-6273(00)80624-8. [DOI] [PubMed] [Google Scholar]
- Okamoto K, Nagai T, Miyawaki A, Hayashi Y. Rapid and persistent modulation of actin dynamics regulates postsynaptic reorganization underlying bidirectional plasticity. Nat Neurosci. 2004;7:1104–1112. doi: 10.1038/nn1311. [DOI] [PubMed] [Google Scholar]
- Pak DT, Yang S, Rudolph-Correia S, Kim E, Sheng M. Regulation of dendritic spine morphology by SPAR, a PSD-95-associated RapGAP. Neuron. 2001;31:289–303. doi: 10.1016/s0896-6273(01)00355-5. [DOI] [PubMed] [Google Scholar]
- Pena V, Hothorn M, Eberth A, Kaschau N, Parret A, Gremer L, Bonneau F, Ahmadian MR, Scheffzek K. The C2 domain of SynGAP is essential for stimulation of the Rap GTPase reaction. EMBO Rep. 2008;9:350–355. doi: 10.1038/embor.2008.20. [DOI] [PMC free article] [PubMed] [Google Scholar]
- Pinto D, Pagnamenta AT, Klei L, Anney R, Merico D, Regan R, Conroy J, Magalhaes TR, Correia C, Abrahams BS, Almeida J, Bacchelli E, Bader GD, Bailey AJ, Baird G, Battaglia A, Berney T, Bolshakova N, Bölte S, Bolton PF, et al. Functional impact of global rare copy number variation in autism spectrum disorders. Nature. 2010;466:368–372. doi: 10.1038/nature09146. [DOI] [PMC free article] [PubMed] [Google Scholar]
- Renner M, Choquet D, Triller A. Control of the postsynaptic membrane viscosity. J Neurosci. 2009;29:2926–2937. doi: 10.1523/JNEUROSCI.4445-08.2009. [DOI] [PMC free article] [PubMed] [Google Scholar]
- Rex CS, Gavin CF, Rubio MD, Kramar EA, Chen LY, Jia Y, Huganir RL, Muzyczka N, Gall CM, Miller CA, Lynch G, Rumbaugh G. Myosin IIb regulates actin dynamics during synaptic plasticity and memory formation. Neuron. 2010;67:603–617. doi: 10.1016/j.neuron.2010.07.016. [DOI] [PMC free article] [PubMed] [Google Scholar]
- Rumbaugh G, Adams JP, Kim JH, Huganir RL. SynGAP regulates synaptic strength and mitogen-activated protein kinases in cultured neurons. Proc Natl Acad Sci U S A. 2006;103:4344–4351. doi: 10.1073/pnas.0600084103. [DOI] [PMC free article] [PubMed] [Google Scholar]
- Rust MB, Gurniak CB, Renner M, Vara H, Morando L, Görlich A, Sassoè-Pognetto M, Banchaabouchi MA, Giustetto M, Triller A, Choquet D, Witke W. Learning, AMPA receptor mobility and synaptic plasticity depend on n-cofilin-mediated actin dynamics. EMBO J. 2010;29:1889–1902. doi: 10.1038/emboj.2010.72. [DOI] [PMC free article] [PubMed] [Google Scholar]
- Ryu J, Liu L, Wong TP, Wu DC, Burette A, Weinberg R, Wang YT, Sheng M. A critical role for myosin IIb in dendritic spine morphology and synaptic function. Neuron. 2006;49:175–182. doi: 10.1016/j.neuron.2005.12.017. [DOI] [PubMed] [Google Scholar]
- Segal M. Dendritic spines and long-term plasticity. Nat Rev Neurosci. 2005;6:277–284. doi: 10.1038/nrn1649. [DOI] [PubMed] [Google Scholar]
- Star EN, Kwiatkowski DJ, Murthy VN. Rapid turnover of actin in dendritic spines and its regulation by activity. Nat Neurosci. 2002;5:239–246. doi: 10.1038/nn811. [DOI] [PubMed] [Google Scholar]
- Tatavarty V, Kim EJ, Rodionov V, Yu J. Investigating sub-spine actin dynamics in rat hippocampal neurons with super-resolution optical imaging. PLoS One. 2009;4:e7724. doi: 10.1371/journal.pone.0007724. [DOI] [PMC free article] [PubMed] [Google Scholar]
- Turrigiano GG, Leslie KR, Desai NS, Rutherford LC, Nelson SB. Activity-dependent scaling of quantal amplitude in neocortical neurons. Nature. 1998;391:892–896. doi: 10.1038/36103. [DOI] [PubMed] [Google Scholar]
- Vallee RB, Seale GE, Tsai JW. Emerging roles for myosin II and cytoplasmic dynein in migrating neurons and growth cones. Trends Cell Biol. 2009;19:347–355. doi: 10.1016/j.tcb.2009.03.009. [DOI] [PMC free article] [PubMed] [Google Scholar]
- Vazquez LE, Chen HJ, Sokolova I, Knuesel I, Kennedy MB. SynGAP regulates spine formation. J Neurosci. 2004;24:8862–8872. doi: 10.1523/JNEUROSCI.3213-04.2004. [DOI] [PMC free article] [PubMed] [Google Scholar]
- Vicente-Manzanares M, Ma X, Adelstein RS, Horwitz AR. Non-muscle myosin II takes centre stage in cell adhesion and migration. Nat Rev Mol Cell Biol. 2009;10:778–790. doi: 10.1038/nrm2786. [DOI] [PMC free article] [PubMed] [Google Scholar]
- Wendel B, Reinhard R, Wachtendorf U, Zacharzowsky UB, Osterziel KJ, Schulte HD, Haase H, Hoehe MR, Morano I. The human beta-myosin heavy chain gene: sequence diversity and functional characteristics of the protein. J Cell Biochem. 2000;79:566–575. [PubMed] [Google Scholar]
- Yang Y, Wang XB, Frerking M, Zhou Q. Delivery of AMPA receptors to perisynaptic sites precedes the full expression of long-term potentiation. Proc Natl Acad Sci U S A. 2008;105:11388–11393. doi: 10.1073/pnas.0802978105. [DOI] [PMC free article] [PubMed] [Google Scholar]
- Zhang H, Webb DJ, Asmussen H, Niu S, Horwitz AF. A GIT1/PIX/Rac/PAK signaling module regulates spine morphogenesis and synapse formation through MLC. J Neurosci. 2005;25:3379–3388. doi: 10.1523/JNEUROSCI.3553-04.2005. [DOI] [PMC free article] [PubMed] [Google Scholar]
- Zhou Q, Xiao M, Nicoll RA. Contribution of cytoskeleton to the internalization of AMPA receptors. Proc Natl Acad Sci U S A. 2001;98:1261–1266. doi: 10.1073/pnas.031573798. [DOI] [PMC free article] [PubMed] [Google Scholar]
- Zito K, Knott G, Shepherd GM, Shenolikar S, Svoboda K. Induction of spine growth and synapse formation by regulation of the spine actin cytoskeleton. Neuron. 2004;44:321–334. doi: 10.1016/j.neuron.2004.09.022. [DOI] [PubMed] [Google Scholar]