Abstract
Mitochondrial dysfunctions contribute to neurodegeneration, the locations of which vary among neurodegenerative diseases. To begin to understand what mechanisms may underlie higher vulnerability of the spinal cord motor neurons in amyotrophic lateral sclerosis, compared with brain mitochondria, we studied three major functions of rat brain mitochondria (BM) and spinal cord mitochondria (SCM) mitochondria: oxidative phosphorylation, Ca2+ sequestration, and production of reactive oxygen species (ROS), using a new metabolic paradigm (Panov et al., J. Biol. Chem. 284: 14448–14456, 2009). We present data that SCM share some unique metabolic properties of the BM. However, SCM also have several distinctions from the BM: 1) With the exception of succinate, SCM show significantly lower rates of respiration with all substrates studied; 2) immunoblotting analysis showed that this may be due to 30–40% lower contents of respiratory enzymes and porin; 3) compared with BM, SCM sequestered 40–50% less Ca2+, and the total tissue calcium content was 8 times higher in the spinal cord; 4) normalization for mitochondria from 1 g of tissue showed that BM can sequester several times more Ca2+ than was available in the brain tissue, whereas SCM had the capacity to sequester only 10–20% of the total tissue Ca2+; and 5) with succinate and succinate-containing substrate mixtures, SCM showed significantly higher state 4 respiration than BM and generated more ROS associated with the reverse electron transport. We conclude that SCM have an intrinsically higher risk of oxidative damage and overload with calcium than BM, and thus spinal cord may be more vulnerable under some pathologic conditions. (250)
Keywords: oxidative phosphorylation, permeability transition, reactive oxygen species
mitochondrial dysfunctions play important roles in pathogenesis of degenerative diseases of the central nervous system (4, 14). Although many neurodegenerative diseases are systemic, such as Huntington's disease (15), amyotrophic lateral sclerosis (ALS) (2), and Friedrich's ataxia (8), neurodegeneration predominantly occurs at specific locations within the central nervous system in each of these diseases. An important question in neurodegenerative diseases is what determines localization of neuronal death? There is evidence that, during systemic intoxication with rotenone, or in transgenic mice bearing mutated human G93A SOD1 gene, the pathological changes occur in brain and spinal cord mitochondria, but not in liver mitochondria (10, 32). It was also shown that various brain regions differ in their sensitivity to the deleterious effects of oxygen deprivation (22, 41). Thus, differences in the tissue-specific and regional properties of mitochondria may contribute to selectivity of neurodegeneration.
Regarding ALS, one of the major questions is, “Why are motor neurons in the spinal cord more vulnerable than neurons in brain?” Because mitochondrial dysfunctions play important roles in pathogenesis of ALS (2, 24), the above question can be restated as, “What features make spinal cord mitochondria (SCM) more predisposed to become dysfunctional compared with the brain mitochondria (BM)?” Recent studies have shown significant structural differences between BM or SCM of the wild-type and transgenic animals expressing mutant human SOD1 gene (24, 39). Heretofore, few papers have addressed functional and metabolic differences between BM and SCM from normal animals. It was shown that compared with BM, SCM have significantly lower respiratory activity (11, 46) and a decreased Ca2+ threshold for induction of the mitochondrial permeability transition (mPT) registered as mitochondrial swelling (45). Mitochondrial swelling, however, is an intrinsically qualitative phenomenon, which is not always reliable when studying mPT of BM (31). Kirkinezos et al. (18) observed a significant decrease in the activity of complex IV in BM and SCM from transgenic G93A-SOD1 mice, presumably associated with increased peroxidation of mitochondrial lipids. However, the mechanisms involved in generation of reactive oxygen species (ROS) in SCM remain largely unknown. It was one of the purposes of this work to study and compare ROS production in SCM and BM from Taconic Sprague-Dawley rats, which serve as a wild-type control for G93A-SOD1 transgenic rats.
Mitochondria are at the junction of several major metabolic pathways. In the case of neuronal mitochondria, of particular importance are metabolic interactions among amino acid neuromediators and carbohydrates (3, 5, 51). During neuronal activity, mitochondria located in postsynaptic neurons may be concurrently exposed to increased levels of lactate, which is converted to pyruvate (34, 37), and the postsynaptically transported glutamate (6, 30). Succinate can be also formed during postsynaptic catabolism of GABA (47). Yudkoff et al. (52) showed that synaptosomal mitochondria oxidize glutamate and pyruvate simultaneously. We have found recently that BM possess unique metabolic features: during simultaneous oxidation of pyruvate + glutamate in the presence of malate, the rate of oxidative phosphorylation almost doubled, and ROS production in state 4 increased several-fold (34).
In this paper, we studied and compared in more detail various functions of the BM and SCM, based on the newly discovered metabolic features of neuronal mitochondria (34). Our goal was to find answers to the following questions: 1) Do SCM have similar or different metabolic characteristics as BM? 2) What features may make SCM more predisposed to become dysfunctional in ALS compared with BM?
We show that SCM have qualitatively the same metabolic features as BM, but significantly lower capacity to produce ATP and support the energy-dependent sequestration of calcium. At the same time, SCM may generate significantly more ROS. We found that spinal cord tissue has 8 times higher content of total calcium compared with the brain tissue. Taken together, the data presented suggest that, compared with BM, SCM have a higher risk of undergoing oxidative stress and the Ca2+-induced mitochondrial permeability transition, which induce apoptotic or necrotic death of neurons.
Materials and Methods
Animals.
Male 2-mo-old Taconic Sprague-Dawley [TAC:N:(SD)-TqN] rats were used for isolation of the spinal cord and brain mitochondria. The protocol was approved by the Institutional Animal Care and Use Committee of Carolinas Medical Center. The animals were housed and cared for in American Association for Accreditation of Laboratory Animal Care-accredited facilities at the Carolinas Medical Center. All experiments involving animals were performed in strict accordance with the National Institutes of Health's Guide for the Care and Use of Laboratory Animals.
Isolation of mitochondria.
Nonsynaptic mitochondria were isolated from pooled forebrains and spinal cord tissue of 3 or 4 animals. Spinal columns (from cervical to lumbar segments) were quickly excised from the bodies and placed in a beaker filled with slurry of liquid and frozen isolation medium. In a cold room, the spinal cord tissue was extracted by opening the spinal column with scissors. Both spinal cord (SCM) and BM were isolated in a medium that contained 75 mM mannitol, 175 mM sucrose, 20 mM MOPS, pH 7.2, 1 mM EGTA. We used a modified method of Sims (40) to isolate and purify BM and SCM, as described previously (31, 32). The homogenization procedure involved 20–25 strokes with a loose-fitting pestle in the Dounce 40-ml glass homogenizer (Wheaton Scientific). On average, the yields of the mitochondrial protein were 1.42 ± 0.07 mg/g wet tissue for the brain tissue and 0.72 ± 0.04 mg/g wet tissue for the spinal cord. Mitochondrial protein was determined using the Pierce Coomassie protein assay reagent kit.
Registration of mitochondrial respiration.
Respiration of the mitochondria was measured as described previously (31, 32). The following incubation medium (Medium A) was used (in mM): 125 KCl, 10 MOPS (pH 7.2), 2 MgCl2, 2 KH2PO4, 10 NaCl, 1 EGTA, and 0.7 CaCl2. The substrate concentrations were (in mM) 5 succinate without rotenone, 5 glutamate, 2.5 pyruvate, 2 malate, and 10 ascorbate plus 0.3 tetramethyl-phosphonium diacetate (TMPD). Oxidative phosphorylation (state 3) was initiated by addition of 150 μM ADP. The uncoupled respiration (state 3U) was stimulated by titration with cyanide-m-chlorophenylhydrazone (CCCP) until the maximum rate of oxygen consumption was obtained.
Immunodetection of mitochondrial respiratory complexes and porin.
Levels of respiratory chain complexes I, II, III, IV and V, located in the inner membrane and porin, located in the outer membrane, were determined in mitochondrial lysates by SDS-PAGE followed by immunoblotting using the following primary antibodies: OXPHOS complexes detection kit MS601 (Mitoscience), and mouse monoclonal [20B12] to VDAC1/porin (ab14734; Abcam). The lanes of the 12.5% gel were loaded with a 20 μl volume of a mixture of Laemmli buffer (10 μl) and 10 μg mitochondrial protein in 10 μl RIPA lysis buffer, and run at 80 V for 3 h; proteins were then transferred to nitrocellulose membranes and blocked with 5% (wt/vol) nonfat milk/PBS Tween 20 for 1 h at room temperature. Membranes were incubated overnight at 4°C with primary antibodies directed against OXPHOS complexes or porin. After washing membranes with nonfat milk/PBS Tween 20 3 times, membranes were incubated with goat-anti-mouse-IgG-HRP sc2302 (Santa Cruz Biotechnology) for 1 h at room temperature. Western blots were developed using chemiluminescent detection with chemiluminescent substrate (#34080; Pierce) and quantified by scanning densitometry with Fujifilm Science Imaging system LAS 3000. Quantitative analysis was performed using software Multi Gauge-V3.0. Relative protein contents in SCM were normalized against corresponding bands for BM on each gel.
Tests for the purity of isolated brain and spinal cord mitochondria.
Isolated BM and SCM were checked for possible contamination with peroxisomes and lysosomes by immunoblotting with peroxisomal and lysosomal marker antibodies using the same techniques, as described for respiratory complexes. The following primary antibodies were used: peroxisome marker rabbit polyclonal to catalase (Ab1877; Abcam); peroxisomal membrane protein, PMP70 (NBP-1-2071, Novus Biologicals); lysosome-associated membrane protein (Ab71489; Santa Cruz Biotechnology). As a positive control, we used the liver homogenate fraction between 10,000 and 15,000 g, which contained a mixture of light mitochondria, lysosomes, and peroxisomes. Because catalase was also present in the heavy and middle fractions of liver mitochondria, we used antibodies for additional peroxisomal marker PMP70.
Electron microscopy of isolated brain and spinal cord mitochondria.
BM and SCM were isolated as described above. The final pellet was resuspended in Karnovsky's fixative, spun down at 15,000 g for 5 min and left for 24 h at 4°C. Samples were infiltrated with 1% aqueous osmium tetroxide in a BioWave Pro microwave (Ted Pella). Samples were then dehydrated in a graded series of ethanol in the BioWave Pro. The pellet was centrifuged at 7,650 rpm for 1 min. Samples were embedded in Spurr resin in a 70°C conventional oven. Ultra-thin sections on copper grids were stained with 2% uranyl acetate and Sato's lead citrate. Sections were analyzed with a Philips CM-10 Transmission Electron Microscope operated at 60 kV. Digital images were captured with a digital camera system from 4 pi Analysis. All reagents were from Electron Microscopy Sciences.
Registration of permeability transition and estimation of calcium retention capacity.
Calcium retention capacity (CRC) is the amount of calcium that can be sequestered by mitochondria until the permeability transition occurs (31). It is expressed as nanomoles of Ca2+ per milligram of mitochondrial protein. Ca2+ was added to mitochondrial suspensions (0.3 mg mitochondrial protein/ml) using 5- to 10-μl aliquots of 5-, 10-, or 20-mM stock solutions of CaCl2 to achieve final Ca2+ concentrations of 25, 50, or 100 nmol/ml. We utilized CaCl2 of very high purity −99.99% from Sigma.
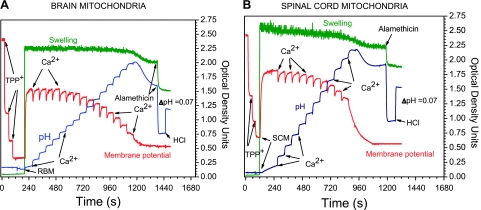
Three different methods were used to estimate CRC and permeability transition, which have been thoroughly described (31, 34). In brief, the mitochondrial CRC and swelling were estimated in a medium containing (in mM) 125 KCl, 10 NaCl, 0.5 MgCl2, 3 glycyl-glycine (pH 7.2), 1 KH2PO4, and 5 glutamate + 2.5 pyruvate + 2 malate, volume 1 ml (31). The addition at the end of an experiment of 125 nmol/ml H+ (as HCl) caused a ΔpH of 0.07 pH units and served as an internal calibration. This allowed a comparison of the total pH changes and calculation of the H+/Ca2+ ratios. For this, the buffer capacity (B) was calculated from known ΔpH and added H+ (125 nmol/ml), according to formula B = ΔH+/ΔpH, and then ΔH+ for the known quantity of added Ca2+ estimated. Other details are described in Fig. 6. Similarly, additions of TPP+ at increments of 0.5 μM (final concentration 2 μM) served as an internal calibration for membrane potential changes.
Fig. 6.
Changes in membrane potential and medium pH during titration with calcium of rat brain and spinal cord mitochondria. A: brain mitochondria. B: spinal cord mitochondria. Incubation conditions and composition of medium B are described in materials and methods. Oligomycin (2 μg/ml) and ADP (50 μM) (final concentration) were added before mitochondria (0.3 mg/ml). First addition of TPP+ was 1 nm/ml, and the other two additions were 0.5 nm/ml each. The final TPP+ concentration was 2.0 nm/ml, Ca2+ 100 nmol/ml; and alamethicin, 4 μg/ml; HCl 125 nmol/ml caused a ΔpH of 0.07.
Measurements of the total tissue calcium content.
Whole brain and whole spinal cord tissues were removed, cleaned from visible blood vessels, frozen in liquid nitrogen, and stored at −70°C prior to ashing. At ashing, the tissue samples were placed in tared fused silica crucibles, weighed and dried to constant weight at 110°C, and then ashed in a muffle oven at 650°C for 24 h. The ash was then dissolved in 1 ml concentrated HCl, diluted and assayed for calcium content using a Perkin Elmer 3100 model atomic absorption spectrometer. Two blank crucibles and a minimum three nonzero calcium atomic absorption standards from EM Science (Gibbstown, NJ) were included in each assay.
Measurements of hydrogen peroxide generation.
H2O2 was determined using the Amplex red (Molecular Probes) method, as described previously (32–34). We measured H2O2 production in the presence of 5 μM Amplex red, 3 units of horseradish peroxidase, 50 units of superoxide dismutase (Sigma), and 0.05 mg mitochondria. The incubation was performed in the same medium as for registration of mitochondrial respiration. The following substrates and their mixtures were used (in mM): 5 glutamate, 2.5 pyruvate, 2 malate, and 5 succinate. The total volume was 1 ml. In separate experiments, we determined that with both BM and SCM, the rates of ROS generation were not increased by the addition of 50 or 100 units of superoxide dismutase (Sigma), even at the highest rates in the presence of succinate and antimycin A. The additions of 50 nM (final concentration) of resorufin or correspondingly diluted standard 3 mM solution of H2O2 (Fluka) were used for calibration of the fluorescence scale. Fluorimetric measurements were made using a fluorometer from C & L Instruments (www.fluorescence.com).
Data acquisition.
Data acquisition was performed using hardware and software from C & L Instruments.
Chemicals.
Sucrose, mannitol, and other chemicals, which were obtained from Sigma, were of molecular biology grade. All solutions were prepared using twice glass-distilled water.
Statistics.
Initial inspection showed that results were normally distributed. Therefore, parametric statistical procedures were used. Data are presented as means ± SE of 4–6 separate experiments. Comparisons between two groups were made by unpaired t-test; P values < 0.05 were considered significant.
RESULTS
Respiratory activities of the spinal cord and brain mitochondria.
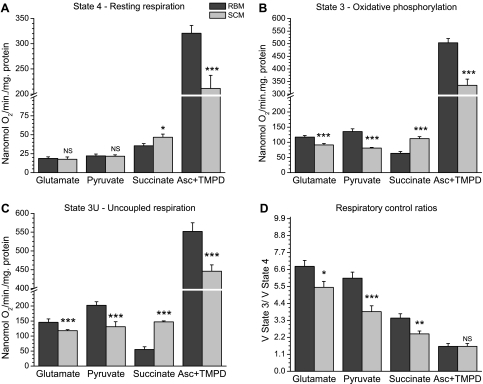
Recently, we have provided evidence that intrinsic inhibition of succinate dehydrogenase (SDH) is a natural mechanism to prevent excessive production of ROS associated with the reverse electron transport (34, 35). Because defatted BSA effectively abolished this inhibition (35), we isolated BM and SCM in the absence of BSA. Respiratory activities of the BM and SCM mitochondria were first studied using various substrates added separately to evaluate different parts of the respiratory chain. The major finding was that compared with BM, SCM showed significantly (P < 0.001) lower specific rates of respiration (per milligram of mitochondrial protein) during oxidative phosphorylation (state 3) and uncoupled respiration (state 3U) with glutamate, pyruvate, and ascorbate + TMPD. In resting metabolic state (state 4) oxidation of ascorbate + TMPD by SCM was also significantly lower compared with the BM (Fig. 1A). At the same time, SCM oxidized succinate at significantly (P < 0.001) higher rates in all metabolic states (Fig. 1, A–C). These results suggest that intrinsic inhibition of SDH in BM was stronger than in SCM.
Fig. 1.
Respiratory activities of brain and spinal cord mitochondria in different metabolic states. A: state 4—resting respiration. B: state 3—oxidative phosphorylation. C: state 3U—uncoupled respiration. D: respiratory control ratios (VState3/VState 4). Incubation conditions: composition of the medium A is described in materials and methods. Chamber volume 550 μl, temperature 25°C. Substrates: glutamate 5 mM + malate 2 mM, pyruvate 2.5 mM + malate 2 mM, succinate 5 mM, ascorbate 5 mM + tetramethyl-phosphonium diacetate (TMPD) 0.3 mM. Additions: mitochondrial protein, 0.3 mg; ADP, 150 μM; cyanide-m-chlorophenylhydrazone (CCCP), 0.4 μM. Results are shown as means ± SE. *P < 0.1; **P < 0.05; ***P < 0.001. NS denotes the absence of statistically significant difference. The data for the spinal cord mitochondria were compared with the corresponding column representing brain mitochondria.
Figure 1D shows that respiratory control ratios (VState 3/VState 4) with different substrates in SCM were significantly (P < 0.01) lower compared with BM. The lower respiratory control ratios in SCM resulted from lower rates of oxidative phosphorylation (state 3).
Because in situ mitochondria may encounter more than one respiratory substrate (34), we studied effects of physiological substrate mixtures on respiratory activities of BM and SCM.
Effects of substrate mixtures on respiratory activity of BM and SCM.
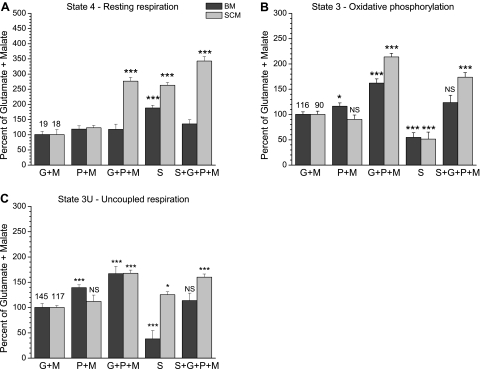
Figure 2 shows respiratory activities of BM and SCM exposed to various combinations of respiratory substrates. We have shown recently that, with exception of glutamate + malate, during oxidation of pyruvate + malate and other substrate mixtures by BM, a significant part of the state 4 respiration and associated ROS generation were sensitive to inhibition by malonate, suggesting that succinate was generated during oxidation of pyruvate and other substrate mixtures (34). Therefore, the data were normalized to respiration rates with glutamate + malate taken as 100% and thus served as a background in the absence of succinate. Resting respiration rates (state 4) with glutamate + malate and pyruvate + malate were the same for the BM and SCM. In the presence of glutamate + pyruvate + malate, which is a physiological substrate mixture in activated neurons (34), the state 4 respiration in BM was at the control level, while in SCM, it was several-fold higher. With succinate alone, the state 4 respiration of BM was 190% and that of SCM 260% compared with glutamate + malate. With succinate + pyruvate + glutamate + malate, the state 4 respiration in BM was at the same level as with glutamate + malate but was several times higher in the SCM.
Fig. 2.
Comparison of respiratory activities of the brain and spinal cord mitochondria oxidizing various substrates and their mixtures. A: state 4—resting respiration. B: state 3—oxidative phosphorylation. C: state 3U—uncoupled respiration. Incubation conditions as in Fig. 1. Designations: G + M, glutamate + malate; P + M, pyruvate + malate; G + P + M, glutamate + pyruvate + malate; S, succinate; S + G + P + M, succinate + glutamate + pyruvate + malate. The numbers at the columns with G + M indicate the average respiratory rates in nanomoles O2 per minute per milligram protein for the brain and spinal cord mitochondria. *P < 0.1; ***P < 0.001. To facilitate comparisons, all data were compared with the first column representing glutamate + malate, taken as 100%.
When compared with glutamate + malate, the rate of oxidative phosphorylation (state 3) with pyruvate + malate was 15% higher (P < 0.05) in BM but not different in SCM (Fig. 2B). With glutamate + pyruvate + malate, the state 3 respiration rates were 160% for the BM and 210% for the SCM (P < 0.001) (Fig. 2B). The state 3 succinate oxidation rates in BM and SCM were correspondingly 54% and 51% (P < 0.001) of the control level. When BM and SCM oxidized succinate in the presence of glutamate + pyruvate + malate, the rates of oxidative phosphorylation increased correspondingly to 120% (not significant) and 174% (P < 0.001) over the level with glutamate + malate, and were more than two- and three-fold higher when compared with succinate alone (Fig. 2B).
Oxidation of pyruvate + malate uncoupled with CCCP increased to 140% (P < 0.001) in BM, but not in SCM, compared with glutamate + malate (Fig. 2C). With pyruvate + glutamate + malate, the state 3U respiration in both BM and SCM increased to 170% (P < 0.001) over the control level with glutamate + malate. The initial rate of succinate oxidation by uncoupled BM was inhibited by 62% (P < 0.001) and the inhibition rapidly increased, whereas oxidation of succinate by uncoupled SCM was 125% (P < 0.05) relative to glutamate + malate (Fig. 2C). With uncoupled BM and SCM oxidizing succinate + pyruvate + glutamate + malate, the respiration rates were correspondingly 110% (not significant) and 160% (P < 0.001).
Analysis of respiratory complexes of the spinal cord and brain mitochondria.
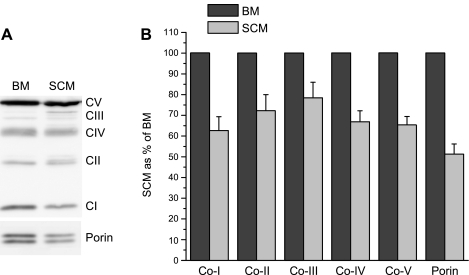
To establish whether the lower rates of respiration with SCM were caused by lower contents of respiratory enzymes, we estimated the relative contents of mitochondrial respiratory chain complexes by immunoblots. Figure 3A shows a typical Western blot of BM and SCM from rats with antibodies against OXPHOS complexes I, II, III IV, and V, which are components of the inner membrane, and porin, a protein of the outer membrane. Figure 3B shows relative contents of the complexes and porin in SCM normalized against BM in six separate isolations. The results obtained show that compared with BM, SCM contained 20% to 40% less respiratory complexes I, II, III and IV, complex V, and porin.
Fig. 3.
Western blots of the brain and spinal cord mitochondrial proteins with antibodies against OXPHOS complexes and porin. Technical details are described in materials and methods. A: image of representative SDS-PAGE gel. B: relative amounts of the respiratory complexes and porin in the spinal cord mitochondria normalized to brain mitochondria. Results are shown as means ± SE (n = 5) with quantitation of band intensities of Western blots, as described in materials and methods.
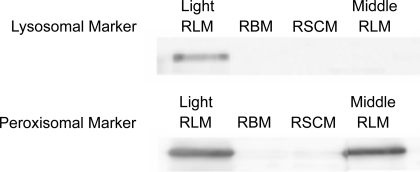
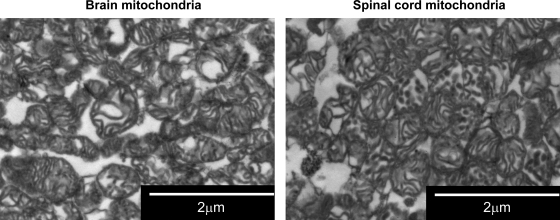
To ensure that the above differences between BM and SCM in the contents of respiratory complexes and porin were not caused by contamination with other subcellular fractions, for example, peroxisomes or lysosomes, we conducted additional tests on the purity of the isolated mitochondria. Figure 4 shows Western blots of the BM, SCM, and liver mitochondria (LM), which contained organelles that were sedimented between 2,000 and 8,000 g. As a positive control, we used organelles from rat liver homogenate that were sedimented between 10,000 and 15,000 g, which contained a mixture of light mitochondria, lysosomes, and peroxisomes. Fig. 4 shows that BM, SCM, and LM contained no detectable membrane-associated markers for lysosomes or peroxisomes. However, LM, which are known to contain catalase (17), showed a strong band for catalase, which was absent in BM, SCM (Fig. 4), and heart mitochondria (not shown). Regarding possible contamination with microsomal fraction, it should be kept in mind that in the brain, most of the cytochrome P-450 activities are associated with neuronal mitochondria, whereas microsomes have negligible activity in metabolizing xenobiotics (51). Figure 5 shows digital electron micrographs of the BM and SCM pellets, as routinely isolated, at magnification ×10,500. One can see that BM and SCM purified with a Percoll gradient have similar appearance with clear visible cristae, although some mitochondria look swollen. Both preparations contain some amount of membranous vesicles. Because we have excluded contamination with lysosomes and peroxisomes, it is more likely that those vesicles are remnants of cytoplasmic membranes. Myelin consists of 80% lipids and 20% proteins; therefore, a purification step with Percoll gradient eliminates the possibility of contamination of the final mitochondrial fraction with myelin (21). Figure 5 also shows that there were no apparent contaminants resembling myelin in the pellets of BM and SCM. In general, preparations of SCM did not contain more nonmitochondrial contaminants that would cause lower respiratory activity compared with those in the BM.
Fig. 4.
Western blots of brain, spinal cord, and liver mitochondria with the marker antibodies against lysosomes and peroxisomes. Liver homogenate light fraction (LHLF) was used as a positive control. RLM, rat liver mitochondria. See materials and methods for the details.
Fig. 5.
Digital electron micrographs of isolated brain and spinal cord mitochondrial pellets. Magnification: ×10,500. The figures shows that both rat brain mitochondria (BM) and spinal cord mitochondria (SCM) are not swollen, and in both pellets, a small amount of membranous vesicles is present. The pellet of SCM does not contain any other cellular components that would cause lower specific mitochondrial protein content.
Mitochondrial permeability transition in the rat spinal cord and brain mitochondria.
Figure 6 shows changes in the medium pH, membrane potential, and optical density at 620 nm, as a measure of mitochondrial swelling, during titrations with calcium of BM (Fig. 6A) and SCM (Fig. 6B) oxidizing glutamate + pyruvate + malate in the presence of 50 μM ADP and 5 μM oligomycin. SCM required much less Ca2+ for initiation of the mPT, which was accompanied by a sharp depolarization and alkalization of the medium due to release of Ca2+ and Pi. The optical density of BM did not change during Ca2+ titration, and upon opening of the mitochondrial permeability transition pore (mPTP), the amplitude of swelling was small (Fig. 6A). SCM began to swell slowly even before addition of Ca2+. The rate of swelling slightly increased upon mPT, but the total amplitude of swelling before addition of alamethicin was also small (Fig. 6B). Alamethicin, a bacterial protein, forms a large-sized pore in the membranes, and it is used for determination of the maximal amplitude of the mitochondrial swelling. The disadvantage of the swelling measurement is that this method lacks quantitative characteristics of calcium phosphate (CaPi) sequestration.
Measuring membrane potential during Ca2+ loads is a quantitative method; however, under certain conditions, even complete depolarization does not prove opening of the mPTP (31). Figure 6 shows that membrane potential begins to decline long before opening of the pore. This is likely associated not with an actual loss of mitochondrial energization, but more likely with partial transition of ΔΨ to ΔpH because sequestration of CaPi requires high pH in matrix (9, 31). However, a rapid fall of the membrane potential usually occurs before opening of mPTP registered by the pH method (Fig. 6, see also Ref. 31).
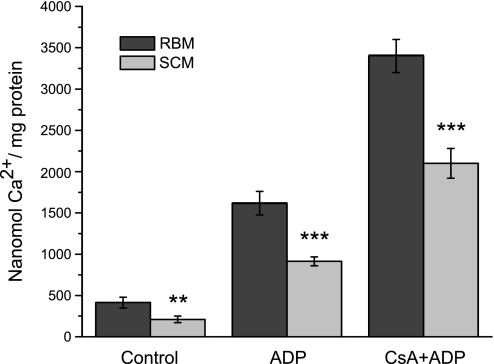
Measurements of the medium's pH changes during CaPi sequestration is the most reliable quantitative method for the estimation of the CRC of the mitochondria. Opening of the mPTP is registered as a beginning of the medium's alkalization (Fig. 6). CRC provides a quantitative estimate of the amount of Ca2+ that can be sequestered by the mitochondria from different tissues and species (31, 33). The calcium retention capacity values for the SCM and BM incubated under various conditions are summarized in Fig. 7. SCM, unprotected and protected with ADP + oligomycin or cyclosporine A (CsA) + ADP + oligomycin, sequestered correspondingly 50%, 45%, and 37% (P < 0.001) less CaPi than BM. The estimated values for the H+/Ca2+ ratios were correspondingly 0.68 ± 0.02 and 0.74 ± 0.02 for unprotected SCM and BM, and in the presence of ADP + oligomycin, the H+/Ca2+ ratios were correspondingly 0.85 ± 0.02 and 0.98 ± 0.03 (P < 0.01).
Fig. 7.
Calcium retention capacities of rat brain and spinal cord mitochondria. Solid bars denote brain mitochondria; gray bars denote spinal cord mitochondria. Incubation conditions as in Fig. 6. Control comprises unprotected mitochondria oxidizing substrates; ADP comprises mitochondria protected by oligomycin 2 μg/ml + ADP 50 μM; CsA + ADP comprises mitochondria protected by cyclosporin A (0.5 μM + oligomycin 2 μg/ml + ADP 50 μM). Data are M ± standard error calculated from 3–4 separate isolations of mitochondria. Data are expressed as nanomoles Ca2+ per milligram mitochondrial protein. Statistics: **P < 0.05; ***P < 0.001. The data for the spinal cord mitochondria were compared with the corresponding data representing brain mitochondria.
Total calcium content in the brain and spinal cord tissues.
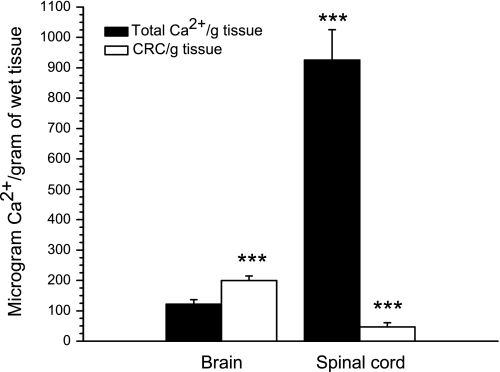
The calcium retention capacity values for the SCM and BM presented in Fig. 7 are expressed as nanomoles of Ca2+ per 1 mg of mitochondrial protein. But how do these values reflect the potentiality of the mPTP opening, and relate to the total calcium content in the tissue? Figure 8 shows the total calcium contents in the forebrain and spinal cord tissues as micrograms of Ca2+ per gram of wet tissue. Similarly, we normalized the calcium retention capacity for mitochondria that were isolated from 1 g of the tissue, also as micrograms of Ca2+ per gram of wet tissue. The results presented are for the BM and SCM incubated in the presence of ADP + oligomycin. Figure 8 shows that the total tissue Ca2+ content in spinal cord was 8 times higher than in the brain and also that the amounts of Ca2+ that could be sequestered by BM were several-fold larger than the total Ca2+ content in the brain. In contrast, SCM could sequester only about 10–20% of the total tissue Ca2+.
Fig. 8.
The brain and spinal cord tissue total Ca2+ contents and the calcium retention capacity of mitochondria isolated from 1 g of the tissue. Data are expressed as microgram Ca2+ per 1 g of wet tissue. Solid bars denote total tissue Ca2+ content; light bars denote mitochondrial calcium retention capacity in the presence oligomycin 2 μg/ml + ADP 50 μM. The data for the spinal cord mitochondria were compared with the corresponding data representing brain mitochondria, and mitochondrial CRC was compared with the corresponding total tissue calcium. ***P < 0.001.
Generation of ROS by the spinal cord and brain mitochondria oxidizing various substrates.
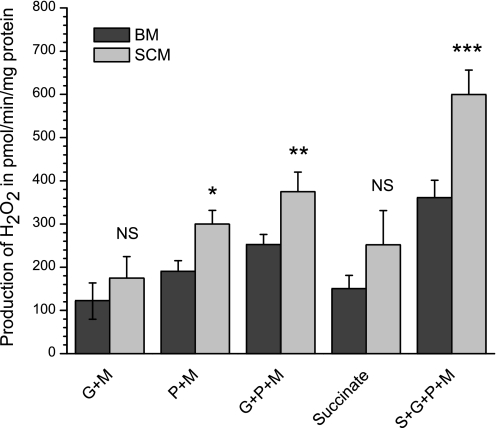
We have shown recently that, during oxidation of pyruvate + malate or glutamate + pyruvate + malate, a significant proportion of ROS generation by BM was associated with the succinate-driven reverse electron transport (34). These effects were specific for mitochondria from brain and were not observed with mitochondria from the rat heart, liver (34), or skeletal muscle (28). In this work, we compared ROS generation by BM and SCM oxidizing various substrates. Figure 9 summarizes the results of experiments of six separate isolations of the mitochondria.
Fig. 9.
Generation of H2O2 by rat brain and spinal cord mitochondria with different substrates and substrate mixtures. Mitochondria were incubated as described in materials and methods. Total volume: 1 ml. The results are presented as means ± SE (n = 6) and show the rates of ROS production as picomoles H2O2 per minute per milligram mitochondrial protein. Additions: 5 μM Amplex red; 3 units of horse radish peroxidase; 50 units of superoxide dismutase (Sigma); 0.05 mg mitochondria; glutamate 5 mM + malate 2 mM (G + M); pyruvate 2.5 mM + malate 2 mM (P + M); glutamate 5 mM + pyruvate 2.5 mM + malate 2 mM (G + P + M); succinate 5 mM + glutamate 5 mM + pyruvate 2.5 mM + malate 2 mM (S + G + P + M). *P < 0.1; **P < 0.05; ***P < 0.001. The data for SCM were compared with the corresponding results for BM.
One can see that ROS generation by SCM qualitatively changed in a similar way as with BM in response to different substrates. However, quantitatively, SCM generated significantly more ROS with pyruvate + malate, glutamate + pyruvate + malate, and succinate + glutamate + pyruvate + malate. As we have shown earlier (34), these are conditions that activate the succinate-dependent reverse electron transport, which was inhibited by malonate (not shown). Thus, under the same metabolic conditions, SCM may produce more ROS than BM.
DISCUSSION
There is strong evidence that during neuronal activation, postsynaptic mitochondria are exposed to increased levels of pyruvate and glutamate (6, 36), and simultaneous oxidation of pyruvate and glutamate may significantly increase the rates of ATP synthesis and the state 4 generation of ROS. This metabolic feature was specific only for the BM (34). The data presented in this paper demonstrate that SCM have responses to the above substrate mixtures similar to those of BM. However, BM and SCM also have important distinctions in their major functions.
Metabolic differences between spinal cord and brain mitochondria.
Figure 1 shows that with exception of succinate, SCM have 30–40% lower respiratory activities in metabolic state 3 and state 3U. This indicates that SCM in general might have lower capacity to produce ATP. This is in a good agreement with the results presented earlier by Dave et al. (11) and Sullivan et al. (46). The results of the Western blots (see Fig. 3) suggest that lower respiratory activity of SCM was more likely associated with the lower contents of the enzyme complexes responsible for electron transport and ATP synthesis. The proportionally lower content of porin in SCM suggests that BM and SCM may have systemic differences in the amounts of enzymatic ensembles involved in OXPHOS reactions and contacts between the inner and outer membranes. Recently, Forner et al. (12) presented a quantitative proteomic comparison of rat mitochondria from muscle, heart, and liver. The authors concluded that about 40% of the 689 proteins identified can be associated with one tissue either because of a tissue-unique expression or because of differential expression. Thus, substantial differences in mitochondrial proteins and functions in various tissues reflect close correlations between the tissue's and mitochondrial functions.
However, Fig. 2 shows that when BM and SCM oxidize physiologically relevant substrate mixtures, which produce significant amounts of succinate (34), the increases in respiratory rates are relatively higher with SCM. This may somewhat compensate for the lower contents of respiratory enzymes in ATP production. BM have a unique metabolic feature to increase respiratory activities in all metabolic states during simultaneous oxidation of glutamate + pyruvate + malate. This substrate mixture corresponds to the metabolic condition in neurons activated by glutamate, when part of glutamate is transported from the synaptic cleft to the postsynaptic neuron, whereas astroglia supplies increased amounts of lactate (34). The activation of respiration with glutamate + pyruvate + malate was bound with formation of succinate within tricarboxylic citric acid cycle, and thus was sensitive to inhibition by malonate, an inhibitor of SDH.
We have shown recently that isolation of BM in the presence of defatted BSA may result in higher activity of succinate dehydrogenase (SDH) as a result of binding oxaloacetate, which is a powerful inhibitor of SDH (35). In the absence of BSA, mitochondria preserve the intrinsic inhibition of SDH by oxaloacetate, which is an inherent mechanism to prevent excessive oxidative stress associated with reverse electron transport (33–35). In BM and SCM isolated in the presence of BSA, the rates of succinate oxidation in all metabolic states are lower by 40% compared with SCM (unpublished observation; see also Ref. 35). We have reported earlier (34), that BSA-BM from Taconic Sprague-Dawley rats spontaneously develop inhibition of succinate oxidation 1–2 h after isolation, whereas in BSA-SCM, the activity of SDH remained unchanged. All of these facts suggest that the higher respiratory rates in SCM with succinate could be explained by lower intrinsic inhibition of SDH.
Relationships between respiration and the mitochondrial calcium retention capacity.
There is strong evidence that the Ca2+-induced mPT is one of the major mechanisms that induce apoptosis (19, 38). The amounts of CaPi that mitochondria can sequester before opening the permeability transition pore strongly depend on mitochondrial respiratory activity, which is reflected in the H+/Ca2+ ratio (9, 31). Even small differences in the H+/Ca2+ ratios may result in large dissimilarities in the mitochondrial capacity to sequester CaPi (31, 33). Our results showed lower H+/Ca2+ ratios for SCM compared with the BM (see Fig. 6). Correspondingly, the CRC values for the SCM were significantly lower (P < 0.001) than those for the BM (Fig. 7). Recently, Morota et al. (27) have found that SCM can retain considerably less calcium administered as continuous infusion rather than additions of Ca2+ aliquots used in this study. Besides respiratory activity, the ability of mitochondria to prevent opening of the permeability transition pore may strongly depend on the tissue and mitochondrial content of adenine nucleotides (13).
Brain and spinal cord mitochondria require additional insults to induce mPT.
Of the total Ca2+ content in parenchymal tissues, only a small fraction exists in a free form, and normal concentrations of [Ca2+]Free are below 1 μM (42, 43). Figure 8 shows that CRC of the nonsynaptic BM, isolated from 1 g of tissue, exceeded the total Ca2+ content in the tissue at least twofold. This makes it unlikely that Ca2+-induced permeability transition and, hence, the excitotoxic cell deaths occur in the brain in the absence of additional pathogenic factors. Support for the glutamate-induced Ca2+-excitotoxic cell death hypothesis comes mainly from experiments with cultured neurons (reviewed in Refs. 29 and 38). Cell culture media usually contain at least 0.5 mM of Ca2+ (http://www.sigmaaldrich.com/etc/medialib/docs/Sigma/Formulation/d5546for.Par.0001.File.tmp/d5546for.pdf.), which is more than enough to cause mPT followed by the excitotoxic cell death.
Figure 8 shows that the total Ca2+ content in the spinal cord tissue was 8 times higher than in the brain. When normalized for 1 g of the tissue, SCM could sequester only 10–20% of the total Ca2+ available in the spinal cord. We do not know where most of tissue Ca2+ is located in the spinal cord, but high tissue calcium raises a possibility that during injury, ample amounts of Ca2+ can be released to cause opening of mPTP. Halestrap et al. (16) suggested that opening of mPTP initiated by Ca2+ usually triggers necrotic cell death. Martin et al. (23) observed that degeneration of motor neurons seen in SOD1 mice more closely resembled a prolonged necrotic-like cell death.
Control of ROS generation in brain and spinal cord mitochondria.
Cellular protective mechanisms against ROS are represented by the cytoplasmic and mitochondrial enzymatic and metabolic antioxidant defenses, which vary from tissue to tissue (25). Although mutations in the cytosolic Cu-ZnSOD superoxide dismutase (SOD1) result in development of ALS, complete loss of SOD1 activity was not lethal for the animals (26). In contrast, knockout mice deficient in the mitochondrial Mn-dependent isoform SOD (SOD2) died within the first week of life (26, 50). This indicates an exceptional toxicity of superoxide radical (O2•−) generated in mitochondria (25). Increased production of O2•− in the first instance damages the enzymes containing 4Fe-4S clusters, such as complex I, complex II (31), and aconitase (7). Our experiments suggest that both BM and SCM possess high activities of SOD2 because additions of external SOD did not influence production of H2O2 registered by Amplex red method.
During direct electron transport from NADH, oxidation of FMNH2 of complex I is the rate-limiting step (20); therefore, the downstream potential sites of ROS production are oxidized. However, if complex I was reduced by the reverse electron transport, which occurs during succinate oxidation, or in the presence of complex I substrate + rotenone, the rate of O2•− production in BM increases many fold (33, 34). Thus, the succinate-driven reverse electron transport may be an important cause of oxidative stress in BM (34). Besides, complex II, by itself, can be both the source and the target of O2•− (32). However, in some recent reviews on the mitochondrial mechanisms of ROS generation, the role of complex II was understated (1, 45).
Figure 9 shows that under the same metabolic conditions, SCM may generate significantly more ROS than BM with all substrates and substrate mixtures. Thus SCM may be intrinsically more predisposed to oxidative stress.
Conclusions.
BM and SCM share the metabolic property to increase respiratory activity and ROS production during simultaneous oxidation of glutamate + pyruvate + malate. This metabolic feature was not observed with mitochondria from other tissues (34). However, there are also important distinctions between mitochondrial properties of these two tissues. These differences include the following: SCM have lower rates of oxidative phosphorylation, presumably due to lower contents of respiratory complexes; SCM have lower capacity to accumulate Ca2+, even when supported by oxidation of glutamate +pyruvate + malate; and SCM generate more ROS than BM with all substrates used in this study.
Importantly, the tissue total calcium content in the spinal cord is eight times higher than in the brain. It is likely that the combination of these features in the SCM may lead, under pathological conditions, to a higher propensity of the spinal cord motor neurons to undergo oxidative stress, and Ca2+-induced apoptotic or necrotic cell death. We speculate that these differences play an important role in accounting for how and why neurons of the spinal cord are chiefly affected in ALS. Further studies to test this speculation are in progress.
GRANTS
The authors thank the Carolinas HealthCare Foundation and Carolinas ALS Research Fund for financial support of this study. Part of this project was supported by a grant from the National Institutes of Health (DK RO1 38825) to H. L. Bonkovsky, as well as a grant from the Russian Foundation for the Basic Research N 09-04-01376.
DISCLOSURES
No conflicts of interest, financial or otherwise, are declared by the authors.
ACKNOWLEDGMENTS
The authors thank Mr. Joey Armstrong, III, for technical assistance.
REFERENCES
- 1. Andreev AYu, Kushnareva YuE, Starkov AA. Mitochondrial metabolism of reactive oxygen species. Biochemistry (Moscow) 70: 200–224, 2005 [DOI] [PubMed] [Google Scholar]
- 2. Bacman SR, Bradley WG, Moraes CT. Mitochondrial involvement in amyotrophic lateral sclerosis: Trigger or target? Mol Neurobiol 33: 113–131, 2006 [DOI] [PubMed] [Google Scholar]
- 3. Balazs R. Control of glutamate metabolism. The effect of pyruvate. J Neurochem 12: 63–76, 1965 [DOI] [PubMed] [Google Scholar]
- 4. Beal MF. Energetics in the pathogenesis of neurodegenerative diseases. Trends Neurosci 23: 298–304, 2000 [DOI] [PubMed] [Google Scholar]
- 5. Berkich DA, Ola MS, Cole J, Sweatt AJ, Hutson SM, LaNoue KF. Mitochondrial transport proteins of the brain. J Neurosci Res 85: 3367–3677, 2007 [DOI] [PubMed] [Google Scholar]
- 6. Brasnjo G, Otis TS. Isolation of glutamate transport-coupled charge flux and estimation of glutamate uptake at the climbing fiber-purkinje cell synapse. Proc Natl Acad Sci USA 101: 6273–6278, 2004 [DOI] [PMC free article] [PubMed] [Google Scholar]
- 7. Bulteau AL, Ikeda-Saito M, Szweda LI. Redox-dependent modulation of aconitase activity in intact mitochondria. Biochemistry 42: 14846–14855, 2003 [DOI] [PubMed] [Google Scholar]
- 8. Calabrese V, Lodi R, Tonon C, D'Agata V, Sapienza M, Scapagnini G, Mangiameli A, Pennisi G, Stella AM, Butterfield DA. Oxidative stress, mitochondrial dysfunction and cellular stress response in Friedreich's ataxia. J Neurol Sci 233: 145–162, 2005 [DOI] [PubMed] [Google Scholar]
- 9. Chalmers S, Nicholls DG. The relationship between free and total calcium concentrations in the matrix of liver and brain mitochondria. J Bio Chem 278: 19062–19070, 2003 [DOI] [PubMed] [Google Scholar]
- 10. Damiano M, Starkov AA, Petri S, Kipiani K, Kiaei M, Mattiazzi M, Flint Beal M, Manfredi G. Neural mitochondrial Ca capacity impairment precedes the onset of motor symptoms in G93A Cu/Zn-superoxide dismutase mutant mice. J Neurochem 96: 1349–1361, 2006 [DOI] [PubMed] [Google Scholar]
- 11. Dave KR, Bradley WG, Perez-Pinzon MA. Early mitochondrial dysfunction occurs in motor cortex and spinal cord at the onset of disease in the Wobbler mouse. Exp Neurol 182: 412–420, 2003 [DOI] [PubMed] [Google Scholar]
- 12. Forner F, Foster LJ, Campanaro S, Valle G, Mann M. Quantitative proteomic comparison of rat mitochondria from muscle, heart, and liver. Mol Cell Proteomics 5: 608–619, 2006 [DOI] [PubMed] [Google Scholar]
- 13. Friberg H, Connern C, Halestrap AP, Wieloch T. Differences in the activation of the mitochondrial permeability transition among brain regions in the rat correlate with selective vulnerability. J Neurochem 72: 2488–2497, 1999 [DOI] [PubMed] [Google Scholar]
- 14. Greenamyre JT, Sherer TB, Betarbet R, Panov AV. Complex I and Parkinson's disease. IUBM Life 52: 135–141, 2001 [DOI] [PubMed] [Google Scholar]
- 15. Gusella JF, Macdonald ME. Huntington's disease: seeing the pathogenic process through a genetic lens. Trends Biochem Sci 31: 533–540, 2006 [DOI] [PubMed] [Google Scholar]
- 16. Halestrap AP, Doran E, Gillespie JP, O'Toole A. Mitochondria and cell death. Biochem Soc Trans 28:170–177, 2000 [DOI] [PubMed] [Google Scholar]
- 17. Higashi T, Peters T., Jr Studies on Rat Liver Catalase. II. Incorporation of 14-C-leucine into catalase of liver cell fractions in vivo. J Biol Chem 238: 3952–3954, 1963 [PubMed] [Google Scholar]
- 18. Kirkinezos IG, Bacman SR, Hernandez D, Oca-Cossio J, Arias LJ, Perez-Pinzon MA, Bradley WG, Moraes CT. Cytochrome c association with the inner mitochondrial membrane is impaired in the CNS of G93A-SOD1 mice. J Neurosci 25: 164–172, 2005 [DOI] [PMC free article] [PubMed] [Google Scholar]
- 19. Krieger C, Duchen MR. Mitochondria, Ca2+ and neurodegenerative disease. Eur J Pharmacol 447: 177–188, 2002 [DOI] [PubMed] [Google Scholar]
- 20. Kussmaul L, Hirst J. The mechanism of superoxide production by NADH:ubiquinone oxidoreductase (complex I) from bovine heart mitochondria. Proc Natl Acad Sci USA 103: 7607–7612, 2006 [DOI] [PMC free article] [PubMed] [Google Scholar]
- 21. Larocca JN, Norton WT. Isolation of myelin. Curr Protoc Cell Biol Chapter 3: Unit 3.25, 2007 [DOI] [PubMed] [Google Scholar]
- 22. Martin LJ, Al-Abdulla NA, Brambrink AM, Kirsch JR, Portera-Cailliau C. Neurodegeneration in excitotoxicity, global cerebral ischemia, and target deprivation: a perspective on the contributions of apoptosis and necrosis. Brain Res Bull 46: 281–309, 1998 [DOI] [PubMed] [Google Scholar]
- 23. Martin LJ, Liu Z, Chen K, Price AC, Pan Y, Swaby JA, Golden WC. Motor neuron degeneration in amyotrophic lateral sclerosis mutant superoxide dismutase-1 transgenic mice: mechanisms of mitochondriopathy and cell death. J Comp Neurol 500: 20–46, 2007 [DOI] [PubMed] [Google Scholar]
- 24. Martin LJ, Gertz B, Pan Y, Price AC, Molkentin JD, Chang Q. The mitochondrial permeability transition pore in motor neurons: Involvement in the pathobiology of ALS mice. Exp Neurol 218: 333–346, 2009 [DOI] [PMC free article] [PubMed] [Google Scholar]
- 25. Melov S. Mitochondrial oxidative stress. Physiologic consequences and potential for a role in aging. Ann NY Acad Sci 908: 219–225, 2000 [DOI] [PubMed] [Google Scholar]
- 26. Melov S. Therapeutics against mitochondrial oxidative stress in animal models of aging. Ann NY Acad Sci 959: 330–340, 2002 [DOI] [PubMed] [Google Scholar]
- 27. Morota S, Hansson MJ, Ishii N, Kudo Y, Elmer E, Uchino H. Spinal cord mitochondria display lower calcium retention capacity compared with brain mitochondria without inherent differences in sensitivity to cyclophilin D inhibition. J Neurochem 103: 2066–2076, 2007 [DOI] [PubMed] [Google Scholar]
- 28. Muller FL, Liu Y, Abdul-Ghani MA, Lustgarten MS, Bhattacharya A, Jang YC, Van Remmen H. High rates of superoxide production in skeletal-muscle mitochondria respiring on both complex I- and complex II-linked substrates. Biochem J 409: 491–499, 2008 [DOI] [PubMed] [Google Scholar]
- 29. Nicholls DG. Mitochondrial dysfunction and glutamate excitotoxicity studied in primary neuronal cultures. Curr Mol Med 4: 149–177, 2004 [DOI] [PubMed] [Google Scholar]
- 30. Otis TS, Kavanaugh MP, Jahr CE. Postsynaptic glutamate transport at the climbing Fiber-Purkinje cell synapse. Science 277: 1515–1518, 1997 [DOI] [PubMed] [Google Scholar]
- 31. Panov A, Andreeva L, Greenamyre JT. Quantitative evaluation of the effects of mitochondrial permeability transition pore modifiers on accumulation of calcium phosphate: Two modes of action of mPTP modifiers. Arch Biochem Biophys 424: 44–52, 2004 [DOI] [PubMed] [Google Scholar]
- 32. Panov A, Dikalov S, Shalbueva N, Taylor G, Sherer T, Greenamyre JT. Rotenone model of Parkinson's disease: Multiple brain mitochondria dysfunctions after short-term systemic rotenone intoxication. J Biol Chem 280: 42026–42035, 2005 [DOI] [PubMed] [Google Scholar]
- 33. Panov A, Dikalov S, Shalbuyeva N, Hemendinger R, Greenamyre JT, Rosenfeld J. Species and tissue specific relationships between mitochondrial permeability transition and generation of ROS in brain and liver mitochondria of rats and mice. Am J Physiol Cell Physiol 292: C708–C718, 2007 [DOI] [PubMed] [Google Scholar]
- 34. Panov A, Schonfeld P, Dikalov S, Hemendinger R, Bonkovsky HL, Brooks BR. The neuromediator glutamate, through specific substrate interactions, enhances mitochondrial ATP production and reactive oxygen species generation in nonsynaptic brain mitochondria. J Biol Chem 284: 14448–14456, 2009 [DOI] [PMC free article] [PubMed] [Google Scholar]
- 35. Panov AV, Vavilin VA, Lyalkhovich VV, Brooks BR, Bonkovsky HL. Effects of defatted bovine serum albumin on respiratory activities of brain and liver mitochondria from C57Bl/6G mice and Sprague Dawley rats. Bull Exp Biol Med 149: 187–190, 2010 [DOI] [PubMed] [Google Scholar]
- 36. Pellerin L, Magistretti PJ. Glutamate uptake into astrocytes stimulates aerobic glycolysis: a mechanism coupling neuronal activity to glucose utilization. Proc Natl Acad Sci USA 91: 10625–1062, 1994 [DOI] [PMC free article] [PubMed] [Google Scholar]
- 37. Pellerin L, Bouzier-Sore Serres Aubert A, Serres S, Merle M, Costalat R, Magistretti PJ. Activity-dependent regulation of energy metabolism by astrocytes: an update. Glia 55: 1251–1262, 2007 [DOI] [PubMed] [Google Scholar]
- 38. Reynolds IJ. Mitochondrial membrane potential and the permeability transition in excitotoxicity. Ann NY Acad Sci 893: 33–41, 1999 [DOI] [PubMed] [Google Scholar]
- 39. Sasaki S, Aoki M, Nagai M, Kobayashi M, Itoyama Y. Mitochondrial alterations in transgenic mice with an H46R mutant Cu/Zn superoxide dismutase gene. J Neuropathol Exp Neurol 68: 365–373, 2009 [DOI] [PubMed] [Google Scholar]
- 40. Sims NR. Rapid isolation of metabolically active mitochondria from rat brain and subregions using Percoll density gradient centrifugation. J Neurochem 55: 698–707, 1990 [DOI] [PubMed] [Google Scholar]
- 41. Smith ML, Auer RN, Siesjo BK. The density and distribution of ischemic brain injury in the rat following 2–10 min ischemia in the rat. Acta Neuropathol (Berl) 64: 319–332, 1984 [DOI] [PubMed] [Google Scholar]
- 42. Somlyo AP, Somlyo AV. Electron probe analysis of calcium content, and movements in sarcoplasmic reticulum, mitochondria and cytoplasm. J Cardiovasc Pharmacol 8: S42–S47, 1986 [DOI] [PubMed] [Google Scholar]
- 43. Somlyo AP, Bond M, Somlyo AV. Calcium content of mitochondria and endoplasmic reticulum in liver frozen rapidly in vivo. Nature 314: 622–625, 1985 [DOI] [PubMed] [Google Scholar]
- 44. Starkov AA, Fiskum G, Chinopoulos C, Lorenzo BJ, Browne SE, Patel MS, Beal MF. Mitochondrial alpha-ketoglutarate dehydrogenase complex generates reactive oxygen species. J Neurosci 24: 7779–7788, 2004 [DOI] [PMC free article] [PubMed] [Google Scholar]
- 45. Starkov AA. The role of mitochondria in reactive oxygen species metabolism and signaling. Ann NY Acad Sci 1147: 37–52, 2008 [DOI] [PMC free article] [PubMed] [Google Scholar]
- 46. Sullivan PG, Rabchevsky AG, Keller JYN, Lovell M, Sodhi A, Hart RP, Scheffer SW. Intrinsic differences in brain and spinal cord mitochondria: implication for therapeutic interventions. J Comp Neurol 474: 524–534, 2004 [DOI] [PubMed] [Google Scholar]
- 47. Tillakaratne NJ, Medina-Kauwe L, Gibson KM. Gamma-aminobutyric acid (GABA) metabolism in mammalian neural and nonneural tissues. Comp Biochem Physiol A Physiol 112: 247–263, 1995 [DOI] [PubMed] [Google Scholar]
- 48. Tretter L, Adam-Vizi V. Generation of reactive oxygen species in the reaction catalyzed by alpha-ketoglutarate dehydrogenase. J Neurosci 24: 7771–7778, 2004 [DOI] [PMC free article] [PubMed] [Google Scholar]
- 49. Turlejski K, Djavadian R. Life-long stability of neurons: a century of research on neurogenesis, neuronal death and neuron quantification in adult CNS. Prog Brain Res 136: 39–65, 2002 [DOI] [PubMed] [Google Scholar]
- 50. Turner BJ, Parkinson NJ, Davies KE, Talbot K. Survival motor neuron deficiency enhances progression in an amyotrophic lateral sclerosis mouse model. Neurobiol Dis 34: 511–517, 2009 [DOI] [PubMed] [Google Scholar]
- 51. Walther B, Ghersi-Egea JF, Minn A, Seist G. Subcellular distribution of cytochrome P450 in the brain. Brain Res 375: 338–344, 1986 [DOI] [PubMed] [Google Scholar]
- 52. Yudkoff M, Nelson D, Daikhin Y, Erecinska M. Tricarboxylic acid cycle in rat brain synaptosomes. Fluxes and interactions with aspartate aminotransferase and malate/aspartate shuttle. J Biol Chem 269: 27414–27420, 1994 [PubMed] [Google Scholar]
- 53. Zundorf G, Kahlert S, Bunik VI, Reiser K. α-Ketoglutarate dehydrogenase contributes to production of reactive oxygen species in glutamate-stimulated hippocampal neurons in situ. Neuroscience 158: 610–616, 2009 [DOI] [PubMed] [Google Scholar]


