Abstract
The importance of hypoxia-inducible factor (HIF) in promoting angiogenesis and vasculogenesis during wound healing has been demonstrated. It is widely accepted that HIF activity can be promoted by many factors, including hypoxia in the wound or cytokines from inflammatory cells infiltrating the wound. However, there has not been a systematic exploration of the relationship between HIF activity and hypoxia in the burn wound. The location of the hypoxic tissue has not been clearly delineated. The time course of the appearance of hypoxia and the increased activity of HIF and appearance of HIF’s downstream transcription products has not been described. The aim of this study was to utilize pimonidazole, a specific tissue hypoxia marker, to characterize the spatial and temporal course of hypoxia in a murine burn model and correlate this with the appearance of HIF-1α and its important angiogenic and vasculogenic transcription products VEGF and SDF-1. Hypoxia was found in the healing margin of burn wounds beginning at 48 hours after burn and peaking at day 3 after burn. On sequential sections of the same tissue block, positive staining of HIF-1α, SDF-1, and VEGF all occurred at the leading margin of the healing area and peaked at day 3, as did hypoxia. Immunohistochemical analysis was used to explore the characteristics of the hypoxic region of the wound. The localization of hypoxia was found to be related to cell growth and migration, but not to proliferation or inflammatory infiltration.
Keywords: ypoxia, Hypoxia-inducible factor -10α, Burn, Wound Healing, Ki67 Cell Proliferation, Keratin17
INTRODUCTION
The possibility that hypoxia has an important role in orchestrating wound healing was introduced based on physiologic evidence as early as the 1960s. (1) Hunt proposed that oxygen could be important in wound healing through unknown mechanisms. (2) Early studies assessed tissue hypoxia using a probe electrode to directly measure the equilibrated average pO2 from wound fluid. (3) This approach assessed the oxygen tension in the whole wound area, but it did not give detailed localization of the hypoxic region.
Pimonidazole, or RO-03-8799, is a second generation misonidazole analogue. (4) Through irreversible binding to thiol groups on amino acids at pO2 less than 10mm Hg, pimonidazole can be used as a histological marker for tissue hypoxia, including the identification of hypoxic regions within the wound bed. Immunohistochemistry (IHC) targeting the amino-thiol sites is used to precisely detect the localization of hypoxia in the wound area, and samples can be taken at distinct intervals to document changes over time.
Despite the commercial availability of pimonidazole as a hypoxia marker, no report of its use in burn wound has been documented. It has been used to assess skin flap wounds, where ischemia was found to increase incrementally along the flap. (5) It has also been used to study the role of hypoxia in dermal excisional wounds. (6,7,8) These studies concluded that hypoxia was not likely to play a key role in initiating wound angiogenesis. Instead, TNF and other cytokines were considered to be responsible for elevating the levels of HIF-1α in the wound.
The importance of hypoxia-inducible factor (HIF) in promoting angiogenesis and vasculogenesis during wound healing has been demonstrated. (9,10,11) HIF stimulates critical angiogenic factors involved in wound healing, including VEGF and SDF-1. (12,13) Studies have also shown that hypoxia in the wound or cytokines from inflammatory cells in excisional wounds promote HIF activity. (6,7,8)
It is important to understand the nature of increased HIF-1α in the burn wound, which might provide a theoretical mechanism to promote the wound healing process.
In the current study, pimonidazole was used to characterize the spatial and temporal course of hypoxia in a murine burn model (14) and to correlate this course with the appearance of increased levels of HIF-1α and its important angiogenic and vasculogenic transcription products VEGF and SDF-1. The occurrence of inflammatory cell infiltration in relation to the appearance of hypoxia and HIF-1α was also examined. The physiological significance of the confined localization of hypoxia in epithelium was also explored.
METHODS
Mice strains
Male SV129 mice (Jackson Laboratory, Bar Harbor, Maine, local breeding colony, and Charles River laboratories) were utilized in the study.
Burn model
Animal procedures were approved by the Johns Hopkins University Animal Care and Use Committee. During the experiments the animals were housed one per cage, maintained under controlled environmental conditions (12 hours light to dark cycle, temperature approximately 23°C), and provided with standard laboratory food and water ad libitum. Mice were anesthetized with ketamine hydrochloride (100 mg/kg) and xylazine (10 mg/kg), and the dorsum was shaved and then treated with a depilatory (Nair cream, Church & Dwight Co., Princeton, NJ). A burn wound protocol previously established in rats (15) was adapted for use in mice. (14) A custom-made 220-g aluminum rod was heated in a 100°C water bath for 5 minutes. One burn of 1.2-cm diameter was produced on the dorsum of each animal producing a 10% body surface area burn. Contact time of 4 seconds was measured with a standard metronome. Burn uniformity was assured, with only the weight of the aluminum template providing pressure to the shaved and depilated skin surface. No dressing was used after burn. The animals were resuscitated according to the Parkland formula (4 ml/kg × percent body area) by intraperitoneal injection of saline within one hour after burning. For example, to resuscitate a mouse weighing 25g with a burn covering 10% of body surface area, 2 ml Ringer’s lactate was administered. Skin tissues were collected at day 2 after burn for RNA extract. On days 1, 2, 3, 4, 7, 10, and 14 day after burn, tissues were collected and fixed in 10% formalin for 24 hours for IHC.
Mouse tissue harvest, RNA preparation
Using a template and scalpel, both dermal wound and normal skin tissues were collected at day 2 after burn. Total RNA was extracted from burned and unburned skin tissue of the same mouse with TRIzol (Invitrogen, Frederick, MD) and treated with DNase I (Ambion, Austin, TX) according to the manufacturer’s protocol.
Superarray RT2 Profiler PCR Array for Chemokines
One µg of each RNA sample was used for first-strand synthesis with the RT2 first strand kit (SABiosciences, Frederick, MD) according to the manufacturer’s protocol. Quantitative mRNA expression analysis of 84 chemokines and their receptors was performed with the mouse chemokine and receptor RT2 profiler PCR array PAMM-022 (SABiosciences, Frederick, MD) using the RT2 Real-Time SYBR Green PCR Master Mix (SABiosciences, Frederick, MD) and the iCycler Real-Time PCR Detection System (BioRad, Hercules, CA). The thermocycler parameters were 95°C for 10 minutes, followed by 40 cycles of 95°C for 15 seconds and 60°C for 1 minute. The mRNA expression of each gene in burned tissue was normalized using the average expression of two housekeeping genes (HPRT1 and Hsp90ab1) and compared with the data obtained from the control group (unburned tissue) using the 2-DDCT method according to the manufacturer's protocol.
Quantitative reverse transcription PCR (qRT-PCR)
The results of RT2 Profiler PCR Arrays for HIF-1α and SDF-1 were confirmed by quantitative reverse transcription PCR (qRT-PCR) on the individual RNA samples. One µg of total RNA was used for first-strand synthesis with the iScript cDNA Synthesis system (BioRad, Hercules, CA). Real-time PCR was performed using iQ SYBR Green Supermix and the iCycler Real-Time PCR Detection System (BioRad, Hercules, CA). For each primer pair (sequences available upon request), annealing temperature was optimized by gradient PCR. The fold change in expression of each target mRNA relative to hypoxanthine phosphoribosyltransferase 1 (HPRT1) mRNA was calculated based on the threshold cycle (CT) for amplification as 2−(ΔCT), where ΔCT = CT,target − CT,HPRT1. The mRNA expression of each gene in burned tissue was compared with the data obtained from the unburned tissue of same mouse.
In vivo hypoxia detection
Hypoxyprobe™-1 was used to characterize hypoxia within the burn wound. Hypoxyprobe™-1 Omni Kit (Natural Pharmacial Intl. Inc., Burlington, MA) utilizes pimonidazole hydrochloride as a marker for hypoxia. This chemical distributes with the circulation and binds with thiol groups on amino acids at oxygen levels of pO2 < 10 mm Hg. The binding appears to be non-toxic to cells and permanent. The imaging is carried out using IHC with immunoperoxidase labeled antibodies against the pimonidazole-amino acid adducts. Hypoxyprobe™-1 (80 mg/kg body weight) is injected IP 90 minutes before sacrificing the mice for skin collection. The whole skin sample harvest process takes about 1 minute. The tissue is immediately put in formalin. This procedure does not generate significant background staining.
In vivo BrdU-labeling
For labeling S-phase mitotic cells, the thymidine analogue BrdU was used. Mice sustained a single 1.2 cm diameter burn wound on the dorsum. BrdU was injected IP at 120 mg/kg twice at a one-hour interval (240 mg/kg in total) at day 2 after burn, and mice were sacrificed at 1 hour, 24 hours, and 48 hours after BrdU injections. Wound skin tissues were fixed in formalin and processed for immunohistostaining for BrdU (Cat# KT-077, Kamiya Biomedical, Seattle, WA).
Immunohistochemistry
Burn wounds were harvested with 4mm of adjacent normal skin. Specimens from each site were bisected at the center and fixed in 10% buffered formalin solution overnight. Five-µm-thick paraffin-embedded sections were stained and analyzed by light microscopy. Heat-induced antigen retrieval was used for all antigens except K17, which does not need antigen retrieval. To prevent nonspecific binding, 100 µl of blocking solution containing 2% normal rabbit serum for Hypoxyprobe-1, HIF-1α, and VEGF or goat serum for SDF-1 was applied for 30 minutes. Then 100 µl of rabbit anti-Hypoxyprobe antibody (1:500, Natural Pharmacial Intl. Inc.), rabbit anti-HIF-1α(1:100, Abcam, Cambridge, MA Cat# ab65979), rabbit anti-VEGF (1:1000, Abcam, Cambridge, MA Cat# ab46154), goat anti-SDF-1 (1:100, Santa Cruz Biotechnology, Santa Cruz, CA. Cat# sc-6193), rabbit polyclonal anti-ki67 (1:200, Abcam, Cambridge, MA Cat# ab15580), rat anti-F4/80 (macrophage marker) (1:100, Abcam, Cambridge, MA Cat#x00023; ab6640), rabbit anti-myeloperoxidase (neutrophil marker) (1:1, Abcam, Cambridge, MA Cat#x00023; ab15484), rabbit anti-pancytokeratin (1:100, Abcam, Cambridge, MA Cat#x00023; ab9377), rabbit polyclonal anti-E cadherin (1:100, Abcam, Cambridge, MA Cat#x00023;ab53033) and rabbit anti-keratin 17 (1:1000 dilution, a gift from P. Coulombe) were applied to the sections for 1 hour at room temperature. The sections were then incubated with biotinylated secondary antibody (1:500 dilution; Vector Laboratories, Burlingame, CA). Streptavidin-biotin-horseradish peroxidase was used for signal amplification and diaminobenzidine was used for staining (Vector Laboratories). Counterstaining was performed with hematoxylin and nuclear fast red for 30 seconds, respectively, and 3% H2O2 (Fisher Scientific, Fair Lawn, NJ) was used for blocking endogenous peroxidase activity.
Analysis of immunohistochemistry staining
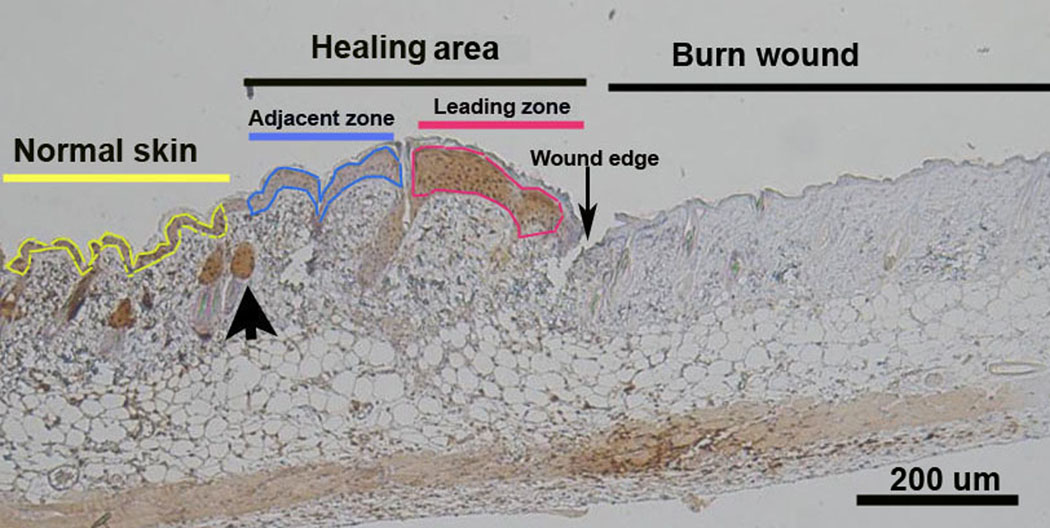
There were at least three mice in each experimental group. The histological results were presented visually and quantitatively using Image-Pro 5.1 software (Media Cybernetics, Silver Spring, MD). Visually, it was clear that the leading zone of the healing area demonstrated high staining density for pimonidazole while the adjacent zone was less hypoxic. The healing area was defined as the area extending from the first hair follicle to the wound edge. Regions of interest (ROIs) were defined as the leading zone and the adjacent zone. (Figure 1) The leading zone is where hypoxia was found. The adjacent zone was within the healing area where it was not hypoxic, and later shown to contain proliferating cells by Ki67 staining. The zones were easily outlined as ROIs for quantification of staining using Image-Pro on pimonidazole staining. Staining intensity per area (staining density) was used to represent the degree of staining over the ROIs. Using the Image-Pro system, a segment of normal skin remote from wounding on each slide was used to determine the baseline staining. The same ROIs used to assess hypoxia on pimonidazole staining were then used to assess the expression of HIF-1α, VEGF, and SDF-1 on sequential sections of the same tissue block.
Figure 1.
Photomicrograph showing the location of hypoxia in the burn wound at day 4. To the right is coagulation necrosis of the burn wound. To the left is normal skin with hair follicles outlined in yellow. The area between the burn wound and the first normal hair follicle (large arrow) is defined as the Healing Area. The Healing Area has 2 portions: one is hypoxic and the other is not hypoxic. The Leading Zone outlined in red shows the pimonidazole positive brown staining indicating hypoxia. More proximal to the normal skin is the pimonidazole negative portion of the healing area termed the Adjacent Zone and outlined in blue.
Statistical analysis
The results were reported as mean ± standard error. Statistical comparison between groups and within different zones was done using two-way ANOVA with Tukey post-tests. The results were considered statistically significant when p < 0.05.
RESULTS
HIF-1α and SDF-1 mRNA expression are increased in burn tissue by Microarray and RT-PCR by day 2
The microarray data showed that HIF-1α, SDF-1, and its two receptors Cxcr 7 and Cxcr 4 were increased by 3.6, 2.9, 4.7, and 3.3 fold compared to unburned skin tissue at day 2 after injury (Table 1A). These increases were confirmed by RT-PCR with 2.0, 4.2, 2.7, and 5.4 fold mRNA up-regulation compared to unburned tissue (Table 1B).
Table 1.
Expression of mRNAs for HIF-1 α, SDF-1 and its receptors 2 days after burn by microarray (A) and RT-PCR (B)
| A. Microarray mRNA profile in the burn wound | |||
|---|---|---|---|
| Symbol | Description | ddct value of burn skin |
Burned skin/ Unburned skin |
| HIF1α | Hypoxia inducible factor 1, alpha subunit | −1.8 | 3.4 |
| Cxcl12 | Chemokine (C-X-C motif) ligand 12 | −1.5 | 2.7 |
| Cxcr4 | Chemokine (C-X-C motif) receptor 4 | −1.7 | 3.2 |
| Cxcr7 | Chemokine (C-X-C motif) receptor 7 | −2.2 | 4.4 |
| B. Fold induction of mRNA by RT-PCR in the burn wound | |||
|---|---|---|---|
| Symbol | ddct value of burn skin | Burned skin/ Unburned skin |
N |
| HIF1α | −0.8 | 1.7 | 7 |
| SDF-1 | −1.8 | 3.5 | 7 |
| Cxcr4 | −1.9 | 3.8 | 6 |
| Cxcr7 | −0.6 | 1.5 | 6 |
| VEGF | −1.0 | 2.0 | 3 |
Hypoxia at the leading zone of the healing area appears at day 2 after burn and peaks at day 3
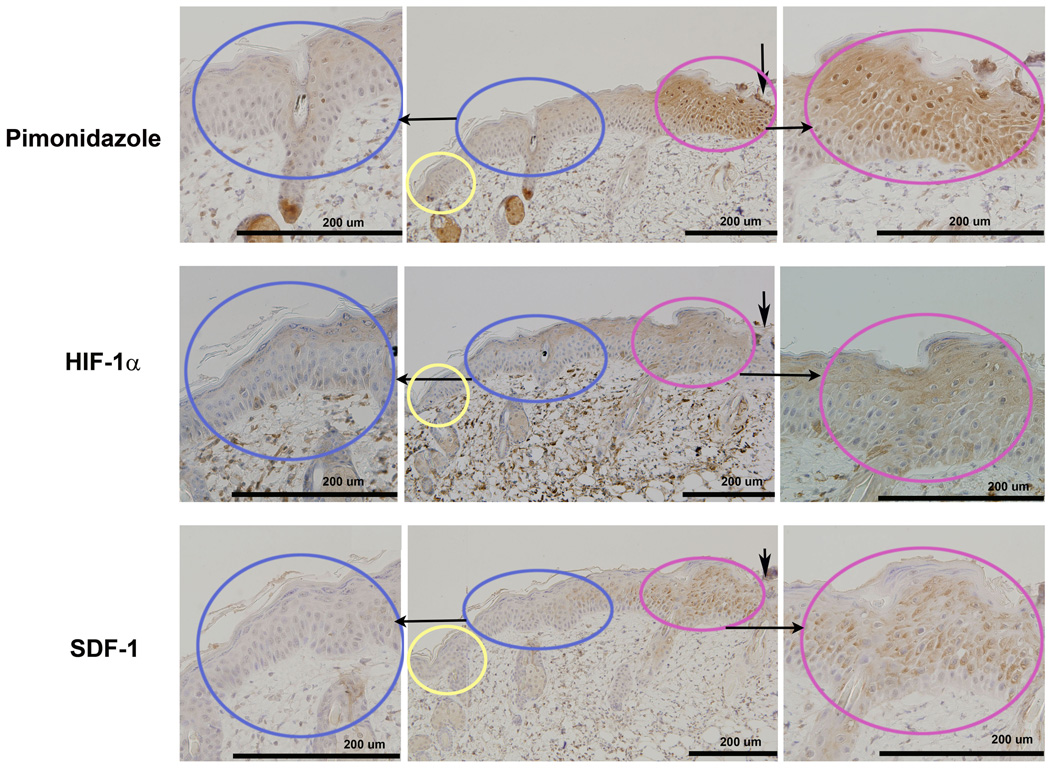
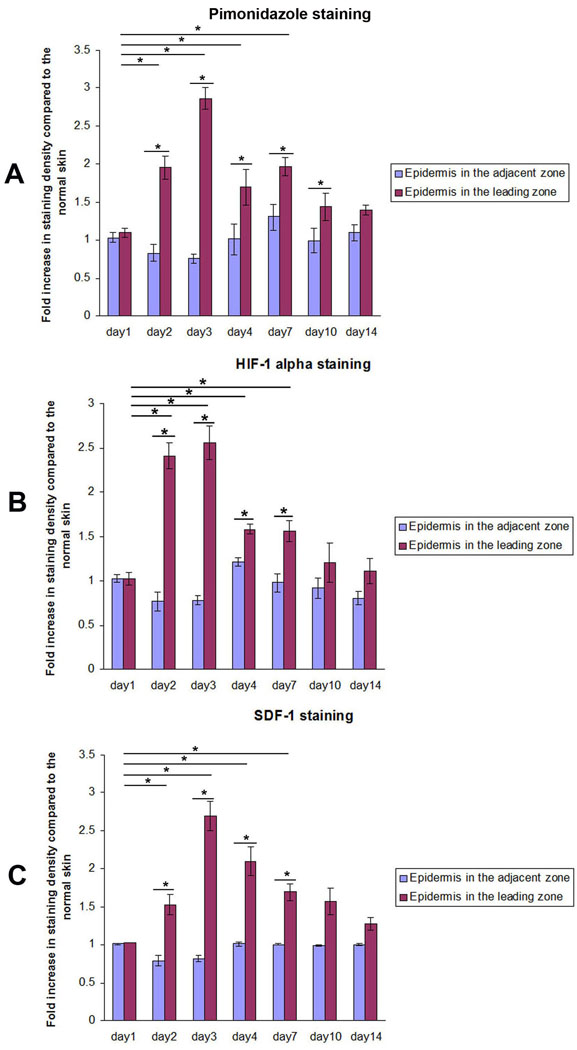
Representative pimonidazole staining on day 3 after burn showed strong positive staining in the confined leading zone of the healing area, while the adjacent zone was not hypoxic. (Figure 2) The pimonidazole staining density in the leading zone of the healing area on days 2, 3, 4, and day 7 were 1.95±0.15, 2.86±0.14, 1.69±0.23, and 2.00±0.12 fold, respectively, increased compared to normal skin. All these values were significantly higher than on day 1 when the staining density was 1.09±0.06. Within the healing area, the pimonidazole staining of the leading zone was significantly higher than that of the more proximal adjacent zone on days 2, 3, 4, and 7. On day 1 after burn, there was no significant staining for pimonidazole in the healing area. (Figure 3)
Figure 2.
Serial IHC sections show the localization of hypoxia, HIF-1 α, and SDF-1 in the leading zone: IHC of hypoxia (pimonidazole-1 staining, upper panel), HIF-1α (middle panel), and SDF-1 (lower panel) were carried out 72 hours after burn. The Leading Zone (in red) showed positive brown staining for all 3 markers. The Adjacent Zone (in blue) and normal skin (in yellow) did not stain positively for the markers. Serial sections from the same tissue block show the co-localized regions of the 3 stains.
Figure 3.
Quantitative analysis of the IHC using Image-Pro software show the localization of hypoxia, HIF1α, and SDF-1 in the Leading Zone at the same time frame: IHC staining density for hypoxia, HIF-1α, and SDF-1 increased significantly on day 2 and peaked on day 3 after burn in the mouse model. Staining density in the leading zone of the healing area, adjacent zone, and normal skin were quantitated using Image-Pro 5.1. Fold increase in staining intensity over normal skin was calculated. (n=3 mice for each group, *P< 0.05, two-way ANOVA and Tukey post-tests).
HIF-1α staining localizes at the same region as hypoxia in the leading zone and peaks on day 3 after burn
The HIF-1α staining co-localized in the leading zone with positive pimonidazole staining for hypoxia. (Figure 2) HIF-1α staining density at the leading zone of the healing area on days 2, 3, 4, and 7 were 2.41±0.15, 2.56±0.19, 1.58±0.06, and 1.56±0.11 fold increased compared to normal skin. All these values were significantly higher than that on day 1 (1.02±0.07) after burn. Within the healing area, the HIF-1α staining in the leading zone of the healing area was significantly higher than that in the more proximal adjacent zone on days 2, 3, 4, and 7. On day 1 after burn, there was no significant staining for HIF-1α in the healing area. (Figure 3)
SDF-1 co-localizes with HIF-1α at the leading zone of the healing area and peaks on day 3 after burn
The SDF-1 staining co-localized with positive pimonidazole staining for hypoxia, as well as with staining for HIF-1α. (Figure 2) The SDF-1 staining density in the leading zone of the healing area on days 2, 3, 4, and 7 were 1.52±0.13, 2.70±0.19, 2.10±0.19, and 1.69±0.11 fold increased compared to normal skin. These values were all significantly higher than that on day 1 (1.03±0.00) after burn. The SDF-1 staining in the leading zone of the healing area was significantly higher than that in the adjacent zone on days 2, 3, 4, and 7. There was no significant difference in SDF-1 staining between the adjacent zone and the remote normal skin. (Figure 3)
VEGF co-localizes with HIF-1α at the leading zone of the healing area
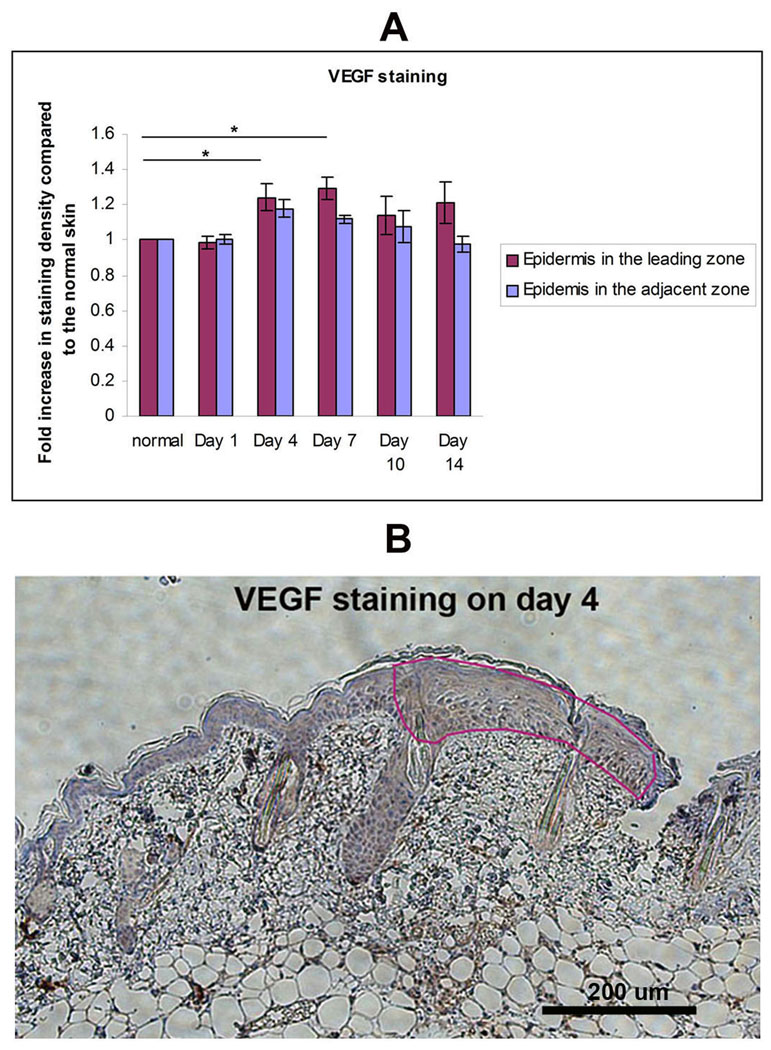
The VEGF staining co-localized with positive pimonidazole staining for hypoxia, as well as with staining for HIF-1α. The VEGF staining density in the leading zone of the healing area on days 4 and 7 were 1.24±0.08 and 1.29±0.06 fold increased compared to normal skin. These values were significantly higher than that on day 1 (0.98±0.04) after burn (Figure 4). The VEGF staining in the leading zone of the healing area was significantly higher than that in the adjacent zone. The level of VEGF increased at the same time as HIF-1α.
Figure 4.
VEGF in the Leading Zone: IHC analysis of VEGF in burn wound. (A) Staining density of the VEGF in Leading Zone, Adjacent Zone, and normal skin were quantitated using Image-Pro 5.1. Fold increase in staining intensity over normal skin was calculated (n=3 mice for each group, *P< 0.05, two-way ANOVA and Tukey post-tests. (B) Representative image of day 4 shown here. VEGF stains in brown.
Early hypoxia in epithelium is not induced by inflammatory infiltration
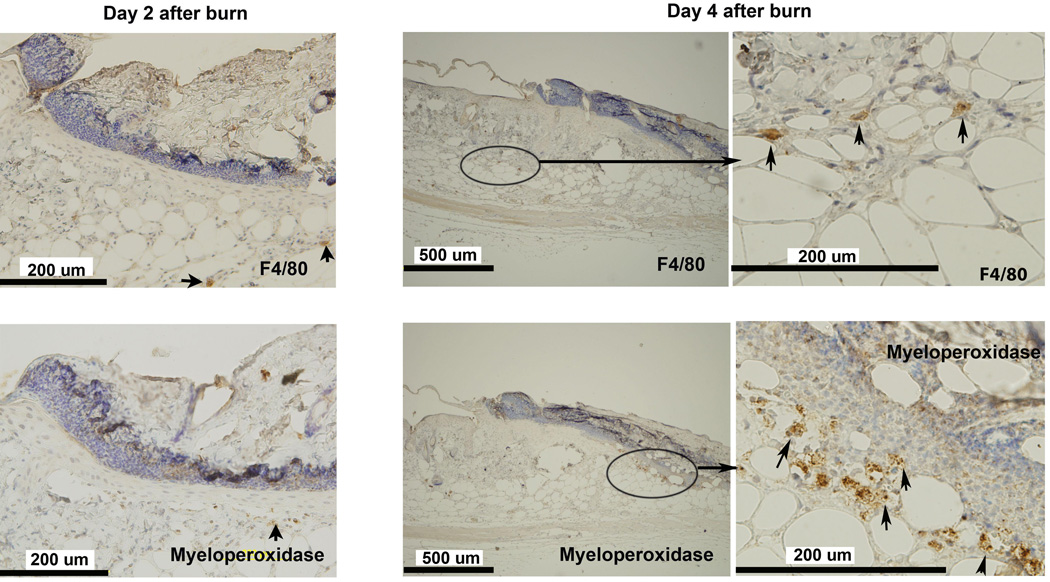
To test whether inflammatory cell infiltration is involved in the induction of early hypoxia in the healing wound, neutrophils and macrophages were detected utilizing IHC with myeloperoxidase and F4/80 as markers. Only occasional neutrophils and macrophages were seen in the leading zone of the healing wound at day 2, when hypoxia became evident. Neutrophils clustered beneath the scar in micro-abscesses. Macrophages were located deep in the hypoxic zone. (Figure 5) The localization of these infiltrating cells was away from the leading zone where the hypoxia and HIF-1α were prominent. These small infiltrations did not appear significant enough to account for the hypoxia in the leading zone.
Figure 5.
Inflammatory cell infiltrate in the healing area: IHC staining for neutrophils (MPO) and macrophages (F4/80) in burn wound on days 2 and 4 after burn. MPO and F4/80 staining of wound tissue at day 2 showed rare positive cells. Cellular infiltrate was still scant at day 4. Occasional clusters of F4/80 positive cells were found at the interface between the dermis and the deep muscle. Small clusters of MPO positive cells were seen in the deep dermis, consistent with micro-abscesses. The left column shows the higher magnification images of middle column on day 4. Arrows indicate positive cells.
Active cellular proliferation is not the reason for wound hypoxia
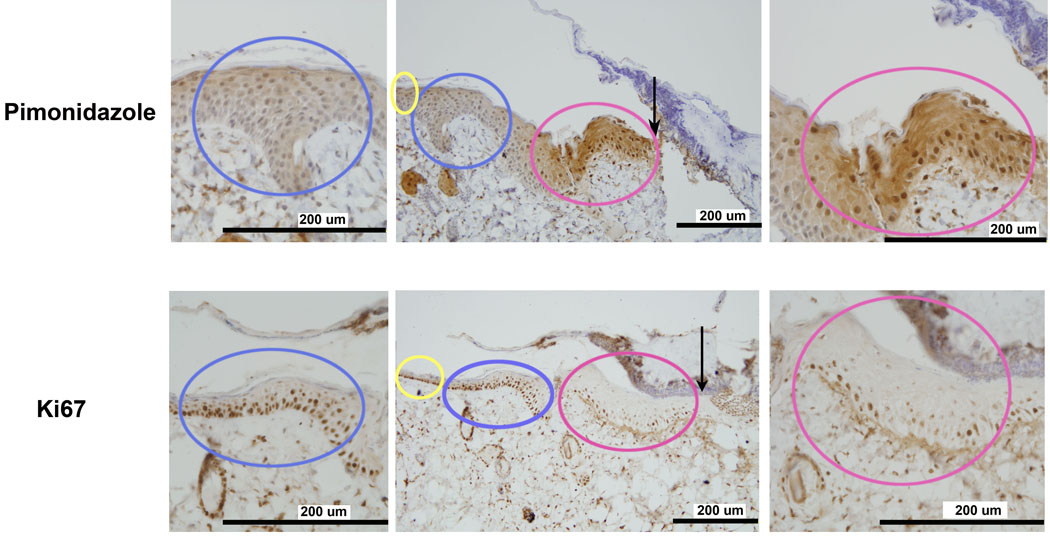
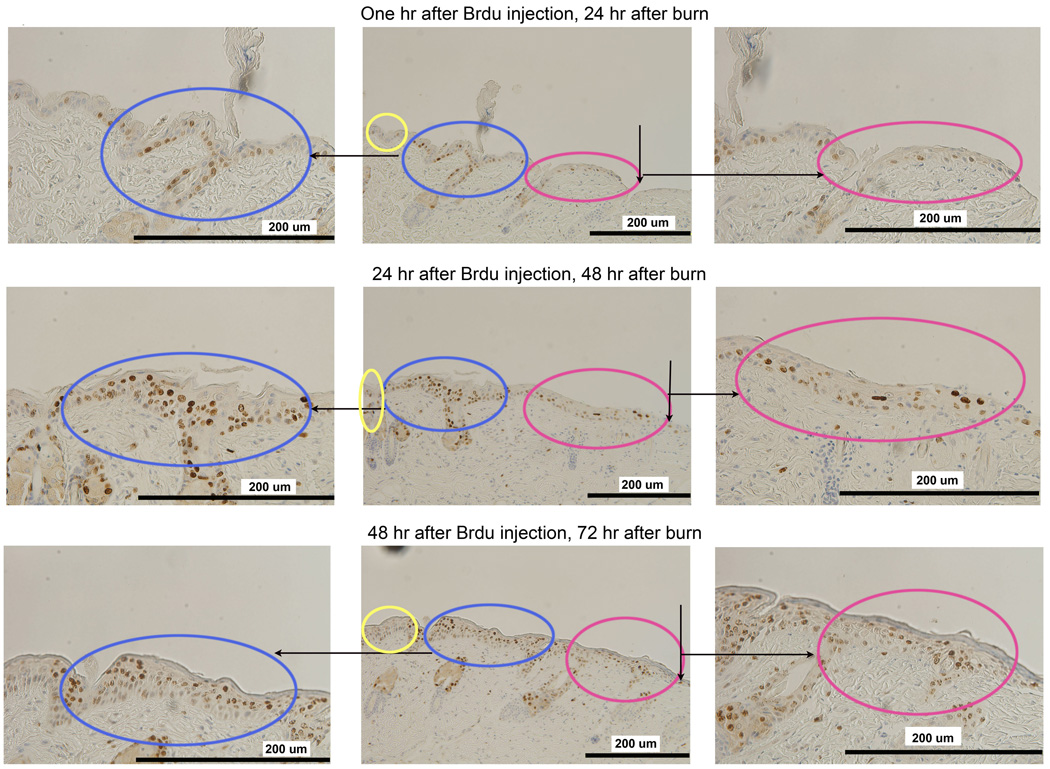
To explore another possible cause for wound hypoxia, we tested the co-localized regions of cell proliferation and hypoxia using Ki67 as a cell proliferation marker. Figure 6 shows that increased Ki67 staining was present in the adjacent zone but not the leading zone. Multiple layers of positively staining proliferating cells were present in the adjacent zone that was not hypoxic. The hypoxic leading zone, similar to the normal epithelium, had only a scant single layer of positively staining proliferating cells. We confirmed these findings by labeling proliferative cells with BrdU at day 2 after burn and tracking the cells with BrdU for another 2 days. Figure 7 shows that BrdU labeling was significant 1 hour after BrdU injection in the adjacent zone on day 2 after burn. One day later, the most active proliferation was in the adjacent zone but not in the leading hypoxic zone. Two days later, BrdU positive cells appeared in the leading hypoxic zone indicating that newly proliferated cells from the adjacent zone had migrated into the leading hypoxic zone. We conclude that active proliferation was not the cause of wound hypoxia in this model.
Figure 6.
Localization of active cell proliferation in the Adjacent Zone: On day 3 after burn, increased IHC staining of pimonidazole did not correlate with the cellular proliferation markers Ki67. The area of active proliferation was in the Adjacent Zone (in blue), not the Leading Zone (in red). Multiple layers of proliferating cells were seen in the Adjacent Zone, while in the Leading Zone, as in normal skin, just a single layer of proliferating cells were found.
Figure 7.
In vivo BrdU pulse-and-trace experiment confirms the findings with Ki67. Mice were pulsed with BrdU at 48 hours after burn and traced at 1 hour (upper row), 24 hours (middle row) and 48 hours (lower row) after BrdU injection. At 1 hour after injection (2 days after burn), cells have a slightly increased staining in the adjacent zone as shown in the upper row. 24 hours later (middle row, 3 days after burn), rapidly proliferating cells are within the Adjacent Zone (in blue) but not in the Leading Zone (in red). 48 hours later (lower row, 4 days after burn), positively stained cells appear in the Leading Zone (in red) which indicates that the proliferating cells have migrated into the Leading Zone.
Cell migration in the hypoxic zone: Decreased levels of E-cadherin in the hypoxic leading zone
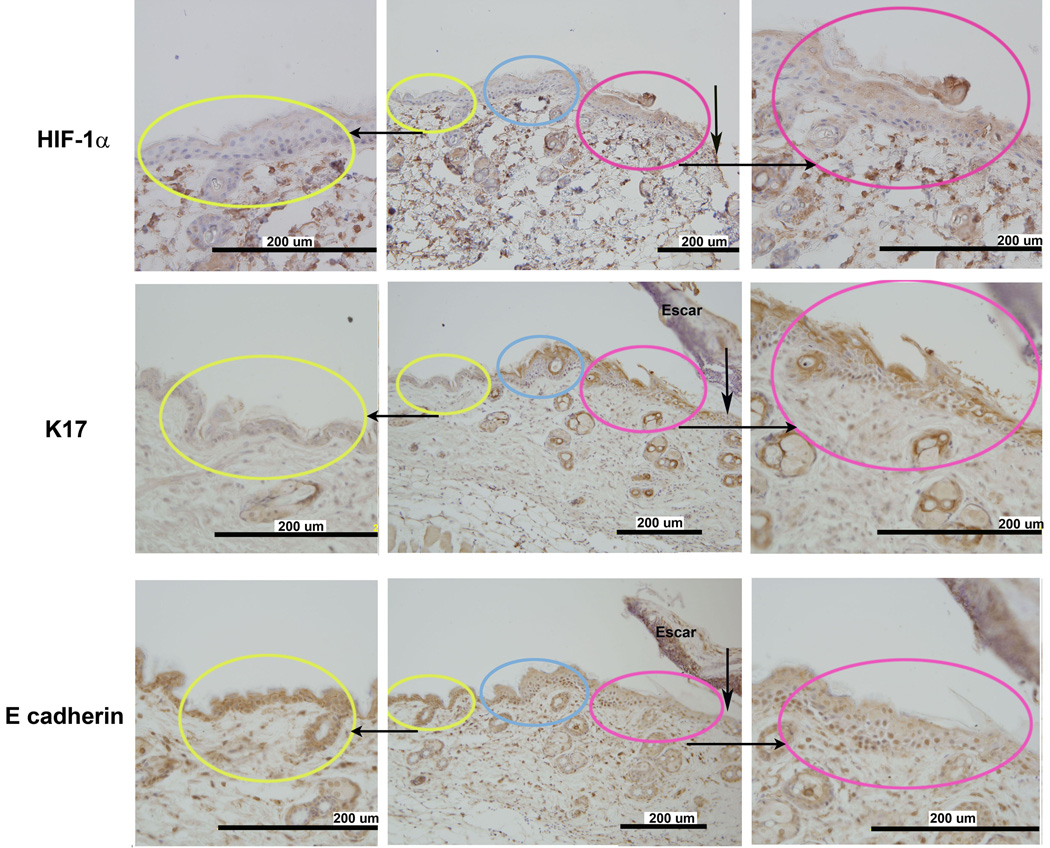
E-cadherin plays an important role in the formation of cell-cell contacts in maintaining epithelial integrity. Studies have shown that E-cadherin expression decreases in wound tissue when epithelial migration occurs. (16) We tested the localization of hypoxia, increased levels of HIF-1α, and E-cadherin expression in the burn wound. Figure 8 shows that the staining for E-cadherin was distinctly reduced in the hypoxic leading zone where HIF-1α levels were increased.
Figure 8.
Localization of markers for cell growth (K17) and migration (E-cadherin) with HIF-1α in the leading zone: Increased staining for K17, a marker of cellular growth, co-localized with increased HIF-1α density in the leading zone. Conversely, staining for E-cadherin was decreased in the same region. E-cadherin is down-regulated in regions of active cellular migration.
Active cell growth and differentiation: Increased levels of Keratin 17 in the hypoxic leading zone
Krt17 is an interesting cytokeratin that has been shown to play a critical role in stimulating cellular growth and differentiation in dermal wound healing through the Akt/mTOR pathway. (17) There was distinctly positive staining for K17 co-localizing with the hypoxic leading zone of the healing wound where HIF-1α was positive. (Figure 8) The co-localized region of increased levels of K17 and HIF-1α suggests that these two factors might be participating in a common regulatory pathway.
DISCUSSION
In this study pimonidazole, a specific tissue hypoxia marker, was utilized to characterize the spatial and temporal course of hypoxia in a murine burn model and correlate this course with the appearance of increased levels of HIF-1α and its important angiogenic and vasculogenic transcription products VEGF and SDF-1. Hypoxia was localized to the leading edge of the healing area of epidermis starting from day 2 after burn and peaking at day 3 after burn. The localization and temporal appearance of hypoxia correlated well to that of HIF-1α, SDF-1 and VEGF. The experiments in the burn wound using IHC to search for co-localized regions of hypoxia and HIF-1α strongly suggest that wound hypoxia is spatially and temporally related to the expression of HIF-1α
Through IHC, we showed that inflammatory cell infiltration occurs away from the healing area and occurs later than the appearance of hypoxia and HIF-1α. The discrepancy between our findings and prior experiments with the sponge model or excisional wounds (6,7) might be due to the nature of the burn wound, where tissue damage is more prominent compared to excisional wound. Because of the semi-quantitative nature of IHC analysis, we cannot exclude the role of inflammatory cell infiltration in up-regulation of HIF-1α based on their scant existence in the wound area. Nevertheless, based on these findings it is reasonable to conclude that in the burn wound HIF-1α is mainly regulated by hypoxia rather than by inflammatory cytokines.
To explore the role of hypoxia in the burn wound, we focused attention on SDF-1, its receptors, and VEGF, which are known to have a role in the mobilization of bone marrow derived progenitor angiogenic cells with potential importance in wound healing. (18,19,20) Although SDF-1 is an HIF regulated cytokine, it has also been shown to be regulated by inflammatory cytokines (21) The increased mRNA levels of SDF-1 and its receptors by microarray and PCR confirm that these cytokines are released in the burn wound at an early stage of wound healing. The spatial and temporal co-expression of SDF-1 and VEGF in the hypoxic zone of the healing area suggests that hypoxia plays an important role in up-regulating these important cytokines in the burn wound.
The physiologic significance of these findings is reinforced by our prior work with this murine burn model. Laser Doppler flowmetry showed that wound blood flow was increased at day 7 after burn. IHC for CD31 staining endothelial cells showed that there was a proliferation of new vessels at day 7 after burning. (14) These findings reinforce the possibility that wound hypoxia could initiate angiogenesis in the burn wound through an HIF mediated pathway.
Wound hypoxia might be a result of poor supply of oxygen via the circulation, or alternately, increased use of oxygen by hypermetabolic cells. If poor supply were a likely cause for the hypoxia, hypoxia might be expected to occur in regions of necrosis where trauma has destroyed or injured blood vessels. However, our data show that the hypoxia was found in a distinct and unexpected location in the leading zone of the healing area but not the necrotic area. Hypoxia was detected in the leading edge where the cells appeared to be viable and active.
To understand this surprising result, we assessed the healing area to characterize its cellular activity. We considered the possibility that the inflammatory infiltrate could explain the hypoxia. Inflammatory cells could be expected to be hypermetabolic and capable of producing hypoxia; however, the cells in and around that area were not inflammatory cells. They did not stain for F4/80 or Myeloperoxidase.
We next considered that cellular proliferation would produce the hypoxia. However, both Ki67 and BrdU analysis showed that the hypoxic cells in the leading edge were not highly proliferating. In contrast, the adjacent non-hypoxic zone was the region of high proliferation. While these proliferating cells were clearly metabolically active, it may be that as in other tissues, the proliferating cells were utilizing anaerobic metabolism, and therefore not making the region hypoxia. (22)
A recent publication provides potential explanation for the absence of cellular proliferation in the hypoxic leading zone where HIF levels are high. HIF has been shown to down-regulate epithelial proliferation by acting as a transcription factor for a silencing microRNA for E2F3. E2F3 promotes epithelial proliferation. (23) This recent finding is entirely consistent with the observation reported here.
Having failed to explain the source of hypoxia as related to the inflammatory infiltrate or cellular proliferation, we explored the possibility that cellular growth, differentiation, and migration might produce the hypoxia. Many keratinocyte subtypes are involved in wound epithelialization. (17) Among them, K17 is an intermediate filament protein rapidly induced in wounded stratified epithelium. K17 regulates cell growth and differentiation, and it is highly associated with epithelial repair. (24,25,26) K17 is also a structural component of myofibroblasts with a potential role in cell migration. Cell migration, growth, and differentiation are all critical components of wound healing. Our data show that the cells in the hypoxic zone stained positively for K17. Consistent with the putative role of K17 in cell migration, we also found that E-cadherin expression is decreased in the hypoxic leading zone of the healing margin. With decreased E-cadherin the cells are more loosely coalesced and free to migrate. This is a feature of epithelial mesenchymal transformation that is found in tumors, where it is induced by HIF. (27)
These findings suggest an important role for hypoxia and HIF in healing of the burn wound. They are consistent with the finding that up-regulation of HIF expression in wounds has been associated with both increased angiogenesis and faster wound closure. (9,10) It is very likely that the heightened metabolic activity of the growing, differentiating, and migrating cells in the leading zone of the healing burn wound drive down tissue oxygen levels, and thus provide a signal through HIF to provide new vessels to the region via angiogenesis and vasculogenesis. Utilizing HIF to help promote angiogenes in wound healing remains a promising clinical possibility.
ACKNOWLEDGMENTS
This work was funded by NIH grant 5P20GM078494 and also by the Hendrix Burn Fund of Johns Hopkins University.
Footnotes
No conflict of interest for the authors related to this study.
REFERENCES
- 1.Hunt TK, Aslam RS. Oxygen 2002: Wounds. Undersea Hyperb Med. 2004;31:147–153. [PubMed] [Google Scholar]
- 2.Hunt TK, Twomey P, Zederfeldt B, Dunphy JE. Respiratory gas tensions and pH in healing wounds. Am J Surg. 1967;114:302–307. doi: 10.1016/0002-9610(67)90388-1. [DOI] [PubMed] [Google Scholar]
- 3.Ninikoski J, Heughan C, Hunt TK. Oxygen tensions in human wounds. J Surg Res. 1972;12:77–82. doi: 10.1016/0022-4804(72)90124-2. [DOI] [PubMed] [Google Scholar]
- 4.Urtasun RC, Coleman CN, Wasserman TH, Phillips TL. Clinical trials with hypoxic cell sensitizers: Time to retrench or time to push forward? Int J Radiat Oncol Biol Phys. 1984;10:1691–1696. doi: 10.1016/0360-3016(84)90530-3. [DOI] [PubMed] [Google Scholar]
- 5.Frangoulis M, Georgiou P, Chrisostomidis C, Perrea D, Dontas I, Kavantzas N, Kostakis A, Papadopoulos O. Rat epigastric flap survival and VEGF expression after local copper application. Plast Reconstr Surg. 2007;119:837–843. doi: 10.1097/01.prs.0000252000.59231.5e. [DOI] [PubMed] [Google Scholar]
- 6.Albina JE, Reichner JS. Oxygen and the regulation of gene expression in wounds. Wound Repair Regen. 2003;11:445–451. doi: 10.1046/j.1524-475x.2003.11619.x. [DOI] [PubMed] [Google Scholar]
- 7.Albina JE, Mastrofrancesco B, Vessella JA, Louis CA, Henry WL, Jr, Reichner JS. HIF-1 expression in healing wounds: HIF-1α induction in primary inflammatory cells by TNF-alpha. Am J Physiol Cell Physiol. 2001;281:C1971–C1977. doi: 10.1152/ajpcell.2001.281.6.C1971. [DOI] [PubMed] [Google Scholar]
- 8.Haroon ZA, Raleigh JA, Greenberg CS, Dewhirst MW. Early wound healing exhibits cytokine surge without evidence of hypoxia. Ann Surg. 2000;231:137–147. doi: 10.1097/00000658-200001000-00020. [DOI] [PMC free article] [PubMed] [Google Scholar]
- 9.Liu L, Marti GP, Wei X, Zhang X, Zhang H, Liu YV, Nastai M, Semenza GL, Harmon JW. Age-dependent impairment of HIF-1α expression in diabetic mice: Correction with electroporation-facilitated gene therapy increases wound healing, angiogenesis, and circulating angiogenic cells. J Cell Physiol. 2008;217:319–327. doi: 10.1002/jcp.21503. [DOI] [PMC free article] [PubMed] [Google Scholar]
- 10.Mace KA, Yu DH, Paydar KZ, Boudreau N, Young DM. Sustained expression of HIF-1α in the diabetic environment promotes angiogenesis and cutaneous wound repair. Wound Repair Regen. 2007;15:636–645. doi: 10.1111/j.1524-475X.2007.00278.x. [DOI] [PubMed] [Google Scholar]
- 11.Chang EI, Loh SA, Ceradini DJ, Chang EI, Lin SE, Bastidas N, Aarabi S, Chan DA, Freedman ML, Giaccia AJ, Gurtner GC. Age decreases endothelial progenitor cell recruitment through decreases in hypoxia-inducible factor 1α stabilization during ischemia. Circulation. 2007;116:2818–2829. doi: 10.1161/CIRCULATIONAHA.107.715847. [DOI] [PubMed] [Google Scholar]
- 12.Thangarajah H, Yao D, Chang EI, Shi Y, Jazayeri L, Vial IN, Galiano RD, Du XL, Grogan R, Galvez MG, Januszyk M, Brownlee M, Gurtner GC. The molecular basis for impaired hypoxia-induced VEGF expression in diabetic tissues. Proc Natl Acad Sci U S A. 2009;106:13505–13510. doi: 10.1073/pnas.0906670106. [DOI] [PMC free article] [PubMed] [Google Scholar]
- 13.Loh SA, Chang EI, Galvez MG, Thangarajah H, El-ftesi S, Vial IN, Lin DA, Gurtner GC. SDF-1α expression during wound healing in the aged is HIF dependent. Plast Reconstr Surg. 2009;123 2 Suppl:65S–75S. doi: 10.1097/PRS.0b013e318191bdf4. [DOI] [PubMed] [Google Scholar]
- 14.Zhang X, Wei X, Liu L, Marti GP, Ghanamah MS, Arshad MJ, Strom L, Spence R, Jeng J, Milner S, Harmon JW, Semenza GL. Association of increasing burn severity in mice with delayed mobilization of circulating angiogenic cells. Arch Surg. 2010;145:259–266. doi: 10.1001/archsurg.2009.285. [DOI] [PMC free article] [PubMed] [Google Scholar]
- 15.Kim DE, Phillips TM, Jeng JC, Rizzo AG, Roth RT, Stanford JL, Jablonski KA, Jordan MH. Microvascular assessment of burn depth conversion during varying resuscitation conditions. J Burn Care Rehabil. 2001;22:406–416. doi: 10.1097/00004630-200111000-00011. [DOI] [PubMed] [Google Scholar]
- 16.Kuwahara M, Hatoko M, Tada H, Tanaka A. E-cadherin expression in wound healing of mouse skin. J Cutan Pathol. 2001;28:191–199. doi: 10.1034/j.1600-0560.2001.028004191.x. [DOI] [PubMed] [Google Scholar]
- 17.Patel GK, Wilson CH, Harding KG, Finlay AY, Bowden PE. Numerous keratinocyte subtypes involved in wound re-epithelialization. J Invest Dermatol. 2006;126:497–502. doi: 10.1038/sj.jid.5700101. [DOI] [PubMed] [Google Scholar]
- 18.Ceradini DJ, Kulkarni AR, Callaghan MJ, Tepper OM, Bastidas N, Kleinman ME, Capla JM, Galiano RD, Levine JP, Gurtner GC. Progenitor cell trafficking is regulated by hypoxic gradients through HIF-1 induction of SDF-1. Nat Med. 2004;10:858–864. doi: 10.1038/nm1075. [DOI] [PubMed] [Google Scholar]
- 19.Ceradini DJ, Gurtner GC. Homing to hypoxia: HIF-1 as a mediator of progenitor cell recruitment to injured tissue. Trends Cardiovasc Med. 2005;15:57–63. doi: 10.1016/j.tcm.2005.02.002. [DOI] [PubMed] [Google Scholar]
- 20.Gurtner GC, Chang E. "Priming" endothelial progenitor cells: A new strategy to improve cell based therapeutics. Arterioscler Thromb Vasc Biol. 2008;28:1034–1035. doi: 10.1161/ATVBAHA.108.163246. [DOI] [PubMed] [Google Scholar]
- 21.Shimada T, Takeshita Y, Murohara T, Sasaki K, Egami K, Shintani S, Katsuda Y, Ikeda H, Nabeshima Y, Imaizumi T. Angiogenesis and vasculogenesis are impaired in the precocious-aging klotho mouse. Circulation. 2004;110:1148–1155. doi: 10.1161/01.CIR.0000139854.74847.99. [DOI] [PubMed] [Google Scholar]
- 22.Werle M, Jahn L, Kreuzer J, Hofele J, Elsasser A, Ackermann C, Katus HA, Vogt AM. Metabolic control analysis of the warburg-effect in proliferating vascular smooth muscle cells. J Biomed Sci. 2005;12:827–834. doi: 10.1007/s11373-005-9010-5. [DOI] [PubMed] [Google Scholar]
- 23.Biswas S, Roy S, Banerjee J, Hussain SR, Khanna S, Meenakshisundaram G, Kuupusamy P, Friedman A, Sen CK. Hypoxia inducible microRNA 210 attenuates keratinocyte proliferation and impairs closure in a murine model of ischemic wounds. Proc Natl Acad Sci U S A. 2010;107:6976–6981. doi: 10.1073/pnas.1001653107. [DOI] [PMC free article] [PubMed] [Google Scholar]
- 24.Kim S, Wong P, Coulombe PA. A keratin cytoskeletal protein regulates protein synthesis and epithelial cell growth. Nature. 2006;441:362–365. doi: 10.1038/nature04659. [DOI] [PubMed] [Google Scholar]
- 25.McGowan KM, Coulombe PA. Onset of keratin 17 expression coincides with the definition of major epithelial lineages during skin development. J Cell Biol. 1998;143:469–486. doi: 10.1083/jcb.143.2.469. [DOI] [PMC free article] [PubMed] [Google Scholar]
- 26.Tong X, Coulombe PA. A novel mouse type I intermediate filament gene, keratin 17n (K17n), exhibits preferred expression in nail tissue. J Invest Dermatol. 2004;122:965–970. doi: 10.1111/j.0022-202X.2004.22422.x. [DOI] [PubMed] [Google Scholar]
- 27.Chen J, Imanaka N, Chen J, Griffin JD. Hypoxia potentiates notch signaling in breast cancer leading to decreased E-cadherin expression and increased cell migration and invasion. Br J Cancer. 2010;102:351–360. doi: 10.1038/sj.bjc.6605486. [DOI] [PMC free article] [PubMed] [Google Scholar]


