

Abstract
To investigate the effect of docosahexaenoic acid (DHA) without other highly unsaturated fatty acids (HUFA) on n-3 and n-6 essential fatty acid (EFA) metabolism and fatty acid composition in mammals, a stable isotope tracer technique was used in adult rats fed diets with or without 1.3% of algal DHA in a base diet containing 15% of linoleic acid and 3% of alpha-linolenic acid over 8 weeks. The rats were administered orally a mixed oil containing 48 mg/kg body weight of deuterated linoleic and alpha-linolenic acids and euthanized at 4, 8, 24, 96, 168, 240, 360 and 600 h after administration of the isotopes. Fatty acid compositions and the concentrations of deuterated precursors and their respective metabolites were determined in rat liver, plasma, heart and brain as a function of time. DHA, docosapentaenoic acid and eicosapentaenoic acid in the n-3 EFA family were significantly increased in all organs tested in the DHA-fed group, ranging from 5 to 200% greater in comparison with the control group. The accumulation of the metabolites, deuterated-DHA and deuterated-docosapentaenoic acid n-6 were greatly decreased by 1.5 to 2.5 fold in the dietary DHA group. In summary, feeding preformed DHA led to a marked increase in n-3 HUFA content of rat organs at the expense of n-6 HUFA and also prevented the accumulation of newly synthesized deuterated end products. This is the first study which has isolated the effects of DHA on the de novo metabolism on both the n-6 and n-3 EFA pathways.
Keywords: alpha-linolenic acid, linoleic acid, docosahexaenoic acid, docosapentaenoic acid, essential fatty acid, stable isotope, GC/MS, metabolism
Introduction
Docosahexaenoic acid (DHA, 22:6n-3) may be synthesized from plant alpha-linolenic acid (18:3n-3) in mammals (1), although 4∼5% of a single dose of deuterated 18:3n-3 was converted to DHA in the rat body over a 25 day period with only about 0.1% of that in the nervous system (2). The majority of the dietary C18 EFAs are β-oxidized (2-4). In isotopic tracer studies, labeled DHA was incorporated into liver and brain in baboon neonates and in rats much more efficiently than when derived from labeled-18:3n-3 (5,6). Studies of newborn rats supplied with preformed DHA via artificial rearing during early development indicated that 90% of the brain DHA was derived from preformed DHA intake (7,8). Infant formula supplemented with DHA and arachidonic acid (20:4n-6) has been shown to be beneficial for optimal nervous system development in both preterm (9-12) and term infants (13,14).
What is unclear is whether the addition of preformed long chain polyunsaturated fatty acids (LC-PUFA) to the diet results in alteration of C18 metabolism or whether the LC-PUFAs are simply incorporated into tissues. In the latter case, incorporation of the LC-PUFA can lead to a decrease in other tissue LC-PUFAs since they compete for the same set of liver microsomal acyltransferases (15). A well known example of this is the increase in eicosapentaenoic acid (20:5n-3) and DHA content of tissues concomitant with a decrease in 20:4n-6 with dietary fish oil supplementation (16). A well defined dietary experiment with a single essential fatty acid variable, together with the analysis of the in vivo metabolism of stable isotope labeled-EFAs can thus help to delineate these two possibilities and to determine to what extent preformed DHA may lead to a decline in C18 essential fatty acid (EFA) metabolism.
This animal study is aimed at investigating how addition of preformed DHA alters essential fatty acid composition and metabolism. A basal diet containing 15% 18:2n-6 and 3% 18:3n-3 of total fatty acids was used as the control diet to which 1.3 wt% DHA was substituted for saturated fat in the experimental diet. The basal diet was chosen so as to have a substantial level of 18:3n-3 and not be n-3 fatty acid deficient so as to have greater relevance to physiological diets. The stable isotope tracer technique coupled with analysis by negative chemical ionization, gas chromatography/mass spectrometry (NCI GC/MS) was applied to this investigation. A single oral dose of both deuterated 18:3n-3 and deuterated 18:2n-6 was administrated to adult rats after equilibrating them to their respective diets for 8 weeks. The deuterated precursors and their metabolites in rat liver, plasma, heart and brain at various times from 4 h to 25 d after administration of isotopes were quantified as well as tissue fatty acid distributions. This is the first study which has isolated the effects of DHA on the de novo metabolism on both the n-6 and n-3 EFA pathways.
Materials and Methods
Animal study
All animal procedures were carried out in accordance with the NIH guidelines concerning animal welfare and the protocol was approved by the NIAAA Animal Care and Use Committee. Three-week-old weanling, male and female Long Evans hooded rats (Charles River Laboratories, Portage, MI) were randomly divided into two groups and supplied custom diets (Dyets, Bethlehem, PA), which included a basal diet (control diet) containing 15% of 18:2n-6 and 3.1% of 18:3n-3; modified from the AIN-93G standard with 10% fat (17), as specified in Table 1. The experimental diet was identical except that docosahexaenoate (DHA diet, 1.3% of 22:6n-3) was substituted for saturated fat (18). After consuming the diets for 8 wk, 16 male rats with a body weight (BW) of 419 ± 31 g (mean ± SD), 16 female rats with BW of 309 ± 31 g in each diet group were divided into 8 groups (n=4) and simultaneously administrated a single oral dose of ∼ 48 mg/kg BW each of 2H5-18:3n-3 and 2H5-18:2n-6 ethyl ester using olive oil as the vehicle. Animals were fasted overnight prior to the administration of isotopic tracers in the morning. Animals (n=4 per diet group) were euthanized at 4, 8, 24 h, 4, 7, 10, 15, 25 d after administration of the isotopic tracers. At sacrifice, liver, plasma, heart, and brain were collected, stored at -80°C until analysis. Baseline values for GC/MS analyses were obtained from control animals gavaged with vehicle oil only.
TABLE 1. Nutrient composition of diets a.
| Ingredients b | Amount (g/kg of diet) |
||
|---|---|---|---|
| Protein (20%) | |||
| Casein (vitamin free) | 200 | ||
| Carbohydrate (60%) | |||
| Cornstarch | 150 | ||
| Dextrose | 199.5 | ||
| Maltose-dextrin | 150 | ||
| Sucrose | 100 | ||
| Others (10%) | |||
| Cellulose | 50 | ||
| Mineral & Salt Mix | 35 | ||
| Vitamin Mix | 10 | ||
| L-Cystine | 3 | ||
| Choline Bitartrate | 2.5 | ||
| TBHQ | 0.02 | ||
| Fat (10%) | 100 | ||
| Control Diet | DHA Diet | ||
| HCO | 77.5 | 74.5 | |
| Safflower Oil | 17.7 | 17.7 | |
| Flaxseed Oil | 4.8 | 4.8 | |
| DHASCO | 0 | 3 | |
|
Fatty Acid Composition c (wt% of total fatty acids) |
|||
| Saturates | 77.2 | 75.6 | |
| Monounsaturates | 4.3 | 4.8 | |
| 18:2n-6 | 15.3 | 15.8 | |
| 18:3n-3 | 3.12 | 2.55 | |
| 22:6n-3 | ND d | 1.28 | |
Diets were modifications of the AIN-93G.
TBHQ, tert-butylhydroquinone; HCO, hydrogenated coconut oil; DHASCO, docosahexaenoic acid single cell oil.
C20 and C22 polyunsaturates (except 22:6n-3) were present at only trace levels.
ND indicates signals were at trace levels or below.
Isotopes and chemicals
Deuterated alpha-linolenate (2H5-17, 17, 18, 18, 18-18:3n-3 ethyl ester, 2H > 95%) and deuterated linoleate (2H5-17, 17, 18, 18, 18-18:2n-6 ethyl ester, 2H > 95%) were obtained from Cambridge Isotope Laboratories (Andover, MA). A dual labeled isotope, deuterated and carbon-13 labeled gamma-linolenate (7,8-13C2, 99%; 2,2,3,3,4,4,5,5,6-2H9, 98%-18:3n-6 ethyl ester), was used as an internal standard for the determination of labeled fatty acids and their in vivo metabolites. The anion of M+11 (isotope abundance was 63.7%) for the labeled-18:3n-6 internal standard was monitored in the negative chemical ionization mode in the gas chromatography /mass spectrometric analyses. This internal standard was not detectable in the rat tissues analyzed in this report.
Chemical analysis
The right hemisphere of the brain, the whole heart and 1 g of liver were dissected and homogenized in 8 mL of methanol containing butylated hydroxytoluene (BHT, 50 mg/L) using a power homogenizer (Omni International, Marietta, GA). An aliquot of the homogenate was used to extract total tissue lipids using the Folch method (19). Known amounts of the internal standard 22:3n-3 ethyl ester was added to each sample prior to lipid extraction, 0.6 μmol for liver and brain and 0.3 μmol for heart for the unlabeled fatty acid analysis by GC/FID; 16 nmol of 13C2,2H9-18:3n-6 ethyl ester was used an internal standard for GC/MS analysis. Similarly, 200 μL of plasma spiked with 25 nmol of 23:0 ethyl ester and 0.5 nmol of 13C2,2H9-18:3n-6 ethyl ester was mixed with 1 mL of BHT-methanol during total lipid extraction.
Non-labeled fatty acids in each organ were transmethylated and determined by gas chromatography/ flame ionization (20,21). A DB-FFAP capillary column (30 m × 0.25 mm i.d. × 0.25 μm, J&W Scientific, Folsom, CA) installed in a GC 6890 Plus LAN system (Agilent Technologies, Inc., Santa Clara, CA) was used to resolve various methylated fatty acids. A quantitative methyl ester reference standard of 28 fatty acids (GLC-462, Nu-Chek Prep, Elysian, MN) was used to identify the retention time of methyl ester peaks.
Isotope-labeled fatty acids in each organ were measured by gas chromatography/mass spectrometry assay (22) on a GC 6890 / MSD 5973 LAN system (Agilent Technologies, Inc., Santa Clara, CA) with the same capillary column as above (23). Non-labeled and labeled C24 fatty acids in all four tissues as well as 18:3n-3 and 20:5n-3 in brain were quantified by GC/MS.
Calculation and Statistics
The amounts of the fatty acids were determined by comparing the integrated areas of the fatty acid peaks on the gas chromatograms with those of the corresponding internal standards. Data were expressed as either the concentrations of fatty acid as mol per mL of plasma and per g of wet tissue weight; or as the percentage of isotope initial doses (%dose) or the percentage of total fatty acid weight (wt%), as indicated in the text. Values were expressed as mean ± SEM (n=4) unless otherwise indicated. Area under the curves (AUC) were obtained by integrating the time-course curves of enrichment, from 0 to 600 h, for various labeled fatty acids using the trapezoid estimation approach (24).
Repeated measures ANOVA was applied to assess the effects of diet over the time course of labeled fatty acids using SPSS 13.0 (SPSS Inc., Chicago, IL). The significance level was set at a P value of 0.05 or lower. A two-tailed, pairwise t-test was applied to determine significant differences in endogenous non-labeled fatty acid composition between the two groups at a P value of 0.05 or lower unless otherwise indicated.
Results
Fatty acid composition in rat plasma, liver, heart and brain
After an 8-wk period on the experimental diets, there was a significant difference in the fatty acid compositions of plasma, liver (Table 2), heart and brain (Table 3) between the group fed basal diet (control group) and those fed the DHA supplemented diet (DHA group). The DHA content in the DHA group was significantly greater than in the control group in all four tissues examined, plasma and heart were 50% greater and liver and brain were 33% and 4.6% greater, respectively. Accompanying the higher DHA content was an approximately two-fold greater level of 20:5n-3 in plasma, liver and heart. Similarly, docosapentaenoic acid (22:5n-3) in the liver, brain and plasma was 30% greater in the DHA group (P < 0.001) and there were higher levels (P < 0.05) of the more minor n-3 fatty acids, 24:5n-3 and 24:6n-3 in liver and brain. There was no difference in 18:3n-3 between the two groups. There was a significantly greater total n-3 HUFA level in the DHA group relative to the control group in all four tissues.
TABLE 2. Non-labeled fatty acid compositions in rat plasma and liver (wt% of total fatty acids).
| Fatty Acids | Plasma | Liver | ||||
|---|---|---|---|---|---|---|
| Control Diet | DHA Diet | Control Diet | DHA Diet | |||
| 10:0 | 0.005 ± 0.002 | 0.021 ± 0.02 | 0.009 ± 0.001 | 0.011 ± 0.001 | ||
| 12:0 | 0.46 ± 0.05 | 0.45 ± 0.05 | 0.34 ± 0.03 | 0.38 ± 0.04 | ||
| 14:0 | 1.27 ± 0.08 | 1.28 ± 0.06 | 1.27 ± 0.07 | 1.17 ± 0.06 | ||
| 16:0 | 17.56 ± 0.37 | 17.83 ± 0.50 | 21.25 ± 0.41 | 22.17 ± 0.59 | ||
| 18:0 | 12.94 ± 0.58 | 13.71 ± 0.53 | 14.86 ± 0.48 | 15.14 ± 0.53 | ||
| 20:0 | 0.08 ± 0.01 | 0.08 ± 0.004 | 0.04 ± 0.002 | 0.05 ± 0.02 | ||
| 22:0 | 0.09 ± 0.01 | 0.10 ± 0.004 | 0.05 ± 0.003 | 0.06 ± 0.003 | ||
| 24:0 | 0.16 ± 0.01 | 0.13 ± 0.02 | 0.16 ± 0.01 | 0.17 ± 0.01 | ||
| 12:1 | 0.01 ± 0.00 | ND | 0.01 ± 0.001 | 0.01 ± 0.001 | ||
| 14:1 | 0.09 ± 0.01 | 0.09 ± 0.004 | 0.09 ± 0.01 | 0.10 ± 0.01 | ||
| 16:1n-7 | 2.65 ± 0.13 | 2.27 ± 0.16 | a* | 3.07 ± 0.16 | 2.90 ± 0.19 | |
| 18:1n-9 | 16.16 ± 1.12 | 13.26 ± 0.95 | a** | 18.07 ± 0.78 | 16.66 ± 0.87 | a*** |
| 18:1n-7 | 2.51 ± 0.10 | 1.99 ± 0.09 | a*** | 3.54 ± 0.13 | 2.61 ± 0.11 | a** |
| 20:1n-9 | 0.13 ± 0.01 | 0.09 ± 0.005 | a*** | 0.15 ± 0.01 | 0.11 ± 0.01 | a*** |
| 22:1n-9 | 0.02 ± 0.00 | 0.01 ± 0.001 | a* | 0.013 ± 0.00 | 0.007 ± 0.001 | |
| 24:1n-9 | 0.58 ± 0.05 | 0.68 ± 0.04 | 0.10 ± 0.02 | 0.08 ± 0.005 | ||
| 18:3n-3 | 0.53 ± 0.03 | 0.56 ± 0.03 | 0.53 ± 0.04 | 0.61 ± 0.05 | ||
| 20:5n-3 | 0.57 ± 0.04 | 1.74 ± 0.11 | b*** | 0.34 ± 0.03 | 1.07 ± 0.07 | b*** |
| 22:5n-3 | 0.48 ± 0.03 | 0.63 ± 0.04 | b*** | 0.55 ± 0.03 | 0.71 ± 0.03 | b*** |
| 22:6n-3 | 4.47 ± 0.15 | 6.72 ± 0.18 | b*** | 7.52 ± 0.27 | 9.99 ± 0.33 | b*** |
| 24:5n-3 | ND | ND | 0.009 ± 0.001 | 0.01 ± 0.001 | b* | |
| 24:6n-3 | ND | ND | 0.02 ± 0.001 | 0.02 ± 0.002 | b* | |
| 18:2n-6 | 10.66 ± 0.41 | 12.71 ± 0.43 | b*** | 8.84 ± 0.39 | 9.89 ± 0.41 | |
| 18:3n-6 | 0.18 ± 0.01 | 0.17 ± 0.01 | 0.16 ± 0.01 | 0.19 ± 0.03 | ||
| 20:2n-6 | 0.08 ± 0.01 | 0.10 ± 0.01 | 0.11 ± 0.01 | 0.11 ± 0.01 | ||
| 20:3n-6 | 0.53 ± 0.03 | 0.90 ± 0.05 | b*** | 0.53 ± 0.04 | 0.77 ± 0.05 | b*** |
| 20:4n-6 | 23.32 ± 0.85 | 20.88 ± 0.86 | a* | 15.28 ± 0.69 | 12.32 ± 0.52 | a*** |
| 22:2n-6 | ND | ND | 0.02 ± 0.002 | 0.02 ± 0.001 | ||
| 22:4n-6 | 0.31 ± 0.02 | 0.13 ± 0.01 | a*** | 0.30 ± 0.02 | 0.15 ± 0.01 | a*** |
| 22:5n-6 | 0.25 ± 0.02 | 0.13 ± 0.02 | a*** | 0.31 ± 0.02 | 0.10 ± 0.01 | a*** |
| 24:4n-6 | ND | ND | 0.01 ± 0.001 | 0.005 ± 0.000 | a*** | |
| 24:5n-6 | ND | ND | 0.007 ± 0.001 | 0.002 ± 0.000 | a*** | |
| Σ SFA | 32.57 ± 0.51 | 33.59 ± 0.38 | b* | 37.97 ± 0.33 | 39.16 ± 0.38 | b* |
| Σ MUFA | 22.16 ± 1.12 | 18.38 ± 1.00 | a*** | 25.03 ± 0.91 | 22.47 ± 1.01 | |
| Σ PUFA | 41.59 ± 0.92 | 44.95 ± 0.88 | b** | 34.48 ± 0.97 | 35.94 ± 1.10 | |
| HUFA n-3 | 5.61 ± 0.16 | 9.34 ± 0.29 | b*** | 8.43 ± 0.29 | 11.81 ± 0.38 | b*** |
| HUFA n-6 | 24.53 ± 0.85 | 22.08 ± 0.86 | a* | 16.46 ± 0.71 | 13.37 ± 0.54 | a*** |
| HUFA n6/n3 | 4.43 ± 0.15 | 2.45 ± 0.12 | a*** | 1.95 ± 0.05 | 1.14 ± 0.03 | a*** |
| Total Fatty Acids (μmol/g wet weight tissue) | ||||||
| 9.5 ± 0.6 | 6.9 ± 0.3 | b*** | 171.1 ± 11.4 | 160.9 ± 8.1 | ||
Values were presented as mean ± SEM (n=32) of endogenous fatty acids from the animals over the entire experimental period.
SFA: saturated, MUFA: monounsaturated, PUFA: polyunsaturated, HUFA: highly unsaturated fatty acids.
Significant differences were determined by two-tailed, paired t-test with P values of 0.05*, 0.01**, 0.001 or lower ***.
indicates decrement,
accretion of fatty acids in DHA diet group.
TABLE 3. Non-labeled fatty acid compositions in rat heart and brain (wt% of total fatty acids).
| Fatty Acids | Heart | Brain | ||||
|---|---|---|---|---|---|---|
| Control Diet | DHA Diet | Control Diet | DHA Diet | |||
| 10:0 | 0.017 ± 0.003 | 0.017 ± 0.003 | ND | ND | ||
| 12:0 | 1.07 ± 0.11 | 1.08 ± 0.13 | 0.01 ± 0.00 | 0.01 ± 0.00 | a** | |
| 14:0 | 1.67 ± 0.15 | 1.65 ± 0.16 | 0.20 ± 0.01 | 0.21 ± 0.02 | ||
| 16:0 | 15.04 ± 0.57 | 15.61 ± 0.58 | 18.94 ± 0.16 | 18.76 ± 0.12 | ||
| 18:0 | 18.76 ± 0.52 | 18.72 ± 0.56 | 16.84 ± 0.16 | 16.70 ± 0.08 | ||
| 20:0 | 0.11 ± 0.003 | 0.12 ± 0.00 | 0.42 ± 0.01 | 0.41 ± 0.01 | ||
| 22:0 | 0.06 ± 0.003 | 0.07 ± 0.004 | b* | 0.34 ± 0.01 | 0.34 ± 0.01 | |
| 24:0 | 0.08 ± 0.005 | 0.07 ± 0.004 | 0.58 ± 0.03 | 0.57 ± 0.03 | ||
| 12:1 | 0.02 ± 0.002 | 0.02 ± 0.002 | ND | ND | ||
| 14:1 | 0.12 ± 0.01 | 0.11 ± 0.02 | 0.03 ± 0.01 | 0.04 ± 0.01 | ||
| 16:1n-7 | 2.16 ± 0.24 | 1.99 ± 0.26 | 0.35 ± 0.01 | 0.36 ± 0.004 | ||
| 18:1n-9 | 11.47 ± 0.92 | 10.51 ± 0.98 | 17.86 ± 0.10 | 18.36 ± 0.09 | b*** | |
| 18:1n-7 | 3.77 ± 0.07 | 3.26 ± 0.07 | a*** | 4.05 ± 0.04 | 4.02 ± 0.02 | |
| 20:1n-9 | 0.12 ± 0.01 | 0.11 ± 0.01 | a* | 2.13 ± 0.05 | 2.20 ± 0.03 | |
| 22:1n-9 | 0.02 ± 0.001 | 0.01 ± 0.000 | 0.20 ± 0.01 | 0.21 ± 0.003 | ||
| 24:1n-9 | 0.08 ± 0.01 | 0.03 ± 0.01 | a*** | 1.77 ± 0.12 | 1.81 ± 0.11 | |
| 18:3n-3 | 0.27 ± 0.01 | 0.27 ± 0.02 | 0.005 ± 0.000 | 0.007 ± 0.000 | b*** | |
| 20:5n-3 | 0.11 ± 0.01 | 0.30 ± 0.01 | b*** | 0.02 ± 0.001 | 0.05 ± 0.001 | b*** |
| 22:5n-3 | 1.08 ± 0.05 | 1.01 ± 0.04 | 0.16 ± 0.01 | 0.21 ± 0.003 | b*** | |
| 22:6n-3 | 9.64 ± 0.44 | 14.59 ± 0.65 | b*** | 14.00 ± 0.12 | 14.64 ± 0.10 | b*** |
| 24:5n-3 | ND | ND | 0.03 ± 0.002 | 0.05 ± 0.001 | b*** | |
| 24:6n-3 | ND | ND | 0.10 ± 0.006 | 0.14 ± 0.002 | b*** | |
| 18:2n-6 | 11.74 ± 0.39 | 12.70 ± 0.35 | b* | 0.48 ± 0.01 | 0.59 ± 0.01 | b*** |
| 18:3n-6 | 0.03 ± 0.001 | 0.02 ± 0.001 | a*** | ND | ND | |
| 20:2n-6 | 0.09 ± 0.01 | 0.09 ± 0.002 | 0.13 ± 0.004 | 0.15 ± 0.004 | b*** | |
| 20:3n-6 | 0.35 ± 0.02 | 0.43 ± 0.01 | b*** | 0.37 ± 0.01 | 0.44 ± 0.01 | b*** |
| 20:4n-6 | 17.82 ± 0.67 | 13.90 ± 0.58 | a*** | 8.87 ± 0.06 | 8.40 ± 0.04 | a*** |
| 22:2n-6 | 0.03 ± 0.00 | 0.03 ± 0.003 | 0.06 ± 0.01 | 0.06 ± 0.00 | ||
| 22:4n-6 | 0.70 ± 0.03 | 0.31 ± 0.01 | a*** | 3.08 ± 0.02 | 2.82 ± 0.02 | a*** |
| 22:5n-6 | 0.78 ± 0.05 | 0.13 ± 0.01 | a*** | 0.38 ± 0.01 | 0.22 ± 0.01 | a*** |
| 24:4n-6 | ND | ND | 0.42 ± 0.02 | 0.41 ± 0.007 | ||
| 24:5n-6 | ND | ND | 0.10 ± 0.005 | 0.09 ± 0.002 | ||
| Σ SFA | 36.80 ± 0.33 | 37.32 ± 0.32 | 37.33 ± 0.27 | 37.01 ± 0.12 | ||
| Σ MUFA | 17.74 ± 1.14 | 16.04 ± 1.26 | 26.39 ± 0.20 | 27.00 ± 0.14 | b* | |
| Σ PUFA | 42.63 ± 1.35 | 43.79 ± 1.42 | 27.56 ± 0.17 | 27.73 ± 0.15 | ||
| HUFA n-3 | 10.83 ± 0.49 | 15.91 ± 0.69 | b*** | 14.32 ± 0.12 | 15.08 ± 0.11 | b*** |
| HUFA n-6 | 19.68 ± 0.72 | 14.81 ± 0.61 | a*** | 13.27 ± 0.09 | 12.44 ± 0.06 | a*** |
| HUFA n6/n3 | 1.85 ± 0.04 | 0.94 ± 0.02 | a*** | 0.93 ± 0.01 | 0.83 ± 0.01 | a*** |
| Total Fatty Acids (μmol/g wet weight tissue) | ||||||
| 62.2 ± 5.1 | 59.2 ± 3.5 | 97.8 ± 1.4 | 95.1 ± 1.1 | |||
Footnotes are same as those for Table 2.
Dihomo-gamma-linoleic acid (20:3n-6) was a greater proportion of total fatty acid composition in the DHA group in all four tissues examined (P < 0.001). As seen in Tables 2 and 3, 20:3n-6 was 70% greater in plasma, heart and brain and 45% greater in liver in the DHA group compared with the control group. The accretion of 18:2n-6 was also somewhat increased in the DHA group in brain, plasma and heart (P < 0.05). In contrast to the n-3 HUFA, the n-6 HUFA was generally lower in all tissues examined in the DHA group. For all four compartments, 20:4n-6, 22:4n-6 and 22:5n-6 showed significantly lower proportions in the DHA group (P < 0.05 or 0.001). In the DHA group, brain 20:4n-6 (5%), 22:4n-6 (8%) and 22:5n-6 (42%) were all lower relative to the control group and a greater decrement was observed in the other tissues. In plasma, liver and heart, 22:4n-6 and 22:5n-6 were about 50% lower in the DHA group while 22:5n-6 was 83% lower in heart. About a 10 to 20% decrement in 20:4n-6 was observed in plasma, liver and heart. The 24:4n-6 and 24:5n-6 were significantly lower in liver but not in brain in the DHA group. Increases in some of the n-6 PUFA precursors in plasma and liver obscured changes in the total n-6 HUFA content between the two diets but a lower level in the DHA group was observed in heart and brain (P < 0.001).
In general, the summation of n-3 and n-6 PUFA was not significantly different in the liver, heart or brain between the two groups but was higher in the plasma of the DHA diet group (P < 0.01). Some monounsaturated fatty acids in the liver, plasma and heart such as 18:1n-7, 20:1n-9 and 22:1n-9 comprised a lower proportion of total fatty acids in the DHA diet group (P < 0.05) but there was a higher level of 18:1n-9 in the brain.
Alteration of essential fatty acids metabolism by dietary DHA
Dietary DHA decreases 2H5-22:6n-3 accumulation
DHA synthesized from its precursor 2H5-18:3n-3 was greatly decreased in rats fed with the DHA diet compared to rats fed the control diet over the entire experimental period, as seen in Figure 1 for rat liver (P < 0.05) and plasma (P < 0.01), and Figure 2 for heart (P < 0.05) and brain (P < 0.01). The maximal amount of 2H5-22:6n-3 in the control group and DHA group, expressed as a percentage of the dosed 2H5-18:3n-3, were as follows: plasma, 0.14% vs. 0.04%, at 24 and 96 h; liver, 2.2% vs. 0.6%, at 24 and 8 h; heart, 0.08% vs. 0.03%, at 240 h; brain, 0.10% vs. 0.03%, at 360 and 600 h, respectively. The 2H5-22:6n-3 in the two dietary groups reached their maximal values at similar time points except in liver where the DHA diet group reached its maxima at 8 h. The generally higher maximal amounts of 2H5-22:6n-3 in the control group engendered a greater slope in both the appearance and decay phases of the time courses.
Figure 1.
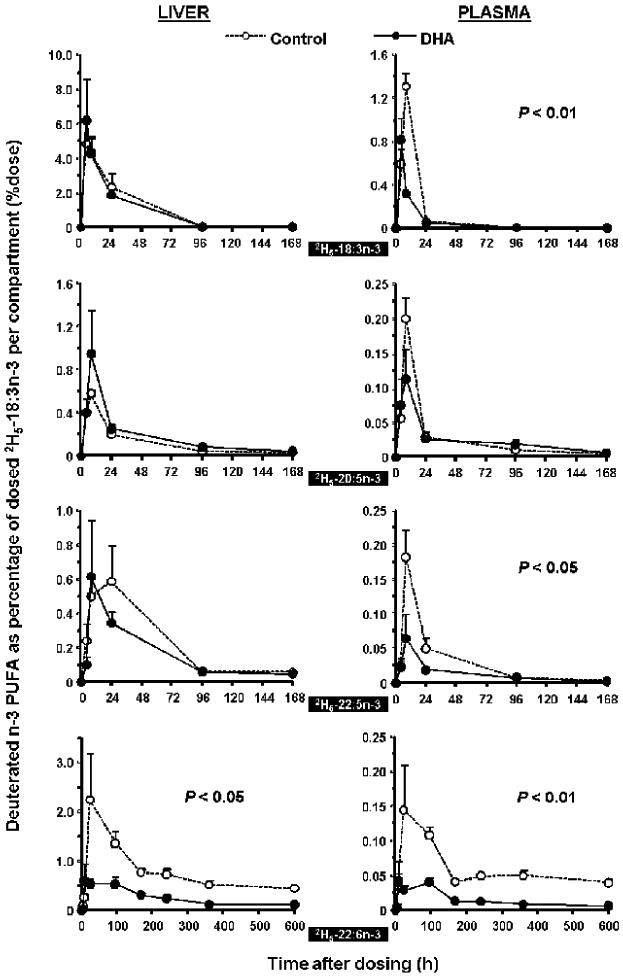
Time-course curves of the labeled n-3 fatty acids in rat liver (L) and plasma (R) after a single oral dosage of 2H5-18:3n-3 in the control diet group (□) and DHA diet group (■). Values were expressed as % dose per compartment as a function of time over 600 h (mean ± SEM, n=4). Repeated measures ANOVA with diet as a between-group factor was performed to determine the significant difference with a P value of 0.05 or lower.
Figure 2.
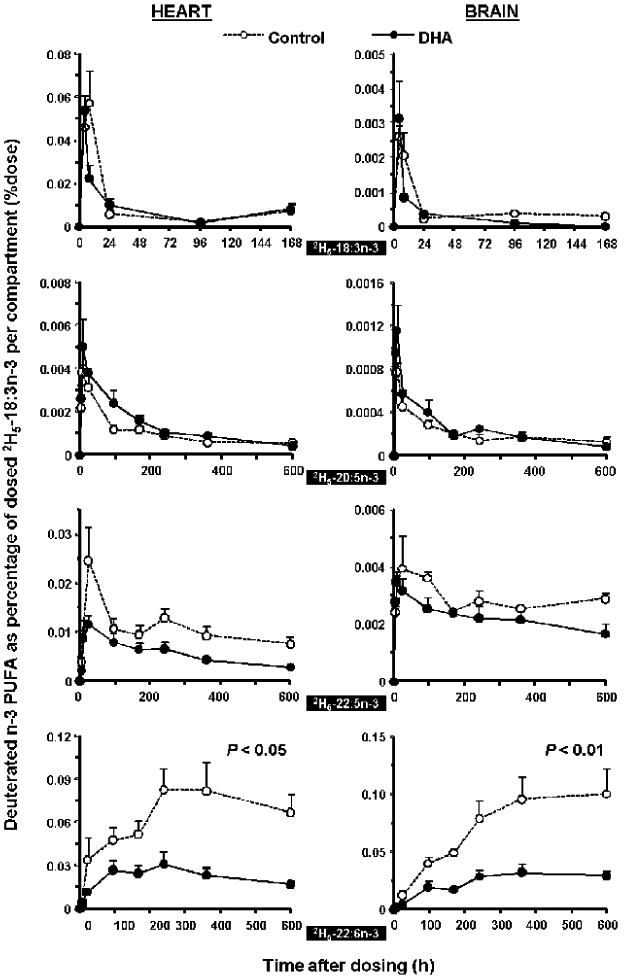
Time-course curves of the labeled n-3 fatty acids in rat heart (L) and brain (R) after a single oral dosage of 2H5-18:3n-3. See legend to Figure 1 for details.
Statistical analyses of the time course curves for 2H5-22:5n-3 indicated no significant differences in brain, liver or heart although significance (P < 0.05) was detected in the plasma compartment (Figure 1). In plasma, there was a markedly higher level of 2H5-22:5n-3 accretion and what appeared to be a much faster appearance rate in the control diet group.
The absorption of precursor 2H5-18:3n-3 into the plasma was decreased in the DHA group and exhibited a much higher maximal value in the control group. In heart and brain, similar tendencies were observed although no significant changes were observed. The time point of the maximal concentration for 2H5-18:3n-3 was 4 h later in the control group in plasma and heart, but similar in the liver and brain.
No significance differences were observed in 2H5-20:5n-3 accretion between dietary groups although there was a tendency for a greater content in liver, heart and brain in the DHA group.
Few differences were observed for the accretion of the more minor n-3 and n-6 metabolites including 2H5-labeled -20:3n-3, -20:4n-3, -24:5n-3, -24:6n-3 in liver (Supplemental Figure 1). However, the accumulation of 2H5-24:5n-3 was significantly lower in brain. 2H5-24:6n-3 in the DHA diet group also had a similar tendency, albeit not significant.
Dietary DHA decreases 2H5-22:4n-6, 2H5-22:5n-6 and 2H5-20:4n-6 accumulation
Accumulation of 2H5-22:4n-6 and 2H5-22:5n-6 were greatly decreased in rat plasma, liver and heart in the DHA diet group (P < 0.05), as presented in Figure 3 and 4. The 2H5-22:5n-6 was a weak signal on the GC/MS ion chromatograms at this dose of 2H5-18:2n-6 in the control group and difficult to detect in the DHA group. 2H5-20:4n-6 was lower in plasma (P < 0.05) and exhibited a similar tendency in liver, heart and brain in the DHA group. No difference was detected for 2H5-20:2n-6. Deuterated C24 n-6 fatty acids could not be quantified except in the brain (Supplemental Figure 1). 2H5-24:4n-6 was detected in brain in both dietary groups with a tendency of a greater maximal value of 7.8 ppm vs. 5.7 ppm of 2H5-18:2n-6 dose for the control group and the DHA group, respectively. A similar situation was observed for 2H5-24:5n-6.
Figure 3.
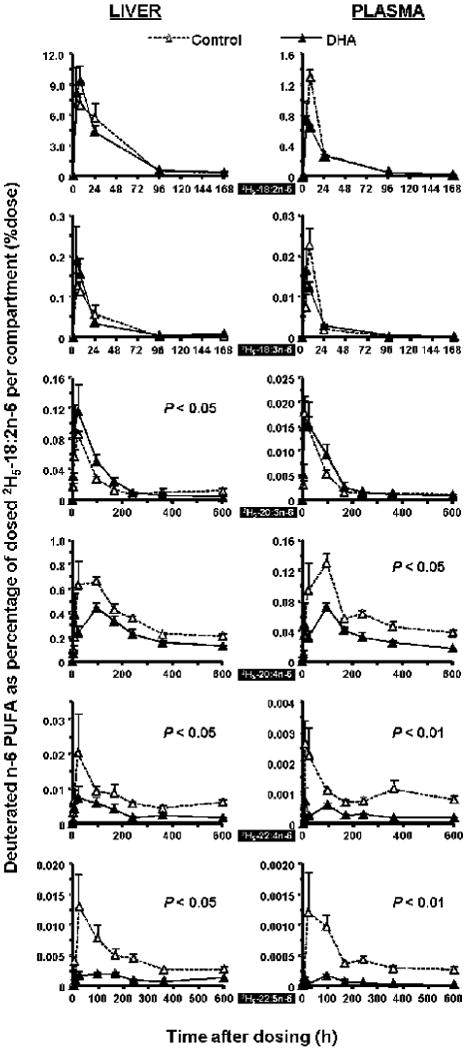
Time-course curves of the labeled n-6 fatty acids in rat liver (L) and plasma (R) after a single oral dosage of 2H5-18:2n-6. See legend to Figure 1 for details.
Figure 4.
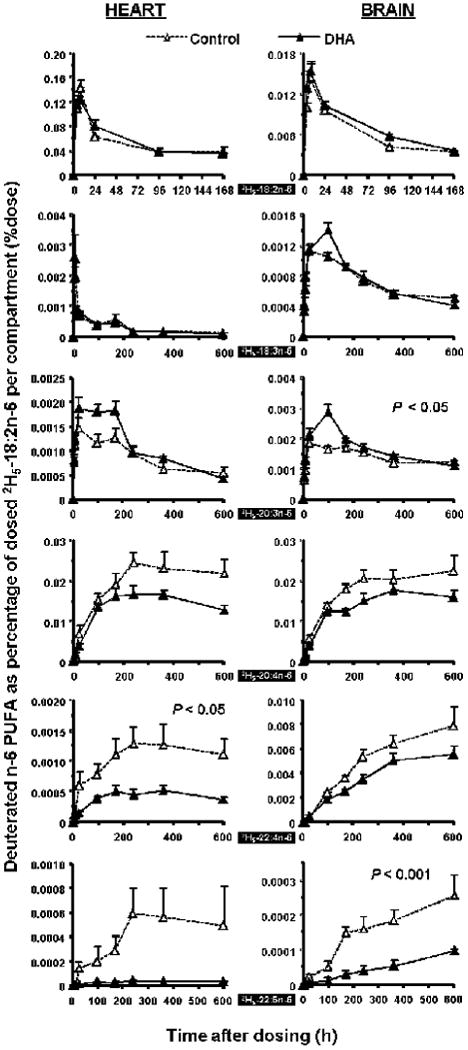
Time-course curves of the labeled n-6 fatty acids in rat heart (L) and brain (R) after a single oral dosage of 2H5-18:2n-6. N/A indicates not available. See legend to Figure 1 for details.
Dietary DHA increased accumulation of 2H5-20:3n-6 in rat liver and brain
There was a significant increase in 2H5-20:3n-6 in liver and brain in the DHA diet group (P < 0.05). In plasma, 2H5-18:2n-6 and its first metabolite 2H5-18:3n-6 had similar accretion in the two dietary groups. The 2H5-18:3n-6 could not be quantified in the rat heart and brain due to trace level signals.
Deuterium enrichment comparisons between diets
The concentrations of the stable isotope precursors and their metabolites were combined with measurements of the respective endogenous fatty acids and expressed as enrichment, i.e., the tracer divided by the tracee. A summary of the comparison of the main fatty acids enrichment between the two dietary groups is presented in Table 4. For 2H5- 22:6n-3, the tracee was decreased in the DHA group and coupled with an increase in the endogenous DHA pool leading to a very significant decline in the enrichment in 2H5-22:6n-3 in all tissues examined. Both 2H5-20:5n-3 and 2H5-22:5n-3 enrichments were also significantly decreased in the DHA group. This was in part due to the greater denominator, since the non-labeled 20:5n-3 and 22:5n-3 pools were generally increased in the tissues. The effect on enrichment using this measure, the area under the time course curves, was somewhat greater than that resulting from the increased pool sizes of these two n-3 fatty acids. In brain, there was a significant decline in the 2H5-20:4n-6 and 2H5-22:5n-6 enrichments in the DHA group and 2H5-22:5n-6 enrichment also declined in the plasma.
TABLE 4. Comparison of area under the time-course curves for enrichment of n-3 and n-6 HUFAs.
| Tissues | Fatty Acids | AUC0→600h (mol/mol%×h) | ||
|---|---|---|---|---|
| Control Diet | DHA Diet | |||
| Plasma | 20:5n-3 | 618.1 ± 39.5 | 281.4 ± 23.3 | *** |
| 22:5n-3 | 735.7 ± 28.7 | 325.8 ± 21.8 | *** | |
| 22:6n-3 | 408.1 ± 28.0 | 92.5 ± 6.0 | *** | |
| 20:3n-6 | 175.5 ± 5.7 | 156.8 ± 16.6 | ||
| 20:4n-6 | 81.2 ± 7.9 | 71.1 ± 6.9 | ||
| 22:4n-6 | 103.3 ± 5.5 | 94.7 ± 8.3 | ||
| 22:5n-6 | 61.2 ± 4.4 | 35.2 ± 6.7 | * | |
| Liver | 20:5n-3 | 350.9 ± 16.9 | 168.7 ± 18.8 | *** |
| 22:5n-3 | 364.1 ± 29.4 | 189.1 ± 17.5 | ** | |
| 22:6n-3 | 234.2 ± 12.0 | 60.2 ± 5.0 | *** | |
| 20:3n-6 | 79.4 ± 11.1 | 70.6 ± 8.5 | ||
| 20:4n-6 | 51.8 ± 3.1 | 46.6 ± 1.8 | ||
| 22:4n-6 | 56.4 ± 5.9 | 56.3 ± 5.5 | ||
| 22:5n-6 | 32.7 ± 2.4 | 24.4 ± 4.0 | ||
| Heart | 20:5n-3 | 538.4 ± 64.8 | 265.3 ± 4.6 | ** |
| 22:5n-3 | 600.1 ± 92.1 | 330.5 ± 19.5 | * | |
| 22:6n-3 | 387.8 ± 49.3 | 87.9 ± 10.6 | *** | |
| 20:3n-6 | 146.4 ± 20.5 | 142.8 ± 10.3 | ||
| 20:4n-6 | 62.2 ± 6.2 | 56.8 ± 0.5 | ||
| 22:4n-6 | 90.2 ± 11.1 | 82.2 ± 2.4 | ||
| 22:5n-6 | 28.3 ± 8.7 | 8.0 ± 1.0 | NA | |
| Brain | 20:5n-3 | 189.6 ± 26.8 | 105.5 ± 6.9 | * |
| 22:5n-3 | 378.6 ± 24.7 | 221.9 ± 21.2 | ** | |
| 22:6n-3 | 104.0 ± 9.6 | 32.8 ± 4.0 | *** | |
| 20:3n-6 | 75.2 ± 2.4 | 75.0 ± 4.5 | ||
| 20:4n-6 | 38.9 ± 1.4 | 31.7 ± 1.2 | ** | |
| 22:4n-6 | 34.0 ± 1.5 | 26.9 ± 1.2 | ** | |
| 22:5n-6 | 9.6 ± 0.7 | 5.2 ± 1.1 | * | |
AUC values were presented as mean ± SEM (n=4).
Two-tailed, unpaired t-test determined the significant difference between diet groups at P value of 0.05*, 0.01**, 0.001 or lower ***.
NA indicates not available.
Discussion
There are few studies of EFA metabolism wherein the diet is well controlled and adequately described. It is critical that dietary studies entail a single variable such as in the present study where DHA was added to a diet that contained adequate levels of both 18:2n-6 and 18:3n-3. Since competition between n-3 and n-6 fatty acids, for example, is well known, fatty acid metabolic studies that don't carefully prescribe the levels of these fatty acids in the diet may be irreproducible and difficult to interpret.
When 1.3% of the dietary fatty acid weight is provided as DHA, there is a marked increase in DHA content in all tissues studies. This increase was quite sizeable in peripheral tissues like plasma, liver and heart but was modest in the brain. This is consistent with previous reports that the adult mammalian brain is fairly resistant to EFA compositional changes after the PUFAs are laid down (25). The 20:5n-3 also increased in the plasma and liver of the order of about three-fold but still comprised only 1.1-1.7% of the total fatty acids. The levels of 20:5n-3 in the heart and brain were very small with respect to the DHA content, the principal n-3 fatty acid in these organs. Accretion of 20:5n-3 has been observed in human studies after a DHA supplement (26-28). This has been ascribed to retroconversion from partial β-oxidation of DHA (29,30). Similar retroconversion to 20:5n-3 is reported in rats after a 22:5n-3 supplement (31). This result indicates the dietary DHA may also serve as a source of 20:5n-3, as previously suggested in other studies (26,32) suggesting that a supplement of both 20:5n-3 and DHA may not be necessary to increase levels of n-3 HUFAs. As has often been observed (33,34), this increased level of n-3 HUFAs was accompanied by a decrease in 20:4n-6 and other n-6 HUFAs, including 22:4n-6 and 22:5n-6.
Accompanying this increase in organ DHA was a marked decrease in the accumulation of the newly synthesized HUFA in liver and some extrahepatic tissues in adult rats. Preformed DHA suppressed the accumulation of 2H5-DHA and 2H5-22:5n-3 derived from 2H5-18:3n-3 and also the 2H5-22:4n-6 and 2H5-22:5n-6 derived from 2H5-18:2n-6. However, the accumulation of the 2H5-18:3n-3, 2H5-18:2n-6, as well as their intermediate metabolites showed little difference with or without performed DHA in diet. These results are consistent with the hypothesis that Δ6 desaturase is unaffected by the addition of DHA to the diet, while the data does suggest a decreased activity of Δ5 desaturase. An additional observation that provides some support for this notion is the observed small but statistically significant increase in 20:3n-6 in all tissues studied. In liver and brain, this difference in content was accompanied by an increase in the deuterated intermediate in the DHA diet condition (Figures 3 and 4). There was no evidence of an increase in the Δ5 desaturase product, 2H5-20:4n-6 in the DHA diet, in fact, the 2H5-20:4n-6 had increased in plasma and the tissue content of the unlabeled compound had decreased in all tissues.
One of the most notable observations in this study is the very marked decline in 2H5-18:3n-3 incorporation into 2H5-DHA in the DHA treated animals in all tissues studies, including the brain. It is of interest to follow the deuterium through both the n-3 and n-6 pathways to see where this phenomenon is first observed. No statistically significant changes were observed at the level of 2H5-20:5n-3 and only in plasma for its elongation product, 2H5-22:5n-3. In the brain only the 2H5-24:5n-3 was less in the DHA diet group and no differences could be observed (albeit with very low level signals) for 2H5-24:6n-3. In the n-6 pathway, the effects of the DHA diet became apparent in three of the four tissues for both 2H5-22:4n-6 and 2H5-22:5n-6 and could not be observed in the C24 PUFAs of the brain. Thus there is evidence of a decrease in the net formation of the Δ5 desaturase products subsequent to their elongation that continues, for the most part, afterwards. Dietary PUFA, except for 18:2n-6, are likely to induce fatty acid oxidation enzymes via peroxisome proliferator-activated receptor α (PPARα) as a “feed-forward” mechanism (35).
Previous investigations have suggested that a variety of LC-PUFA including DHA and 20:5n-3 (36,37) or DHA and docosapentaenoic acid (22:5n-6) (38) or DHA and 20:4n-6 (39) exert feedback regulation on the accumulation of HUFA. The mechanism of this feedback effect from fish oil may be through reduction of liver microsomal enzymatic activity (40) or down-regulation of the hepatic abundance of Δ5, or Δ6 desaturase mRNA (41,42). Two transcriptional factors, sterol regulatory element binding protein-1c (SREBP-1c) (43) and PPARα (44) are involved in the feedback regulation exerted by PUFAs. In these studies, the Δ5 and Δ6 desaturases may be induced by fat-free diets, addition of EPA/DHA from fish oil then leads to lower levels of activity. However, no study has isolated the effects of DHA on the de novo metabolism of EFAs of both the n-6 and n-3 pathways.
It is also of interest to note that although there was a much smaller AUC for 2H5-DHA in all tissues examined in the DHA dietary group, there was no reduction in tissue content of 24:5n-3 or 24:6n-3 in those tissues where they could be measured (brain and liver). This may suggest that a decrement in delta-6 desaturase activity is not the explanation for the changes in 2H5-DHA accumulation in tissues. This was supported by preliminary observations of primary hepatocytes where no decrease in delta-6 desaturase activity measured in vitro was observed in the DHA fed group relative to the control diet. One possible explanation is that the rate of conversion of 24:6n-3 to DHA may be inhibited in the DHA supplemented group.
Supplementary Material
Time-course curves of 2H5-labeled minor fatty acids in rat liver (L) and brain (R). See legend to Figure 1 for details.
Acknowledgments
The authors wish to acknowledge Mr. Marshall Jones and Dr. Lee Chedester for their expert assistance with the animal work.
Funding source: This project was funded by the Intramural Research Program of the National Institute on Alcohol Abuse and Alcoholism, National Institutes of Health.
Abbreviations
- BHT
butylated hydroxytoluene
- DHA
docosahexaenoic acid
- EFA
essential fatty acid
- GC
gas liquid chromatography
- HUFA
highly unsaturated fatty acids (≥C20 and containing three or more double bonds)
- LC-PUFA
long chain polyunsaturated fatty acid
- MS
mass spectrometry
- NCI
negative chemical ionization
Footnotes
Publisher's Disclaimer: This is a PDF file of an unedited manuscript that has been accepted for publication. As a service to our customers we are providing this early version of the manuscript. The manuscript will undergo copyediting, typesetting, and review of the resulting proof before it is published in its final citable form. Please note that during the production process errors may be discovered which could affect the content, and all legal disclaimers that apply to the journal pertain.
References
- 1.Voss A, Reinhart M, Sankarappa S, Sprecher H. The metabolism of 7,10,13,16,19-docosapentaenoic acid to 4,7,10,13,16,19-docosahexaenoic acid in rat liver is independent of a 4-desaturase. J Biol Chem. 1991;266:19995–20000. [PubMed] [Google Scholar]
- 2.Lin YH, Salem N., Jr Whole body distribution of deuterated linoleic and alpha-linolenic acids and their metabolites in the rat. J Lipid Res. 2007 doi: 10.1194/jlr.M700369-JLR200. [DOI] [PubMed] [Google Scholar]
- 3.Cunnane SC, Anderson MJ. The majority of dietary linoleate in growing rats is beta-oxidized or stored in visceral fat. J Nutr. 1997;127:146–152. doi: 10.1093/jn/127.1.146. [DOI] [PubMed] [Google Scholar]
- 4.Brenna JT. Efficiency of conversion of alpha-linolenic acid to long chain n-3 fatty acids in man. Curr Opin Clin Nutr Metab Care. 2002;5:127–132. doi: 10.1097/00075197-200203000-00002. [DOI] [PubMed] [Google Scholar]
- 5.Sinclair AJ. Incorporation of radioactive polyunsaturated fatty acids into liver and brain of developing rat. Lipids. 1975;10:175–184. doi: 10.1007/BF02534156. [DOI] [PubMed] [Google Scholar]
- 6.Su HM, Bernardo L, Mirmiran M, Ma XH, Corso TN, Nathanielsz PW, Brenna JT. Bioequivalence of dietary alpha-linolenic and docosahexaenoic acids as sources of docosahexaenoate accretion in brain and associated organs of neonatal baboons. Pediatr Res. 1999;45:87–93. doi: 10.1203/00006450-199901000-00015. [DOI] [PubMed] [Google Scholar]
- 7.Lefkowitz W, Lim SY, Lin YH, Salem N. Where does the developing brain obtain its docosahexaenoic acid? Relative contributions of dietary alpha-linolenic acid, docosahexaenoic acid, and body stores in the developing rat. Pediatric Research. 2005;57:157–165. doi: 10.1203/01.PDR.0000147572.57627.AE. [DOI] [PubMed] [Google Scholar]
- 8.DeMar JC, Jr, DiMartino C, Baca AW, Lefkowitz W, Salem N., Jr Effect of dietary docosahexaenoic acid on biosynthesis of docosahexaenoic acid from alpha-linolenic acid in young rats. J Lipid Res. 2008;49:1963–1980. doi: 10.1194/jlr.M800117-JLR200. [DOI] [PMC free article] [PubMed] [Google Scholar]
- 9.Birch DG, Birch EE, Hoffman DR, Uauy RD. Retinal development in very-low-birth-weight infants fed diets differing in omega-3 fatty acids. Invest Ophthalmol Vis Sci. 1992;33:2365–2376. [PubMed] [Google Scholar]
- 10.Neuringer M. Infant vision and retinal function in studies of dietary long-chain polyunsaturated fatty acids: methods, results, and implications. Am J Clin Nutr. 2000;71:256S–267S. doi: 10.1093/ajcn/71.1.256S. [DOI] [PubMed] [Google Scholar]
- 11.Fleith M, Clandinin MT. Dietary PUFA for preterm and term infants: review of clinical studies. Crit Rev Food Sci Nutr. 2005;45:205–229. doi: 10.1080/10408690590956378. [DOI] [PubMed] [Google Scholar]
- 12.Cheatham CL, Colombo J, Carlson SE. N-3 fatty acids and cognitive and visual acuity development: methodologic and conceptual considerations. Am J Clin Nutr. 2006;83:1458S–1466S. doi: 10.1093/ajcn/83.6.1458S. [DOI] [PubMed] [Google Scholar]
- 13.Makrides M, Gibson RA, Udell T, Ried K. Supplementation of infant formula with long-chain polyunsaturated fatty acids does not influence the growth of term infants. Am J Clin Nutr. 2005;81:1094–1101. doi: 10.1093/ajcn/81.5.1094. [DOI] [PubMed] [Google Scholar]
- 14.Hoffman DR, Boettcher JA, ersen-Schade DA. Toward optimizing vision and cognition in term infants by dietary docosahexaenoic and arachidonic acid supplementation: a review of randomized controlled trials. Prostaglandins Leukot Essent Fatty Acids. 2009;81:151–158. doi: 10.1016/j.plefa.2009.05.003. [DOI] [PubMed] [Google Scholar]
- 15.Lands WE, Inoue M, Sugiura Y, Okuyama H. Selective incorporation of polyunsaturated fatty acids into phosphatidylcholine by rat liver microsomes. J Biol Chem. 1982;257:14968–14972. [PubMed] [Google Scholar]
- 16.Dyerberg J, Bang HO. Haemostatic function and platelet polyunsaturated fatty acids in Eskimos. Lancet. 1979;2:433–435. doi: 10.1016/s0140-6736(79)91490-9. [DOI] [PubMed] [Google Scholar]
- 17.Reeves PG, Nielsen FH, Fahey GC., Jr AIN-93 purified diets for laboratory rodents: final report of the American Institute of Nutrition ad hoc writing committee on the reformulation of the AIN-76A rodent diet. J Nutr. 1993;123:1939–1951. doi: 10.1093/jn/123.11.1939. [DOI] [PubMed] [Google Scholar]
- 18.Moriguchi T, Salem N., Jr Recovery of brain docosahexaenoate leads to recovery of spatial task performance. J Neurochem. 2003;87:297–309. doi: 10.1046/j.1471-4159.2003.01966.x. [DOI] [PubMed] [Google Scholar]
- 19.Folch AC, Lees M, Sloane-Stanley GM. A simple method for isolation and purification of total lipids from animal tissues. J Biol Chem. 1957;226:497–509. [PubMed] [Google Scholar]
- 20.Morrison WR, Smith LM. Preparation of fatty acid methyl esters and dimethyl acetals from lipids with boron tri-fluoride-methanol. J Lipid Res. 1964;5:600–608. [PubMed] [Google Scholar]
- 21.Salem N, Jr, Reyzer M, Karanian J. Losses of arachidonic acid in rat liver after alcohol inhalation. Lipids. 1996;31 Suppl:S153–S156. doi: 10.1007/BF02637068. [DOI] [PubMed] [Google Scholar]
- 22.Pawlosky RJ, Sprecher HW, Salem N., Jr High sensitivity negative ion GC-MS method for detection of desaturated and chain-elongated products of deuterated linoleic and linolenic acids. J Lipid Res. 1992;33:1711–1717. [PubMed] [Google Scholar]
- 23.Lin YH, Salem N., Jr A technique for the in vivo study of multiple stable isotope-labeled essential fatty acids. Prostaglandins Leukot Essent Fatty Acids. 2002;67:141–146. doi: 10.1054/plef.2002.0411. [DOI] [PubMed] [Google Scholar]
- 24.Yeh KC, Kwan KC. A comparison of numerical integrating algorithms by trapezoidal, Lagrange, and spline approximation. J Pharmacokinet Biopharm. 1978;6:79–98. doi: 10.1007/BF01066064. [DOI] [PubMed] [Google Scholar]
- 25.Bourre JM, Francois M, Youyou A, Dumont O, Piciotti M, Pascal G, Durand G. The effects of dietary alpha-linolenic acid on the composition of nerve membranes, enzymatic activity, amplitude of electrophysiological parameters, resistance to poisons and performance of learning tasks in rats. J Nutr. 1989;119:1880–1892. doi: 10.1093/jn/119.12.1880. [DOI] [PubMed] [Google Scholar]
- 26.von Schacky C, Weber PC. Metabolism and effects on platelet function of the purified eicosapentaenoic and docosahexaenoic acids in humans. J Clin Invest. 1985;76:2446–2450. doi: 10.1172/JCI112261. [DOI] [PMC free article] [PubMed] [Google Scholar]
- 27.Hansen JB, Grimsgaard S, Nilsen H, Nordoy A, Bonaa KH. Effects of highly purified eicosapentaenoic acid and docosahexaenoic acid on fatty acid absorption, incorporation into serum phospholipids and postprandial triglyceridemia. Lipids. 1998;33:131–138. doi: 10.1007/s11745-998-0188-8. [DOI] [PubMed] [Google Scholar]
- 28.Stark KD, Holub BJ. Differential eicosapentaenoic acid elevations and altered cardiovascular disease risk factor responses after supplementation with docosahexaenoic acid in postmenopausal women receiving and not receiving hormone replacement therapy. Am J Clin Nutr. 2004;79:765–773. doi: 10.1093/ajcn/79.5.765. [DOI] [PubMed] [Google Scholar]
- 29.Schlenk H, Sand DM, Gellerman JL. Retroconversion of docosahexaenoic acid in the rat. Biochim Biophys Acta. 1969;187:201–207. doi: 10.1016/0005-2760(69)90028-9. [DOI] [PubMed] [Google Scholar]
- 30.Stoffel W, Eker, Assad H, Sprecher H. Enzymatic studies on the mechanism of the retroconversion of C22-polyenoic fatty acids to their C20-homologues. Hoppe Seylers Z Physiol Chem. 1970;351:1545–1554. doi: 10.1515/bchm2.1970.351.2.1545. [DOI] [PubMed] [Google Scholar]
- 31.Kaur G, Begg DP, Barr D, Garg M, Cameron-Smith D, Sinclair AJ. Br J Nutr. 2009. Short-term docosapentaenoic acid (22 : 5 n-3) supplementation increases tissue docosapentaenoic acid, DHA and EPA concentrations in rats; pp. 1–6. [DOI] [PubMed] [Google Scholar]
- 32.Conquer JA, Holub BJ. Dietary docosahexaenoic acid as a source of eicosapentaenoic acid in vegetarians and omnivores. Lipids. 1997;32:341–345. doi: 10.1007/s11745-997-0043-y. [DOI] [PubMed] [Google Scholar]
- 33.Abedin L, Lien EL, Vingrys AJ, Sinclair AJ. The effects of dietary alpha-linolenic acid compared with docosahexaenoic acid on brain, retina, liver, and heart in the guinea pig. Lipids. 1999;34:475–482. doi: 10.1007/s11745-999-0387-3. [DOI] [PubMed] [Google Scholar]
- 34.Morise A, Combe N, Boue C, Legrand P, Catheline D, Delplanque B, Fenart E, Weill P, Hermier D. Dose effect of alpha-linolenic acid on PUFA conversion, bioavailability, and storage in the hamster. Lipids. 2004;39:325–334. doi: 10.1007/s11745-004-1236-0. [DOI] [PubMed] [Google Scholar]
- 35.Nakamura MT, Cheon Y, Li Y, Nara TY. Mechanisms of regulation of gene expression by fatty acids. Lipids. 2004;39:1077–1083. doi: 10.1007/s11745-004-1333-0. [DOI] [PubMed] [Google Scholar]
- 36.Igarashi M, Ma K, Chang L, Bell JM, Rapoport SI, DeMar JC., Jr Low liver conversion rate of alpha-linolenic to docosahexaenoic acid in awake rats on a high-docosahexaenoate-containing diet. J Lipid Res. 2006;47:1812–1822. doi: 10.1194/jlr.M600030-JLR200. [DOI] [PubMed] [Google Scholar]
- 37.Burdge GC, Finnegan YE, Minihane AM, Williams CM, Wootton SA. Effect of altered dietary n-3 fatty acid intake upon plasma lipid fatty acid composition, conversion of [13C]alpha-linolenic acid to longer-chain fatty acids and partitioning towards beta-oxidation in older men. Br J Nutr. 2003;90:311–321. doi: 10.1079/bjn2003901. [DOI] [PubMed] [Google Scholar]
- 38.Tam PS, Umeda-Sawada R, Yaguchi T, Akimoto K, Kiso Y, Igarashi O. The metabolism and distribution of docosapentaenoic acid (n-6) in rats and rat hepatocytes. Lipids. 2000;35:71–75. doi: 10.1007/s11745-000-0496-z. [DOI] [PubMed] [Google Scholar]
- 39.Sarkadi-Nagy E, Wijendran V, Diau GY, Chao AC, Hsieh AT, Turpeinen A, Lawrence P, Nathanielsz PW, Brenna JT. Formula feeding potentiates docosahexaenoic and arachidonic acid biosynthesis in term and preterm baboon neonates. J Lipid Res. 2004;45:71–80. doi: 10.1194/jlr.M300106-JLR200. [DOI] [PubMed] [Google Scholar]
- 40.Christiansen EN, Lund JS, Rortveit T, Rustan AC. Effect of dietary n-3 and n-6 fatty acids on fatty acid desaturation in rat liver. Biochim Biophys Acta. 1991;1082:57–62. doi: 10.1016/0005-2760(91)90299-w. [DOI] [PubMed] [Google Scholar]
- 41.Tang C, Cho HP, Nakamura MT, Clarke SD. Regulation of human delta-6 desaturase gene transcription: identification of a functional direct repeat-1 element. J Lipid Res. 2003;44:686–695. doi: 10.1194/jlr.M200195-JLR200. [DOI] [PubMed] [Google Scholar]
- 42.Cho HP, Nakamura M, Clarke SD. Cloning, expression, and fatty acid regulation of the human delta-5 desaturase. J Biol Chem. 1999;274:37335–37339. doi: 10.1074/jbc.274.52.37335. [DOI] [PubMed] [Google Scholar]
- 43.Xu J, Nakamura MT, Cho HP, Clarke SD. Sterol regulatory element binding protein-1 expression is suppressed by dietary polyunsaturated fatty acids. A mechanism for the coordinate suppression of lipogenic genes by polyunsaturated fats. J Biol Chem. 1999;274:23577–23583. doi: 10.1074/jbc.274.33.23577. [DOI] [PubMed] [Google Scholar]
- 44.Li Y, Nara TY, Nakamura MT. Peroxisome proliferator-activated receptor alpha is required for feedback regulation of highly unsaturated fatty acid synthesis. J Lipid Res. 2005;46:2432–2440. doi: 10.1194/jlr.M500237-JLR200. [DOI] [PubMed] [Google Scholar]
Associated Data
This section collects any data citations, data availability statements, or supplementary materials included in this article.
Supplementary Materials
Time-course curves of 2H5-labeled minor fatty acids in rat liver (L) and brain (R). See legend to Figure 1 for details.