

Abstract
Purpose
To assess the normal variations in retinal nerve fiber layer (RNFL) thickness measured with optical coherence tomography (OCT).
Subjects and Methods
Both eyes of 48 individuals (age 56.4±9.5 y) with normal vision and refractive errors between ±6.0D were tested with the fast RNFL scan protocol of the OCT3 (Zeiss Meditech). Their 256-point RNFL profiles were exported for analysis. The location and peak amplitude of the maxima of the RNFL profiles were measured. Intersubject and interocular variations were assessed with a coefficient of determination, R2. An R2 of 1.0 indicated that the average profile from all 48 individuals (or of the 2 eyes) accounted for 100% of the variation of an individual eye’s profile.
Results
The R2 for the interocular comparison was good, with averages of 0.91±0.07 (right eye) and 0.92±0.05 (left eye). The R2 for the comparison of the individual’s profile to the mean group profile was only 0.61±0.29 (right eye) and 0.65±0.24 (left eye), with 27% of the R2 values below 0.5. Even after normalizing each individual’s profile by its mean, R2 was only 0.75±0.16 (0.75±0.16) for the right (left) eye. The location of the peaks for the right (left) eye ranged over 91 degrees (88 degrees) for the superior peak and over 64 degrees (66 degrees) for the inferior peak. The range of peak amplitudes for the right (left) eye spanned a factor of 1.7 (1.8) and 2.0 (1.7) for the superior and inferior peaks, respectively.
Conclusions
There was a wide variation in the amplitude and shape of the individual RNFL profiles. However, the RNFL profiles of the 2 eyes of an individual were extremely similar. Adding an interocular comparison with OCT RNFL tests should help identify some false positives.
Keywords: glaucoma, optical coherence tomography, OCT, RNFL
Glaucoma, a progressive optic neuropathy, causes damage to retinal ganglion cells and their axons. The progressive loss of retinal ganglion cell axons results in a thinning of the retinal nerve fiber layer (RNFL). Recently, noninvasive techniques have been developed for in vivo measurement of the RNFL thickness near the optic disc. For example, the techniques based on optical coherence tomography (OCT) use light interference to create cross-sectional measurements on the order of micrometers. With the OCT technique, the thickness of the RNFL for a circular path around the disc can be measured and the resulting RNFL thickness profile can be compared with the normative group data.
Although, in general, the sensitivity and specificity of the OCT RNFL for detecting glaucomatous damage is good,1–15 the technique is relatively new and it is likely that both the sensitivity and specificity can be improved. One avenue for improving specificity lies in a better understanding of the variations in the RNFL thickness profiles among individuals with normal vision.
Although individual RNFL profiles are highly reproducible when scans are repeated within or across sessions,16–19 a variety of factors influence the interindividual variation in amplitude and waveform of the RNFL profile. Overall amplitude decreases with age,20–24 poor signal strength,25 low analysis confidence,25,26 and increases with disc size,21,22,27 whereas the shape of the RNFL profile is affected by refractive error.23,28,29 Furthermore, waveforms can vary owing to errors caused by operator inexperience, such as poor centering of the optic disc. The purpose of this study was to quantify the variation in RNFL profiles among normal subjects under conditions designed to minimize measurement errors and to compare this interindividual variability to interocular differences between the 2 eyes of these same individuals. Preliminary results were presented at the 2007 Meeting of the Association for Research in Vision and Ophthalmology.
MATERIALS AND METHODS
Subjects
Forty-eight individuals, 39 to 72 years of age (mean 56.4±9.5), participated in the study. These individuals were recruited, in part, from laboratory and departmental personnel at Columbia University and New York Eye and Ear In. firmary, and, in part, via an e-mail advertisement at Columbia University. Each subject received a complete ophthalmologic assessment. No subject had any known abnormalities of the visual system. Additionally, they had normal fundus examinations, intraocular pressures of 21mm Hg or less, corrected visual acuities of ≥ 20/20, and refractive errors between ±6.0 D. Subjects with a history of ocular diseases, diabetes, or risk of glaucoma were excluded from the study. Informed consent was obtained from all subjects before their participation. Procedures followed the tenets of the Declaration of Helsinki and the protocol was approved by the Institutional Board of Research Associates of Columbia University.
OCT
For both eyes of all 48 individuals, the thickness of the RNFL was obtained using the Fast RNFL Thickness acquisition protocol on Stratus OCT (Model 3000, Carl Zeiss Meditec, Humphrey Division, Dublin, CA) using version 4.0 software. Pupils were not dilated. During a single test with the fast protocol, 3 circular scans, 3.4mm in diameter, were taken around the optic disc. Steps were taken to minimize measurement error. All scans were required to be properly centered around the optic disc. In addition, scans that the software deemed as low confidence and scans with a signal intensity of less than 6 were rejected. If more than one test satisfied these criteria, then the test with the highest signal strength was selected and the 256 points of the RNFL profile were exported. Between 1 and 6 high-quality tests were completed for each eye during each visit, with 67% of the eyes having more than 1 test. Thirteen individuals underwent repeat testing on a subsequent date to rule out intersession variability.
A Quantitative Comparison of RNFL Profiles
To quantify the degree of agreement among RNFL profiles, we calculated the coefficient of determination, R2. In particular,
| (1) |
where xi is the RNFL thickness for a particular eye at point i, x̄i is the mean of the 256 points for that eye, and T is a template that is the mean of the 48 individual RNFL profiles. Note that R2 is the proportion of the variance accounted for by the group template. An R2 of 0 indicates a fit so poor that the mean of the data does as well as the template in describing the profile and an R2 of 1.0 indicates a perfect fit to the template.
Two other R2 statistics were determined. To examine a change in waveform of the RNFL profile independent of overall amplitude, R2 (norm) was calculated with equation 1 after first dividing the 256 points of each eye by the mean of these points, x̄i.
To compare the 2 eyes, R2 (inter) was calculated using equation 1 with T taken as the mean RNFL profile for the 2 eyes of an individual.
False Positives
To identify false positives, a criterion, previously shown to produce good sensitivity and specificity, was used.4 In particular, an eye was classified as abnormal if either hemifield was abnormal. An abnormal hemifield was defined as one with 2 or more clock hour sectors at 5% (yellow) or one or more at 1% (red). For this analysis, clock hours 9 and 3 were omitted.
RESULTS
The black curves in Figure 1 are the mean RNFL profiles (“group template”) for all 48 right (panel A) and left (panel B) eyes. The gray curves in Figure 1 are the individual RNFL profiles for all 48 individuals. The waveform of the RNFL profile showed considerable variability across individuals. For example, notice how the amplitudes and location of the peaks in the RNFL profiles vary among individuals.
FIGURE 1.

A, The RNFL thickness of all 48 individuals’ right eyes as a function of distance (in degrees) around the optic nerve head starting at the temporal most point (9 o’clock of the right eye). The black curve is the average of all 48 individual RNFL profiles. B, As in A for the left eyes.
The mean RNFL profiles in Figure 1 show prominent peaks in the superior (0 to 180 degrees) and inferior (180 to 360 degrees) regions of the disc. The amplitude and location of these primary peaks varied among individuals, a measure of which can be seen in Figure 2. Figures 2A and B show the amplitude of the peak RNFL thickness of the right eye plotted against the amplitude of the peak of the left eye for the superior (panel A) and inferior (panel B) disc regions. (The meaning of the filled symbols will be explained below.) On average, the superior peak amplitudes for the right (left) eyes were 154.7 (154.1)±18.8 (18.2) μm, whereas the inferior peak amplitudes were 159.6 (161.3)±23.8 (18.5) μm. There are 2 aspects of these results worth noting. First, the peak amplitudes of the 2 eyes for each subject showed reasonable agreement as the points fall around the diagonal line of slope 1.0 in Figures 2A and B. The Spearman rank correlations were 0.65 and 0.69 for the superior (panel A) and inferior (panel B) peaks, respectively. Second, there was a fairly wide range of peak amplitudes among the subjects. For the right (left) eyes, the peak amplitudes varied by a factor of 1.7 (1.8) and 2.0 (1.7) for the peaks in the superior and inferior regions, respectively.
FIGURE 2.

A, Amplitude of the peak in the superior portion of the RNFL profile of the right eye versus the amplitude of the superior peak in the left eye. B, Same as in A for the peaks in the inferior portion of the RNFL profiles. C, Location of the peak in the right eye versus the location of the peak in the left eye for both the superior (circles) and inferior (squares) peaks. Filled symbols indicate the peak was not the most temporally located maxima. D, Example of an individual’s RNFL profiles in which the peaks for the right (black) and left (gray) eyes were not the most temporally located maxima.
There was also variation in the location of the peaks. In Figure 2C, the locations of the superior (circles) and inferior (squares) peaks of the RNFL profiles for the right eyes are plotted against the locations for the left eye. The location of the superior peaks (circles) ranged over 91 degrees (ie, from 49.2 to 140.6 degrees) for the right eyes and over 88° (ie, from 50.6 to 139.2 degrees) for the left eyes, whereas the location of the inferior peaks (squares) ranged over 64 degrees (ie, from 239.1 to 303.8 degrees) for the right eyes and over 66 degrees (ie, from 236.2 to 302.3 degrees) for the left eyes. This large range of peak locations is, in part, because of the presence of 2 local maxima in each hemidisc. In 10 individuals, the local maxima with the peak amplitude were not the most temporally located one. In particular, notice that the average profiles, the templates, in Figure 1 contain 4 local maxima, 2 in each hemidisc with the more temporal maxima being the largest. Figure 2D illustrates an example in which the peak amplitude in the superior region is not associated with the most temporally located maximum. In 43 of the 48 hemifields of the right eye and 41 of the left eye, the peaks were associated with the more temporally located maxima. In the remaining 12 cases [5 (right eye) and 7 (left eye)], the peaks were associated with the more nasal maxima. The filled symbols in Figures 2A to C indicate that at least one of the eyes was in this group of 12 with the asterisks in Figure 2C indicating that both eyes were in this group. The filled symbols in Figure 2C tend to be the outliers.
If these filled symbols are omitted from Figure 2C, 2 points are worth noting. First, the locations of the peaks show reasonable interocular agreement; the points fall around the diagonal line of slope 1.0. The Spearman rank correlations were 0.59 and 0.55 for the superior and inferior peaks, respectively. Second, although the range of locations is markedly reduced if the filled symbols are excluded, there is still considerable variability among individuals. The location of the superior peaks now ranged over 38 degrees for the right eyes and over 46 degrees for the left eyes, whereas the location of the inferior peaks now ranged over 52 degrees for the right eyes and over 66 degrees for the left eyes.
Coefficient of Determination
Similarity Among RNFL Profiles of the 2 Eyes of an Individual
To quantify the degree of agreement between the overall RNFL profile for the right and left eyes of an individual, a coefficient of determination was calculated for each individual as described in the Methods section. The average R2 (inter) was 0.91±0.07 (right eye) and 0.92±0.05 (left eye), with 45 (right eye) and 46 (left eye) of the 50 individuals having R2 (inter) values greater than 0.80 and 36 (right eye) and 37 (left eye) with values greater than 0.90. The agreement between the 2 eyes was very good with over 90% of the variation between the 2 eyes accounted for by the average of the 2 RNFL profiles.
Variability Among Individual RNFL Profiles
To quantify the degree of agreement among the individual RNFL profiles, each was compared with the group average profile (the template) and R2 was calculated. For the 48 individuals, R2 ranged from −0.69 to 0.89 (right eye) and −0.03 to 0.90 (left eye). (A negative R2 indicates that the template accounts for less of the variance than does the mean of the individual’s profile.) Figure 3A shows the profiles of the 5 right eyes with the highest R2 values (best fit to template), which ranged from 0.85 to 0.89. The average of all RNFL profiles, the template (black curve), describes these individual profiles reasonably well. However, although some of the individual RNFL profiles were closely matched by the template, many were not. Figure 3B shows the profiles for the right eyes with the 5 lowest R2 values, or the worse fit to the template. Here R2 ranged from −0.69 to 0.21. These 5 are not isolated cases as can be seen by the profiles from the right eyes with the next 5 worst fits to the template in Figure 3C. Here R2 ranged from 0.28 to 0.39. On average, R2 was 0.61±0.29 for the right eye and 0.65±0.24 for the left, with 27% of the R2 values below 0.5. Thus, on average, the group template accounted for less than 63% of the variance.
FIGURE 3.

A, Individual RNFL profiles (gray), with the average of all profiles (black), for the 5 highest coefficients of determination (R2) values. B and C, Same as in A for the 5 lowest R2 values (B) and the next 5 lowest R2 values (C).
Many of the individual profiles deviated substantially from the group average (the template). In some cases, the overall thickness was greater (eg, lowest profile in Fig. 3B) or less than the average curve. To adjust for overall differences in the mean RNFL thickness, the R2 (norm) values were calculated for the profiles normalized by the mean of their thicknesses (see Methods section). As expected, this procedure increased the values of R2: the means of the R2 (norm) values were 0.75±0.16 (right eye) and 0.75±0.16 (left eye). Adjusting for average thickness only increased the proportion of the variance accounted for 0.14 (right eye) and 0.10 (left eye). [Recall that for the right (left) eye, the group average (template) accounted for 0.61 (0.65) of the variance before adjusting for average thickness.] In any case, considerable variation remains after adjusting for the mean. Figure 4 shows the profiles for the 10 lowest R2 (norm) values. The value of R2 (norm) for these 10 individuals ranged from 0.17 to 0.64. There was considerable variability in the shape of the profile, independent of overall differences in mean amplitude.
FIGURE 4.

A, Normalized (scaled) individual RNFL profiles (gray), with the average of all normalized profiles (black), for the 5 lowest R2 (norm) values. B, Same as in A for the next 5 lowest R2 (norm) values.
In Figure 5, the value of R2 (norm) is plotted against the value of R2 (inter) for both the right (panel A) and left (panel B) eyes. There was little or no correlation between these values of R2 with Spearman correlations of 0.11 (right eye) and 0.17 (left eye). (The diagonal line has a slope of 1.0.) Notice for example, that 5 of the 7 smallest R2 (norm) values (below dashed lines) in panels A and B, had R2 (inter) values greater than 0.9. In other words, a poor agreement with the template did not predict a poor interocular agreement. This suggests that the variation in RNFL profiles among individuals is not owing to measurement errors. This was further confirmed by the repeat measures available on 6 of the 7 lowest R2 (norm) values for the right eye and 5 of the 7 lowest values for the left eye.
FIGURE 5.

Normalized R2 values plotted against interocular R2 values of the (A) right and (B) left eyes.
Age, refractive error, and OCT signal strength were also not contributing factors. The Spearman correlations for the right (left) eye between R2 and these factors were −0.23 (−0.17), −0.03 (0.00), and 0.11 (0.20), for age, refractive error, and signal strength, respectively. Their respective Spearman correlations against R2 (norm) values were −0.05 (−0.18), 0.05 (−0.02), and 0.21 (0.13), for the right (left) eye.
RNFL Profiles and False Positives
On the basis of the criteria detailed in the Methods section, only 1 of 96 eyes (48 individuals) was classified as abnormal. The scans from both eyes of this individual are shown in Figure 6. The R2 (inter) was 0.87 (0.93) for the right (left) eye. The arrows indicate the region of the left eye that met the criteria for abnormality. Notice that the same region in the right eye shows borderline thickness. All other tests on this individual were normal, suggesting that this is a false positive. Figures 2A and C suggest the reason for this false positive. The arrows in Figures 2A and C indicate the points for the superior disc of this individual. The superior maxima in this individual had relatively small amplitudes (Fig. 2A) and were located more nasally than in most control eyes (Fig. 2C).
FIGURE 6.
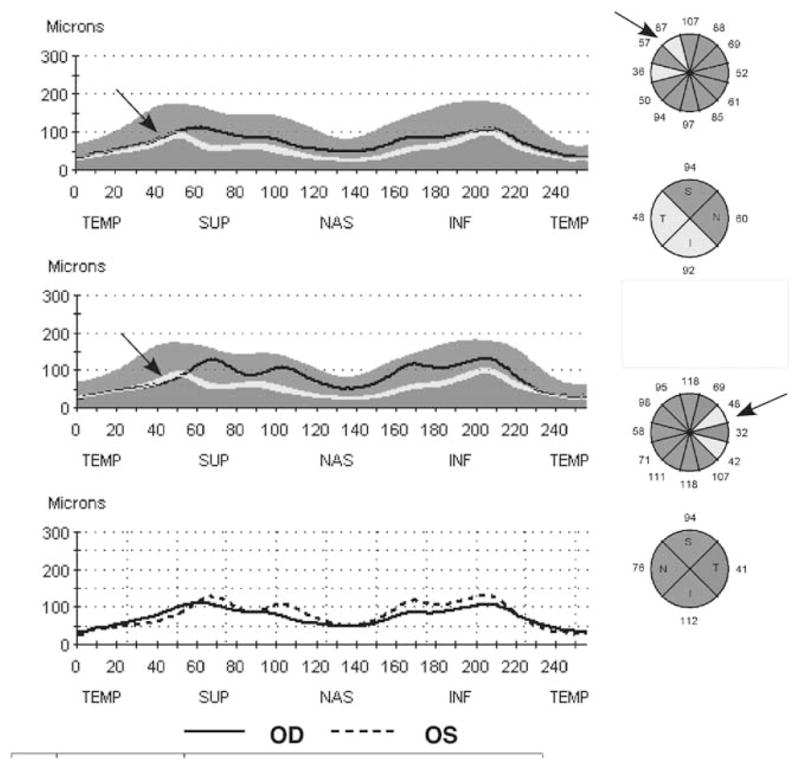
The RNFL report for an individual whose left eye was scored as abnormal based on the clock hour analysis. The arrows indicate the location of the abnormal RNFL thickness in the left eye.
DISCUSSION
The purpose of this study was to assess the variations in the RNFL thickness of healthy individuals when measured with OCT. For most of the subjects, the RNFL profiles of the 2 eyes were very similar to each other. However, the RNFL profiles showed considerable variability among individuals in both amplitude and waveform. Even when the profiles were normalized to take into consideration differences in overall amplitude, the group template accounted for, on average, only 75.1% (75.1%) of the variance for the right (left) eyes and only 50.1% (49.8%) of the variance for the 10 right (left) eyes showing the poorest agreement.
Although measurement error undoubtedly contributes to the variation in RNFL profiles, it is probably a relatively small factor in this study. First, the scans were required to have a good signal strength and to appear centered on the optic disc. Second, in most cases, we could establish that the most deviant profiles replicated, that is, for 11 of the 14 eyes with the smallest normalized R2 values, there was at least 1 additional test available and that test showed essentially the same result. Third, the similarity of the profiles of the 2 eyes provides another indication of good reproducibility. With R2 values of 0.91 and 0.92, there is a high level of agreement for the right and left eyes, respectively. Finally, there was no correlation between R2 (inter), the similarity between the 2 eyes, and R2 (norm), the agreement with the group template. That is, a poor interocular agreement was not an indication of poor agreement with the template as might be expected as measurement error should affect both interocular agreement and agreement among individuals. Together, these results suggest that most of the variation among normal RNFL profiles is due to true differences in RNFL profiles as opposed to measurement error.
Further, age, refractive error, and signal strength were not major contributing factors to these interindividual differences. These factors showed poor correlation with R2 values and, hence, did not play a role in agreement with the template.
Thus, the variations in RNFL profiles observed here are not accounted for by simple measurement errors or other factors such as age or refractive error. As visual fields were not obtained on all the controls, we cannot rule out the possibility that one or more of them would have been excluded based on an abnormal visual field. Although in principle this factor could contribute to the intersubject variability, in practice, it is unlikely to be a significant factor. Support for this comes from the fact that the mean and SD of the average RNFL thickness of our group of 48 controls (100.5±11.1mm) falls in the middle of the values reported in the literature for comparable studies, where the mean RNFL thickness ranged from 96.3 to 113.0mm (median of 100.1) and the SD from 9.9 to 35.3mm (median of 11.09).2,3,6,9,14,16,22,27,30
Recently, we found that the local maxima in the RNFL profile are usually associated with blood vessels. 31,32 Variations in the location of blood vessels and variation in the pattern of axons are being explored as the most likely sources of variations in individual RNFL profiles.
Clinical Implications
Although the OCT RNFL thickness has been shown to have reasonably good sensitivity and specificity,1–15 there is no generally agreed upon “best” OCT RNFL measure for detecting glaucomatous damage. Although many studies have used overall average RNFL thickness, a variety of other criteria using information from quadrant and clock hour analyses have been tried. We found that best sensitivity/specificity was obtained by defining an abnormal hemifield as one with 2 or more clock hour sectors at 5% (yellow) or one or more at 1% (red).4 An eye was classified as abnormal if either hemifield was abnormal. One eye in this study was abnormal based on these criteria. The RNFL profiles of this eye showed good agreement with the other eye suggesting that either both eyes were similarly affected or that both are normal. Further, the local maxima with the peak amplitude in these eyes were located more nasally than was the case for most of the control eyes. In general, eyes with RNFL peaks located at the extreme locations of the normal range are more likely to result in false positives, especially if their peak amplitudes are also in the lower portion of the normal range. If RNFL profiles are obtained from both eyes, it should be possible to develop a method for identifying and tagging these eyes so the clinician is alerted and knows to be wary of labeling this an abnormal scan. In general, an interocular comparison, combined with knowledge of normal RNFL variation, should help identify false positives. On the other hand, because a high degree of symmetry is expected in normal eyes, asymmetry between the eyes might be a useful clinical sign of early glaucoma. However, further work is needed to assess the utility of a measure of RNFL asymmetry.
Acknowledgments
Supported by National Eye Institute grants RO1-EY-09076 and RO1-EY-02115 and the Ephraim and Catherine Gildor Research Fund of the New York Glaucoma Research Institute.
References
- 1.Brusini P, Salvetat ML, Zeppieri M, et al. Comparison between GDx VCC scanning laser polarimetry and Stratus OCT optical coherence tomography in the diagnosis of chronic glaucoma. Acta Ophthalmol Scand. 2006;84:650–655. doi: 10.1111/j.1600-0420.2006.00747.x. [DOI] [PubMed] [Google Scholar]
- 2.Budenz DL, Michael A, Chang RT, et al. Sensitivity and specificity of the StratusOCT for perimetric glaucoma. Ophthalmology. 2005;112:3–9. doi: 10.1016/j.ophtha.2004.06.039. [DOI] [PubMed] [Google Scholar]
- 3.Convento E, Midena E, Dorigo MT, et al. Peripapillary fundus perimetry in eyes with glaucoma. Br J Ophthalmol. 2006;90:1398–1403. doi: 10.1136/bjo.2006.092973. [DOI] [PMC free article] [PubMed] [Google Scholar]
- 4.Hood DC, Harizman N, Kanadani FN, et al. Retinal nerve fiber thickness measured with optical coherence tomography (OCT) accurately detects confirmed glaucomatous damage. Br J Ophthalmol. 2007;91:905–907. doi: 10.1136/bjo.2006.111252. [DOI] [PMC free article] [PubMed] [Google Scholar]
- 5.Hougaard JL, Heijl A, Bengtsson B. Glaucoma detection using different Stratus optical coherence tomography protocols. Acta Ophthalmol Scand. 2007;85:251–256. doi: 10.1111/j.1600-0420.2006.00826.x. [DOI] [PubMed] [Google Scholar]
- 6.Huang ML, Chen HY. Development and comparison of automated classifiers for glaucoma diagnosis using Stratus optical coherence tomography. Invest Ophthalmol Vis Sci. 2005;46:4121–4129. doi: 10.1167/iovs.05-0069. [DOI] [PubMed] [Google Scholar]
- 7.Jeoung JW, Park KH, Kim TW, et al. Diagnostic ability of optical coherence tomography with a normative database to detect localized retinal nerve fiber layer defects. Ophthalmology. 2005;112:2157–2163. doi: 10.1016/j.ophtha.2005.07.012. [DOI] [PubMed] [Google Scholar]
- 8.Kanamori A, Nagai-Kusuhara A, Escano MF, et al. Comparison of confocal scanning laser ophthalmoscopy, scanning laser polarimetry and optical coherence tomography to discriminate ocular hypertension and glaucoma at an early stage. Graefes Arch Clin Exp Ophthalmol. 2006;244:58–68. doi: 10.1007/s00417-005-0029-0. [DOI] [PubMed] [Google Scholar]
- 9.Medeiros FA, Zangwill LM, Bowd C, et al. Evaluation of retinal nerve fiber layer, optic nerve head, and macular thickness measurements for glaucoma detection using optical coherence tomography. Am J Ophthalmol. 2005;139:44–55. doi: 10.1016/j.ajo.2004.08.069. [DOI] [PubMed] [Google Scholar]
- 10.Medeiros FA, Zangwill LM, Bowd C, et al. Influence of disease severity and optic disc size on the diagnostic performance of imaging instruments in glaucoma. Invest Ophthalmol Vis Sci. 2006;47:1008–1015. doi: 10.1167/iovs.05-1133. [DOI] [PubMed] [Google Scholar]
- 11.Nouri-Mahdavi K, Hoffman D, Tannenbaum DP, et al. Identifying early glaucoma with optical coherence tomography. Am J Ophthalmol. 2004;137:228–235. doi: 10.1016/j.ajo.2003.09.004. [DOI] [PubMed] [Google Scholar]
- 12.Sanchez-Galeana C, Bowd C, Blumenthal EZ, et al. Using optical imaging summary data to detect glaucoma. Ophthalmology. 2001;108:1812–1818. doi: 10.1016/s0161-6420(01)00768-0. [DOI] [PubMed] [Google Scholar]
- 13.Shah NN, Bowd C, Medeiros FA, et al. Combining structural and functional testing for detection of glaucoma. Ophthalmology. 2006;113:1593–1602. doi: 10.1016/j.ophtha.2006.06.004. [DOI] [PubMed] [Google Scholar]
- 14.Wollstein G, Ishikawa H, Wang J, et al. Comparison of three optical coherence tomography scanning areas for detection of glaucomatous damage. Am J Ophthalmol. 2005;139:39–43. doi: 10.1016/j.ajo.2004.08.036. [DOI] [PubMed] [Google Scholar]
- 15.Zangwill LM, Williams J, Berry CC, et al. A comparison of optical coherence tomography and retinal nerve fiber layer photography for detection of nerve fiber layer damage in glaucoma. Ophthalmology. 2000;107:1309–1315. doi: 10.1016/s0161-6420(00)00168-8. [DOI] [PubMed] [Google Scholar]
- 16.Budenz DL, Chang RT, Huang X, et al. Reproducibility of retinal nerve fiber thickness measurements using the Stratus OCT in normal and glaucomatous eyes. Invest Ophthalmol Vis Sci. 2005;46:2440–2443. doi: 10.1167/iovs.04-1174. [DOI] [PubMed] [Google Scholar]
- 17.Gürses-Özden R, Teng C, Vessani R, et al. Macular and retinal nerve fiber layer thickness measurement reproducibility using optical coherence tomography (OCT-3) J Glaucoma. 2004;13:238–244. doi: 10.1097/00061198-200406000-00012. [DOI] [PubMed] [Google Scholar]
- 18.Mok KH, Lee VW, So KF, et al. Increasing scans per examination improves the reproducibility on retinal nerve fiber layer measurements by optical coherence tomography. Optom Vis Sci. 2004;81:267–270. doi: 10.1097/00006324-200404000-00013. [DOI] [PubMed] [Google Scholar]
- 19.Paunescu LA, Schuman JS, Price LL, et al. Reproducibility of nerve fiber thickness, macular thickness, and optic nerve head measurements using StratusOCT. Invest Ophthalmol Vis Sci. 2004;45:1716–1724. doi: 10.1167/iovs.03-0514. [DOI] [PMC free article] [PubMed] [Google Scholar]
- 20.Alamouti B, Funk J. Retinal thickness decreases with age: an OCT study. Br J Ophthalmol. 2003;87:899–901. doi: 10.1136/bjo.87.7.899. [DOI] [PMC free article] [PubMed] [Google Scholar]
- 21.Bowd C, Zangwill LM, Blumenthal EZ, et al. Imaging of the optic disc and retinal nerve fiber layer: the effects of age, optic disc area, refractive error, and gender. J Opt Soc Am. 2002;19:197–207. doi: 10.1364/josaa.19.000197. [DOI] [PubMed] [Google Scholar]
- 22.Budenz D, Anderson D, Varma R, et al. Determinants of normal retinal nerve fiber layer thickness measured by Stratus OCT. Ophthalmology. 2007;114:1046–1052. doi: 10.1016/j.ophtha.2006.08.046. [DOI] [PMC free article] [PubMed] [Google Scholar]
- 23.Hougaard JL, Ostenfeld C, Heijl A, et al. Modelling the normal retinal nerve fibre layer thickness as measured by Stratus optical coherence tomography. Graefes Arch Clin Exp Ophthalmol. 2006;244:1607–1614. doi: 10.1007/s00417-006-0372-9. [DOI] [PubMed] [Google Scholar]
- 24.Kanamori AK, Escano MFT, Eno A, et al. Evaluation of the effect of aging on retinal nerve fiber layer thickness measured by optical coherence tomography. Ophthalmologica. 2003;217:273–278. doi: 10.1159/000070634. [DOI] [PubMed] [Google Scholar]
- 25.Wu Z, Vazeen M, Varma R, et al. Factors associated with variability in retinal nerve fiber layer thickness measurements obtained by optical coherence tomography. Ophthalmology. 2007;114:1505–1512. doi: 10.1016/j.ophtha.2006.10.061. [DOI] [PubMed] [Google Scholar]
- 26.Sadda SR, Wu Z, Walsh AC, et al. Errors in retinal thickness measurements obtained by optical coherence tomography. Ophthalmology. 2006;113:285–293. doi: 10.1016/j.ophtha.2005.10.005. [DOI] [PubMed] [Google Scholar]
- 27.Savini G, Zanini M, Carelli V, et al. Correlation between retinal nerve fiber layer thickness and optic nerve head size: an optical coherence tomography study. Br J Ophthalmol. 2005;89:489–492. doi: 10.1136/bjo.2004.052498. [DOI] [PMC free article] [PubMed] [Google Scholar]
- 28.Choi SW, Lee SJ. Thickness changes in the fovea and peripapillary retinal nerve fiber layer depend on the degree of myopia. Korean J Ophthalmol. 2006;20:215–219. doi: 10.3341/kjo.2006.20.4.215. [DOI] [PMC free article] [PubMed] [Google Scholar]
- 29.Leung CK, Mohamed S, Leung KS, et al. Retinal nerve fiber layer measurements in myopia: an optical coherence tomography study. Invest Ophthalmol Vis Sci. 2006;47:5171–5176. doi: 10.1167/iovs.06-0545. [DOI] [PubMed] [Google Scholar]
- 30.Bowd C, Zangwill LM, Medeiros FA, et al. Structure-function relationships using confocal scanning laser ophthalmoscopy, optical coherence tomography, and scanning laser polarimetry. Invest Ophthalmol Vis Sci. 2006;47:2889–2895. doi: 10.1167/iovs.05-1489. [DOI] [PubMed] [Google Scholar]
- 31.Hood DC, Kardon RH. A framework for comparing structural and functional measures of glaucomatous damage. Prog Ret Eye Res. 2007;26:688–710. doi: 10.1016/j.preteyeres.2007.08.001. [DOI] [PMC free article] [PubMed] [Google Scholar]
- 32.Hood DC, Fortune B, Arthur SN, et al. Blood vessel contributions to retinal nerve fiber layer thickness profiles measured with optical coherence tomography. J Gluacoma. 2008 doi: 10.1097/IJG.0b013e3181629a02. In press. [DOI] [PMC free article] [PubMed] [Google Scholar]