Abstract
OBJECTIVE
Coronary artery calcification (CAC) and thoracic aortic calcificatio (TAC) are frequently detected on ungated multi-detector computed tomography (MDCT) performed for lung evaluations. We sought to evaluate concordance of CAC and TAC scores on ungated (thoracic) and ECG-gated (cardiac) MDCT scans.
METHODS
Fifty patients, enrolled in the Genetic Epidemiology of COPD study (COPDGene), were recruited to undergo gated CAC scans using 64-detector row CT, in addition to the ungated thoracic studies already being obtained as part of their study evaluation. Coronary and thoracic calcium was measured similarly (Agatston score, requiring 3 contiguous voxels of >130 Hounsfield units) using low-dose ungated studies and ECG-gated MDCT performed at the same scanning session. Intertechnique scoring variability and concordance were calculated.
RESULTS
Correlations between gated and ungated CAC and TAC were excellent (r = 0.96). The relative differences (median variability) measured by ECG-gated vs. ungated MDCT were relatively high for CAC (44%) but not for TAC (8%). Prevalence of depicted CAC (n=33, 66%) and TAC (n=21, 42%) were coincident between ECG-gated and ungated MDCT, respectively (inter-technique concordance 100%). Bland-Altman plots for CAC demonstrated mean differences of 354 (CI 169–538) and 16.1(CI −89–121).
CONCLUSION
Low-dose ungated MDCT is reliable for prediction of the presence of CAC and assessment of Agatston score. Concordance between methods and between TAC and CAC is high. This technique should allow for atherosclerotic disease risk stratification among patients undergoing ungated lung CT evaluation without requiring additional scanning. Measurement of TAC is almost as accurate from gated CT, and CAC scores are highly concordant.
Coronary artery calcification (CAC) detected using electrocardiogaphically (ECG) gated computed tomography (CT) accurately identifies coronary atherosclerosis. Lung scanning using non-contrast and ungated CT provides a reference standard for the diagnosis of lung diseases, especially lung cancer. Each year, more than 62 million diagnostic CT scans per year are performed in the United States, with 31% (19.2 million) used for visualization of the lungs.1 Patients who undergo thoracic CT (such as those with emphysema or undergoing lung cancer screening) usually also have risk factors for coronary artery disease (CAD), such as advanced age and smoking history. Because CAC on CT distinctly identifies atherosclerosis2,3,4,5, it may be advantageous to screen for the CAD and lung cancer simultaneously in a combined CT examination to leader to broader diagnosis of these common and morbid diseases. CAC and thoracic aortic calcification (TAC) can be quantified on chest CT scans. New multi-detector computed tomography (MDCT) scanners, with faster gantry rotation times, thinner slices (detector row widths) and more detector rows now allow for estimates of CAC on ungated studies. The faster gantry rotation times reduce susceptibility to cardiac motion, and thinner detector row widths allow for thinner slices and reduced partial volume effects, potentially making calcium measures more exact and reliable, even on studies obtained for other indications.
Kim et al. have reported that, in comparisons of CAC between low radiation dose chest MDCT and ECG-triggered standard-dose CT, over 90% of patients with CAC on ECG-triggered scans can be visualized on ungated CT; however mean scores and diagnostic concordance remains unknown.6 In the present study, we sought to determine the concordance of CAC scores between ungated chest and ECG-gated cardiac MDCT studies.
Methods
The Genetic Epidemiology of COPD (COPDGene) study is a large, NIH-sponsored case-control study of genetic markers for the predilection to develop COPD among white and African American individuals with a minimum of a 10 pack year history of smoking. For details of the COPDGene protocol see Regan et al.7 Fifty subjects were recruited at one COPDGene site to undergo gated coronary calcium scans using 64-detector row CT (General Electric, Milwaukee WI), in addition to the ungated studies already being obtained as part of the COPDGene Study. Each signed informed consent for their participation. This study was approved by the COPDGene Executive Committee. Both sets of images (gated and ungated) were obtained with the patient supine, with no couch angulation. Each scan was obtained in a single 10-second breath hold, minimizing motion artifacts from breathing at the same scanning session.
Gated cardiac scan, performed with electrocardiographic triggering, enabled each axial image to be obtained at the same point in diastole, corresponding to 75% of the RR interval. Images were obtained at 2.5 mm intervals beginning one centimeter below the carina and progressing caudally to include all coronary arteries. The settings of the GE 64 scanner (LightSpeed VCT, General Electric Medical System, Milwaukee, WI) were 120 kVp, 430 mA, 350 ms/per rotation, with 2.5 mm reconstructed slice thickness. Effective radiation dose using this technique was approximately 1 mSv per patient, measured effective dose (ED) was calculated by multiplying the dose length product by the conversion factor for the chest (0.014). Ungated thoracic images were obtained in the helical mode, with a pitch of 1.375. The ungated study settings were 120 kVp, 430 mA, 500 ms/per rotation. Images were reconstructed as contiguous 2.5 mm slice thickness for measure of CAC and TAC.
Thoracic aortic calcification (TAC) was defined as either ascending or descending thoracic aortic calcium, as present from the pulmonary artery bifurcation superiorly to the cardiac apex inferiorly. The TAC of the ungated reconstructed images was measured using the same range as the gated scan, to allow more direct comparison of the measures. Both coronary and thoracic aortic calcium were classified using a CT threshold of 130 Hounsfield units (HU) involving 3 contiguous voxels for identification of a calcific lesion resulting in a minimum lesion area of 1.02 mm2. The lesion score was calculated using the area density method, by multiplying the lesion area by a density factor derived from the maximal HU within the area as described by Agatston13. The density factor was assigned in the following manner: 1 for lesions whose maximal density was 130–199 Hu, 2 for lesions 200–299 Hu, 3 for lesions 300–399 Hu, and 4 for lesions >400 Hu. A total coronary calcium score was determined by summing individual lesion scores from each of four anatomic sites (left main, left anterior descending, circumflex, and right coronary arteries).
Statistical Analysis
All values are reported as mean ± standard deviation. Data were analyzed using Chi square or Fisher’s exact test for comparing categorical variables. All tests of significance were two-tailed, and significance was defined using a P value of < 0.05. The calcium score was transformed by taking the natural log of (1 + calcium score) for inclusion in the model. Bland-Altman, intraclass correlation coefficient (ICC), kappa value, and variability were used to express interobserver and intertechnique (ECG-gated MDCT vs ungated MDCT) agreement of CAC and TAC scores. All statistical analyses were performed using the SAS software system.17,18
Results
CAC Variability
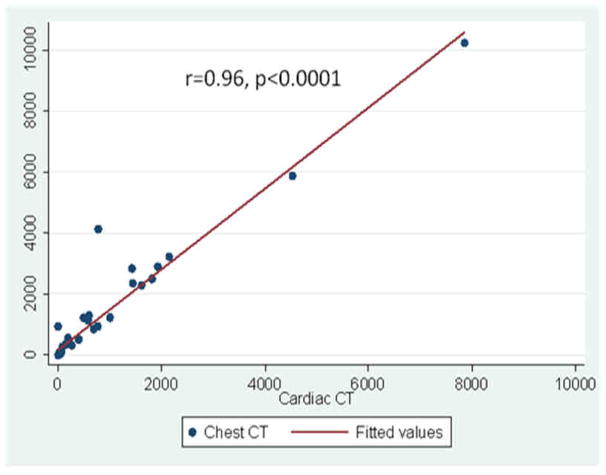
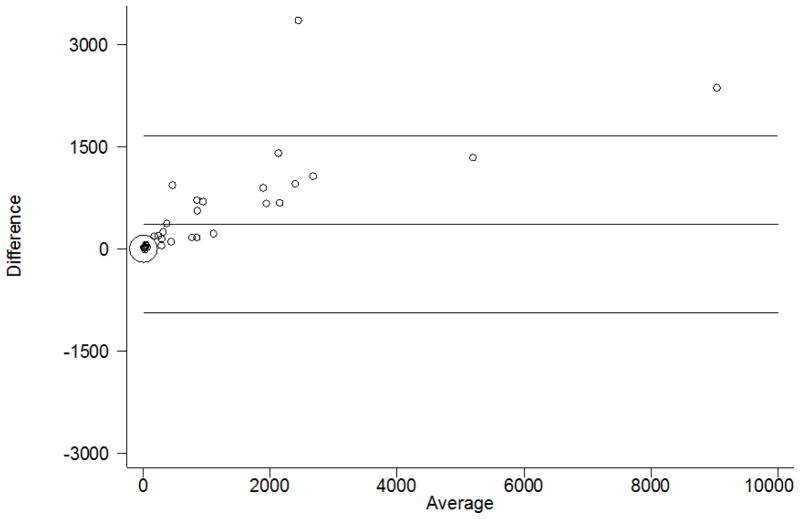
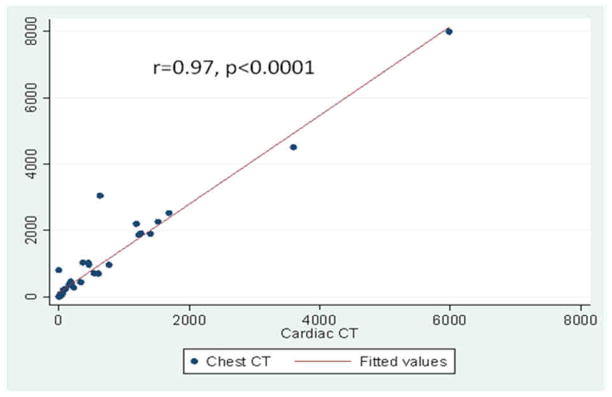
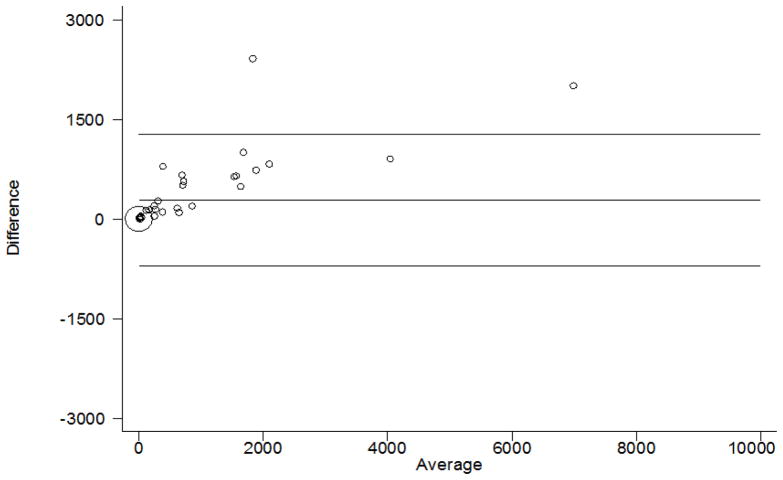
Correlation between CAC scores obtained by ungated and gated protocols was excellent (Agatston ICC = 0.96; volumetric ICC 0.97, p < 0.0001) (Figure 1a and Figure 1b). The mean absolute Agatston values of the ungated scoring protocol and gated protocols were 353.6 (95% CI 169.0 to 538.2) and 277.1 (95% CI 136.4 to 417.8). Variability between ungated and gated scans increased with higher CAC scores using either scoring method (Figures 1b and 2b). When the analyses were limited to those with Agatston CAC scores<1000, the respective mean differences between gated and ungated CT scores narrowed to 137 (CI 44 to 231) using the Agatston scoring protocol and 74 (CI 16 to 133) using the volumetric gated scoring protocol. The relative difference (median variability and interquartile range) for CAC Agatston scores measured by gated vs. ungated CT was 44% (23% to 61%). A strong bias in the positive direction indicated that ungated studies generally yielded higher scores than gated studies. Table 1 shows the agreement between CAC categories determined by ungated chest and gated cardiac CT. On kappa analyses, overall agreement was 95% with expected agreement of 54%. The weighted kappa was 0.90 demonstrating an excellent agreement between the two techniques for assessing CAC scores.
Figure 1a and 1b . CAC Scores Determined by ungated Chest CT Vs. gated Cardiac CT Protocols Correlation (Agatston Protocol).
Figure 1a is a scatter-plot demonstrating excellent correlation between ungated thoracic CT and gated cardiac CT (R = 0.96, ICC = 0.96). X-axis represents gated scores and y-axis represents ungated study score. Figure 1b is the Bland-Altman plot of the same data (Mean difference: 354 (CI 168 to 538)
Figure 2. CAC Scores Determined by ungated Chest CT Vs. gated Cardiac CT Protocols Correlation (Volumetric Protocol).
Figure 2a is a scatter-plot demonstrating excellent correlation between ungated thoracic CT and gated cardiac CT (R = 0.96, ICC = 0.96). X-axis represents gated scores and y-axis represents ungated study score. Figure 2b is the Bland-Altman plot of the same data (Mean difference: 277 (CI 136 to 418)
Table 1.
Agreement between Coronary Artery Calcium Scores Categories by Ungated and Gated CT
| Ungated CT | Gated CT | |||
|---|---|---|---|---|
| CAC=0 | CAC 1–100 | CAC 101–400 | CAC>400 | |
| CAC=0 | 17 | 0 | 0 | 0 |
| CAC 1–100 | 0 | 11 | 0 | 0 |
| CAC 101–400 | 0 | 1 | 3 | 0 |
| CAC >400 | 0 | 0 | 3 | 15 |
Categories of CAC were examined within commonly used clinical cut-points (0, 1–100, 101–400 and >400). This analysis showed excellent correlation between the two measures. Gated studies revealed 17 (34%) had scores of zero, 12 (24%) had scores 1–100, 6 (12%) had scores 101–400 and 15 (30%) had scores >400. Ungated CAC scores revealed 17 (34%) with scores of zero, 11 (22%) had scores of 1–100, 4 (8%) had scores of 101–400, and 18 (36%) had scores >400. Concordance was found in 47 (94%) of 50 cases, with three cases being overestimated by ungated studies.
TAC Variability
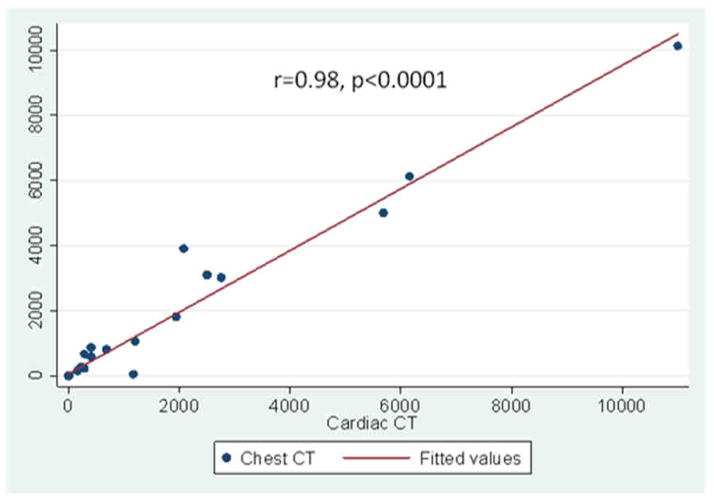
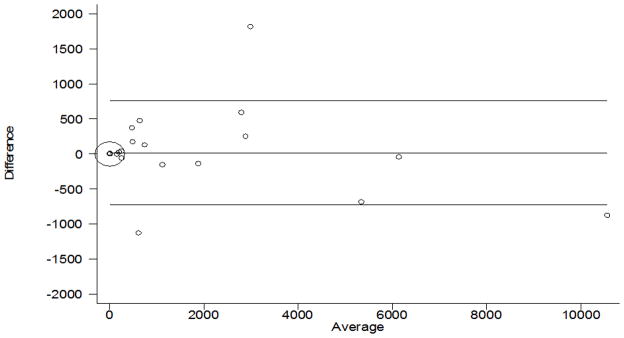
In a similar fashion to CAC, the correlation between TAC obtained by ungated chest and gated cardiac protocols was excellent (Agatston ICC 0.96; Volumetric ICC 0.97 p values<0.0001) as shown in Figure 3a. The respective mean absolute difference were small: 16 (CI −90 to 121) and 35 (CI −59 to 128) for assessment of TAC by Agatston and volumetric protocols, respectively. The respective median (IQR) variability was 8% (−13% to 30%) and 9% (−10% to 13%). Table 2 shows the agreement between TAC categories determined by ungated chest and gated cardiac CT. On kappa analysis, overall agreement was 97% with expected agreement on of 57%. The weighted kappa was 0.94 demonstrating an excellent agreement between the two techniques for assessing TAC scores.
Figure 3. TAC Scores Determined by ungated Chest CT Vs. gated Cardiac CT Protocols Correlation (Agatston Protocol).
Figure 3a is a scatter-plot demonstrating excellent correlation between ungated thoracic CT and gated cardiac CT (R = 0.98, ICC = 0.98). X-axis represents gated scores and y-axis represents ungated study score. Figure 3b is the Bland-Altman plot of the same data (Mean difference: 16 (CI −89 to 121)
Table 2.
Agreement between Thoracic Aortic Calcification Scores Categories by Ungated and Gated CT
| Ungated CT | Gated CT | |||
|---|---|---|---|---|
| TAC=0 | TAC 1–100 | TAC 101–400 | TAC>400 | |
| TAC=0 | 29 | 0 | 0 | 0 |
| TAC 1–100 | 0 | 4 | 0 | 1 |
| TAC 101–400 | 0 | 0 | 4 | 0 |
| TAC>400 | 0 | 0 | 2 | 10 |
Discussion
Our study demonstrates excellent concordance between CAC and TAC measures on ungated thoracic and gated cardiac CT scans. This would potentially allow ungated studies to provide quantification of CAC and TAC at the time of interpretation, providing assessment of atherosclerosis burden, similar to a gated CT for evaluation of CAC. The current study is the first to evaluate ungated TAC as compared to a gated cardiac study.
Thoracic aortic calcium noted on gated studies has been independently associated with adverse cardiovascular events,8 inflammation9, coronary calcium10 and cardiac risk factors11. The ability to accurately quantitate TAC on ungated studies is expected, as there is no or minimal motion of the aorta compared to the coronaries. This allows all thoracic studies to provide a measure of atherosclerosis without concern for heart rate or cardiac motion artifacts. Similarly, agreement was also excellent for CAC, although CAC scores were systematically overestimated on the ungated scan, potentially requiring transformation and/or a correction factor if to be compared directly to gated cardiac studies. This is most likely due to motion artifacts, as non-gated studies will include both systolic and end-diastolic images, when coronary motion artifacts are most prevalent.
Our coronary calcium score results are quite similar to those of Wu et al., who studied the concordance of CAC scores on low-dose ungated and standard-dose ECG-gated MDCT in 513 patients consecutively registered for health screening.12 With low-dose ungated MDCT, there were five false-positive and five false-negative cases, compared to gated studies. All the miscategorized scores were 12 or less, a level generally associate with low risk. The negative predictive values of CAC on low-dose ungated MDCT were 98% and 99% for observers 1 and 2, respectively. For patients with CAC, the mean intertechnique scoring variability was 40–43%, very similar to the current study. Wu did not report or compare TAC on the two studies.
A recent study of ungated thoracic CT scans performed for lung cancer screening in 8782 smokers, with 72 month mean follow up, revealed significant ability of ungated studies to predict cardiovascular mortality.13 The authors found, that the rate of cardiovascular deaths increased with an increasing CAC score, although they only used an ordinal system, categorizing scores from 0–12 based upon visual estimation per vessel. With use of subjects with an ordinal CAC score of 0 as the reference group, a CAC score of at least 4 was a significant predictor of cardiovascular death (odds ratio [OR], 4.7; 95% confidence interval: 3.3, 6.8; P = .0001); when adjusted for sex, age, and pack-years of smoking, the ordinal CAC score remained significant (OR, 2.1; 95% confidence interval: 1.4, 3.1; P = .0002). They concluded that “visual assessment of CAC on low-dose CT scans provides clinically relevant quantitative information as to cardiovascular death.” Our study extends this ordinal scoring to a quantitative measure, with good correlation in categories of CAC that have been shown to robustly predict cardiovascular events.
Limitations of this study include the small sample size and inclusion of only smokers. The test performance may have been over-estimated given the patient sample is enriched with COPD, however other studies have shown similar results among non-smokers.5,11
The clinical importance of this study is found in the potential to screen for cardiovascular disease among the 19 million ungated thoracic scans done annually in the United States, without additional radiation, cost or participant burden. Because cardiovascular disease is the leading cause of death in the United States, and lung cancer is the second leading cause of death,14 evaluating for both with one scan may prove an effective addition to standard evaluations of these lung patients. Importantly, no patient who had coronary artery calcium on gated CT scans was missed on ungated scanning, so that the most important differentiation, i.e. that between patients with and without atherosclerosis, is accomplished. Furthermore, correct clinical classification was achieved in 94% of cases, with no patient more than one clinical score category misplaced by ungated studies. Our study suggests that detection of CAC and TAC in the same scan obtained for lung disease assessment, without any addition exposure and cost, has potential diagnostic and prognostic implications beyond both clinical evaluation and COPD severity.
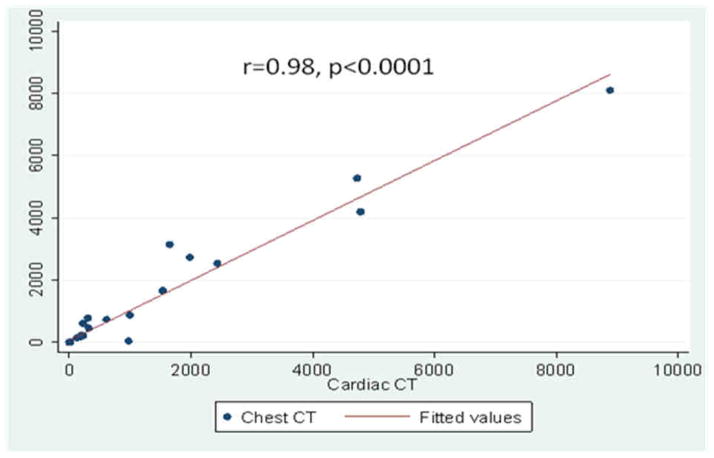
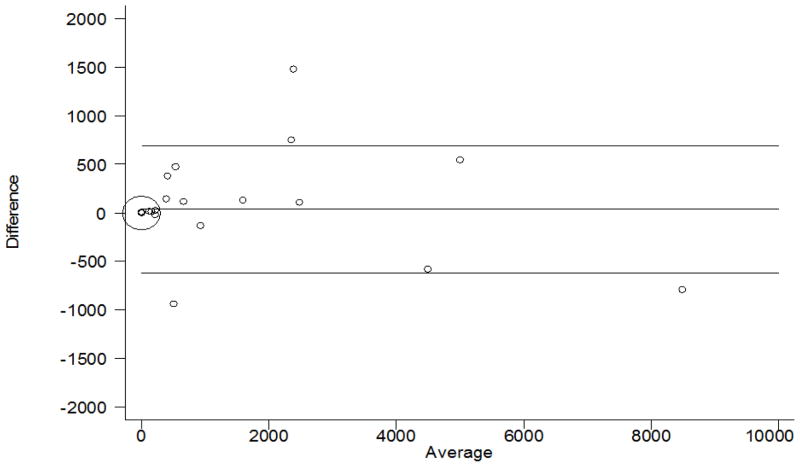
Figure 4. TAC Scores Determined by ungated Chest CT Vs. gated Cardiac CT Protocols Correlation (Volumetric Protocol).
Figure 4a is a scatter-plot demonstrating excellent correlation between ungated thoracic CT and gated cardiac CT (R = 0.98, ICC = 0.98). X-axis represents gated scores and y-axis represents ungated study score. Figure 4b is the Bland-Altman plot of the same data (Mean difference: 35 (CI −59 to 128)
Acknowledgments
This work was supported in part by funding from the National Heart, Lung, and Blood Institute award numbers U01HL089897 and U01HL089856, and R01-HL-071739.
Footnotes
Publisher's Disclaimer: This is a PDF file of an unedited manuscript that has been accepted for publication. As a service to our customers we are providing this early version of the manuscript. The manuscript will undergo copyediting, typesetting, and review of the resulting proof before it is published in its final citable form. Please note that during the production process errors may be discovered which could affect the content, and all legal disclaimers that apply to the journal pertain.
References
- 1.Brenner DJ, Hall EJ. Computed tomography — An increasing source of radiation exposure. N Engl J Med. 2007;357:2277–2284. doi: 10.1056/NEJMra072149. [DOI] [PubMed] [Google Scholar]
- 2.Greenland P, Bonow RO, Brundage BH, Budoff MJ, Eisenberg MJ, Grundy SM, Lauer MS, Post WS, Raggi P, Redberg RF, Rodgers GP, Shaw LJ, Taylor AJ, Weintraub WS, Harrington RA, Abrams J, Anderson JL, Bates ER, Eisenberg MJ, Grines CL, Hlatky MA, Lichtenberg RC, Lindner JR, Pohost GM, Schofield RS, Shubrooks SJ, Jr, Stein JH, Tracy CM, Vogel RA, Wesley DJ. Coronary artery calcium scoring: ACCF/AHA 2007 clinical expert consensus document on coronary artery calcium scoring by computed tomography in global cardiovascular risk assessment and in evaluation of patients with chest pain. J Am Coll Cardiol. 2007;49:378–402. doi: 10.1016/j.jacc.2006.10.001. [DOI] [PubMed] [Google Scholar]
- 3.Budoff MJ, Shaw LJ, Liu ST, Weinstein SR, Mosler TP, Tseng PH, Flores FR, Callister TQ, Raggi P, Berman DS. Long-Term Prognosis Associated With Coronary Calcification: Observations From a Registry of 25,253 Patients. J Am Coll Cardiol. 2007;49:1860–1870. doi: 10.1016/j.jacc.2006.10.079. [DOI] [PubMed] [Google Scholar]
- 4.Greenland P, Alpert JS, Beller GA, Benjamin EJ, Budoff MJ, Fayad ZA, Foster E, Hlatky MA, Hodgson JMcB, Kushner FG, Lauer MS, Shaw LJ, Smith SC, Jr, Taylor AJ, Weintraub WS, Wenger NK. ACCF/AHA Guideline for Assessment of Cardiovascular Risk in Asymptomatic Adults: Executive Summary: a report of the American College of Cardiology Foundation/American Heart Association Task Force on Practice Guidelines. J Am Coll Cardiol. 2010;xx:xxx–xxx. doi: 10.1161/CIR.0b013e3182051bab. [DOI] [PubMed] [Google Scholar]
- 5.Budoff MJ, Achenbach S, Blumenthal RS, Carr JJ, Goldin JG, Greenland P, Guerci AD, Lima JAC, Rader DJ, Rubin GD, Shaw LJ, Wiegers SE. Assessment of Coronary Artery Disease by Cardiac Computed Tomography, A Scientific Statement From the American Heart Association Committee on Cardiovascular Imaging and Intervention, Council on Cardiovascular Radiology and Intervention, and Committee on Cardiac Imaging, Council on Clinical Cardiology. Circulation. 2006;114(16):1761–91. doi: 10.1161/CIRCULATIONAHA.106.178458. [DOI] [PubMed] [Google Scholar]
- 6.Kim SM, Chung MJ, Lee KS, Choe YH, Yi CA, Choe BK. Coronary Calcium Screening Using Low-Dose Lung Cancer Screening: Effectiveness of MDCT with Retrospective Reconstruction. AJR. 2008;190:917–922. doi: 10.2214/AJR.07.2979. [DOI] [PubMed] [Google Scholar]
- 7.Regan EA, Hokanson JE, Murphy JR, Make B, Lynch DA, Beaty TH, Curran-Everett D, Silverman EK, Crapo JD. Genetic epidemiology of COPD (COPDGene) study design. COPD. 2010;7(1):32–43. doi: 10.3109/15412550903499522. [DOI] [PMC free article] [PubMed] [Google Scholar]
- 8.Santos RD, Rumberger JA, Budoff MJ, Shaw LJ, Orakzai SH, Berman D, Raggi P, Blumenthal RS, Nasir K. Thoracic aorta calcification detected by electron beam tomography predicts all-cause mortality. Atherosclerosis. 2010;209(1):131–5. doi: 10.1016/j.atherosclerosis.2009.08.025. [DOI] [PubMed] [Google Scholar]
- 9.Takasu J, Katz R, Shavelle DM, O’Brien K, Mao S, Carr JJ, Cushman M, Budoff MJ. Inflammation and descending thoracic aortic calcification as detected by computed tomography: The Multi-Ethnic Study of Atherosclerosis. Atherosclerosis. 2008;199:201–206. doi: 10.1016/j.atherosclerosis.2007.11.005. [DOI] [PubMed] [Google Scholar]
- 10.Takasu J, Budoff MJ, O’Brien KD, Shavelle DM, Probstfield JL, Carr JJ, Katz R. Relationship between coronary artery and descending thoracic aortic calcification as detected by computed tomography: The Multi-Ethnic Study of Atherosclerosis. Atherosclerosis. 2009;204(2):440–6. doi: 10.1016/j.atherosclerosis.2008.09.041. [DOI] [PMC free article] [PubMed] [Google Scholar]
- 11.Takasu J, Katz R, Nasir K, Carr JJ, Wong N, Detrano R, Budoff MJ. Relationships of thoracic aortic wall calcification to cardiovascular risk factors: the Multi-Ethnic Study of Atherosclerosis. Am Heart J. 2008;155:765–771. doi: 10.1016/j.ahj.2007.11.019. [DOI] [PMC free article] [PubMed] [Google Scholar]
- 12.Wu MT, Yang P, Huang YL, Chen JS, Chuo CC, Yeh C, Chang RS. Coronary Arterial Calcification on Low-Dose Ungated MDCT for Lung Cancer Screening: Concordance Study with Dedicated Cardiac CT. AJR. 2008;190:923–928. doi: 10.2214/AJR.07.2974. [DOI] [PubMed] [Google Scholar]
- 13.Shemesh J, Henschke CI, Shaham D, et al. Ordinal Scoring of Coronary Artery Calcifications on Low-Dose CT Scans of the Chest is Predictive of Death from Cardiovascular Disease. Radiology. 2010;257:541–548. doi: 10.1148/radiol.10100383. [DOI] [PubMed] [Google Scholar]
- 14.Manser R, Dalton A, Carter R, Byrnes G, Elwood M, Campbell DA. Cost-effectiveness analysis of screening for lung cancer with low dose spiral CT (computed tomography) in the Australian setting. Lung Cancer. 2005;48:171–185. doi: 10.1016/j.lungcan.2004.11.001. [DOI] [PubMed] [Google Scholar]


