Abstract
Although the cardiac bidomain model has been widely used in the simulation of electrical activation, its relatively computationally expensive nature means that monodomain approaches are generally required for long duration simulations (for example, investigations of arrhythmia mechanisms). However, the presence of a conducting bath surrounding the tissue is known to induce wavefront curvature (surface leading bulk), a phenomena absent in standard monodomain approaches. Here, we investigate the biophysical origin of the bidomain bath-loading induced wavefront curvature and present a novel augmented monodomain equivalent bidomain approach faithfully replicating all aspects of bidomain wavefront morphology and conduction velocity, but with a fraction of the computational cost. Bath-loading effects are shown to be highly dependent upon specific conductivity parameters, but less dependent upon the thickness or conductivity of the surrounding bath, with even relatively thin surrounding fluid layers (~ 0.1 mm) producing significant wavefront curvature in bidomain simulations. We demonstrate that our augmented monodomain approach can be easily adapted for different conductivity sets and applied to anatomically complex models thus facilitating fast and accurate simulation of cardiac wavefront dynamics during long duration simulations, further aiding the faithful comparison of simulations with experiments.
Keywords: Cardiac modelling, Bidomain equations, bath-loading effect
I. Introduction
The bidomain model of cardiac tissue has been successfully used in recent years to significantly improve our understanding of the electrophysiological behaviour of the heart [1], [2], [3]. Bidomain theory explicitly considers current flow in both intra-and extracellular domains within the myocardium, as well as allowing representation of a perfusing ‘bath’ surrounding the tissue through which extracellular current can also flow. In a modelling context, a surrounding conducting bath is an important parameter to consider, being used to represent either blood for an in-vivo scenario [4] or Tyrode’s solution for in-vitro perfused experimental comparisons [5], [6].
Although more recently used to simulate the effects of electrical shocks upon cardiac tissue [3], [5], [7], in the years following its inception, the bidomain model was often applied to simulate electrical propagation within tissue in the presence of a surrounding conducting bath [2], [8], [9]. In these studies, the bath was shown to provide a shunting effect to the current in the region close to the tissue-bath interface, lowering the effective extracellular resistance by providing a low resistance pathway for current to flow. This so-called bath-loading effect was seen to increase conduction velocity at the tissue surface, relative to the bulk, resulting in a curved transmural profile of the activation wavefront.
Despite the key role played by conductivity parameters in governing overall conduction velocity within simulations, experimental measurements of these parameters are wildly inconsistent [10], with large disparities existing even within the same species [11], [12]. As such, it is difficult for modellers to assign faithful conductivity parameters to their models. Often, conductivity tensors are adjusted to replicate experimentally-recorded conduction velocities, as it is well understood how conductivity parameters affect such global properties. However, how such changes to conductivities, or differences in experimentally-derived values, affect more subtle properties of the bidomain model, such as the bath-loading effect on the wavefront, have not yet been investigated.
In spite of the knowledge that a surrounding conducting media influences wavefront morphology [2], [8], [9], the monodomain approximation (where intra- and extracellular domains are assumed equally anisotropic), which cannot explicitly represent a bath, has been widely used to simulate electrical activity during propagation and investigations into cardiac arrhythmia mechanisms [13], [14], [15], [16], [17]. As arrhythmia studies generally require simulation over substantial periods of time (> 1s for example [16], [17]), performing full bidomain simulations on high-resolution whole ventricular models can represent a significant computational cost [18], thus favouring the monodomain approach (~ 10 times faster than bidomain [18]). However, heterogeneity in conduction velocity between tissue close to external surfaces and deep within the myocardium, induced by the bath-loading effect of the bidomain model, could lead to increased complexity, potentially representing an important modelling consideration in the study of arrhythmias. Although there exist established techniques to recover extracellular potential during monodomain simulations (either through infrequent solves of the elliptic portion of the bidomain equations [4] or using Φe recovery techniques assuming tissue is immersed in an unbounded volume conductor [19]) to compute ECG behaviour (a key advantage of the bidomain model), to date, there exists no way of representing the bath-loading effect within a computationally-efficient monodomain environment.
Therefore, the goal of this study is to: (1) provide a thorough investigation into the biophysical origin of the bath-loading induced wavefront curvature during propagation in bidomain simulations and how this effect depends upon conductivity parameters of both the tissue and surrounding bath; and, (2) present a novel monodomain equivalent bidomain model to accurately replicate the bath-loading effect of the bidomain model with a computationally-efficient monodomain representation which can be easily applied to models of any complexity and adapted to replicate the effects for any specific set of conductity values.
II. Methods
A. Geometrical Model
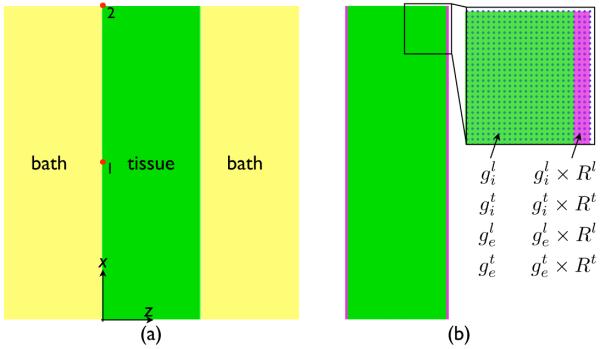
A regular tetrahedral finite element model, representing a 3D slab of myocardial tissue, was generated with the meshing software Mesher. The model had dimensions 3.0 cm × 0.01 cm × 1.0 cm in the x-, y- and z-directions, respectively, and included an additional representation of a perfusing bath of initial thickness 1.0 cm in the z-direction surrounding the tissue (shown in Fig. 1(a)). Node discretisation within the myocardial model was 100 μm, giving a total of 60802 nodes constituting 150000 tetrahedral elements. Anisotropic conduction within the model was represented through the assignment of a locally-prevailling cardiac fibre architecture within the model (the direction along which electrical propagation is most rapid). Two separate cardiac fibre architectures were considered: (1) fibre orientation parallel to the x-axis; and, (2) parallel to the y-axis.
Fig. 1.
Schematic representation of the method used to replicate the bath-loading effect of the bidomain model using an augmented monodomain approach. Three tissue elements immediately bordering the tissue edges at the tissue-bath interface (shown in purple) are assigned increased conductivity values, increased by the respective Rζ value for the fibre and cross-fibre directions (calculated via Eq. (10)). Highlighted region shows finite element nodes in blue.
In addition to the simplified slab model, a recently-published high-resolution MRI-derived rabbit ventricular finite element model [20] was also used. The model contains 4 million myocardial nodes points, consistuting 24 million tetrahedral finite elements, with a mean element edge-length of 130 μm, and sits within a perfusing bath surrounding the ventricles and filling all cavities.
B. Simulationg Electrical Activation
1) Governing Equations
Electrical activation throughout the ventricular model was simulated using the bidomain equations [1]
| (1) |
| (2) |
| (3) |
| (4) |
where  i and
i and  e are the intracellular and extracellular potentials, respectively, Vm =
  i−
i− e is the transmembrane voltage, σi and σe are the intracellular and extracellular conductivity tensors, respectively, β is the membrane surface to volume ratio, Im is the transmembrane current density, Iei and Ieb are extracellular stimuli applied in the interstitial space or the bath, respectively, Is is a transmembrane stimulus, Cm is the membrane capacitance per unit area, and Iion is the membrane ionic current density which depends on Vm and a set of state variables η. At tissue boundaries, no flux boundary conditions are imposed for
  i, with
  e being continuous. At the boundaries of the conductive bath surrounding the tissue, no flux boundary conditions for
  e are imposed.
In certain scenarios, it may be preferable to represent the cardiac tissue as a single conducting domain, whereby the bidomain equations may be reduced to the monodomain equation. Such a simplification assumes that the intra- and extracellular domains are anistropic, but to the same degree, allowing σi and σe to be related by a scalar, λ [21],
| (5) |
Substituting this relation into Eqs. (1) & (2), reduces the bidomain equations to the monodomain equations, of which, the sole equation required to simulate wave propagation is
| (6) |
where σm is the harmonic mean conductivity tensor or the effective bulk conductivity, related to σi and σe by
| (7) |
In one-dimension, the conductivity tensors degenerate to scalar values and the bidomain and monodomain formulations are fully equivalent with λ = σe/σi. In 3D, considering propagation along individual principal axes, the eigenvalues of σm are given as
| (8) |
where ζ = l|t are the two assumed eigendirections of the tissue along the cardiac fibre direction (ζ = l) and transverse to it (ζ = t). [Note that other authors have previously defined the bulk conductivity to be gbulk = gi + ge [22].]
2) Electrical Model Parameters
Cell membrane dynamics within the myocardial tissue were represented by a recent rabbit ventricular cell model [23]. Conductivities along the fibre (l) and cross-fibre (t) directions within the intracellular () and extracellular () domains were initially defined by default isotropic () or anisotropic () values, and later by previously experimentally-measured values from the literature, given in Table I. The default value of the conductivity of the extracellular bath (gb) was set to 1.0 S/m (isotropic).
TABLE I.
Conductivity values (S/M) from experimental studies by Clerc (1976) [24], Roberts et al. (1979) [11] and Roberts & Scher (1982) [12]
| Conductivity | Clerc (1976) | Roberts et al (1979) | Roberts & Scher (1982) |
|---|---|---|---|
| 0.17 | 0.28 | 0.34 | |
| 0.019 | 0.026 | 0.060 | |
| 0.62 | 0.22 | 0.12 | |
| 0.24 | 0.13 | 0.080 |
3) Computational Considerations
The bidomain equations were solved with the Cardiac Arrhythmia Research Package (CARP) [25]. The specifics of the numerical regimes used in CARP have been described extensively elsewhere [18], [25]. It is noted that an in-built property of CARP is the use of monodomain-equivalent bidomain conductivities (given by Eq. (8)), such that during monodomain simulations and are all provided to the simulator and gbulk is directly computed and used internally. Visualisation of results was performed with the custom written Meshalyzer software (courtesy of Dr Edward Vigmond).
4) Stimulation Protocol
The slab model, described in Section II-A, was paced through application of a transmembrane current pulse of magnitude 0.005 μA/cm3 over 1 ms duration along the x = 0 plane of the tissue to elicit propagation in the x-direction. In the case of the whole ventricular rabbit model, the pacing stimulus was applied to the apex of the ventricles. For each model, electrical activation was simulated separately using the bidomain equations in both the presence and absence of a surrounding conducting bath, termed the full bidomain (BDM) and bidomain no bath (BDMNB) cases, respectively. In addition, the protocol was repeated using the monodomain approach along with the novel augmented monodomain equivalent bidomain model (MDMEQ), the details of which are now described below.
C. Augmented Monodomain Equivalent Bidomain Model
1) Quantifying the Bath-Loading Effect
Within the centre of the tissue, far from the bath, the effective conductivity within the entire domain (intra- and extracellular) is given by gbulk, specified above in Eq. (8). However, for tissue in close proximity to the bath, current is shunted through the conductive bath which acts as a low resitance pathway [2], [26]. In this case, the extracellular conductivity of the tissue in this region can be thought of as being approximately equal to that of the bath, i.e. . Thus, the bulk conductivity at the tissue edge () along direction ζ can be approximately represented by
| (9) |
Therefore, an important parameter in predicting the magnitude of any bath-loading effect due to the presence of a surrounding conducting media is thus the ratio (Rζ) of the effective conductivity at the tissue edge, relative to the bulk conductivity experienced away from the boundaries
| (10) |
along each respective conductivity axis.
2) Representation within a Model
Using the above knowledge of how conductivity close to the tissue edge is impacted by the bath-loading effect in the bidomain regime, an augmented monodomain model, which sought to faithfully represent this effect, was developed, shown in Fig. 1(b). In the model, the three myocardial tissue elements nearest the tissue-bath interface were numerically tagged (shown in purple) and assigned specific conductivity values different to the rest of the myocardium (green). The augmented conductivity values () were chosen to be equal to
| (11) |
where is the corresponding default conductivity value in the given domain (intra-/extracellular) along the given direction (fibre or cross-fibre), and Rζ is the corresponding conductivity ratio along that direction, calculated from Eq. (10) for the given specific set of conductivity values in question.
D. Data Analysis
For all simulations, initial activation times of each node by the propagating activation wavefront within the model were computed. In the slab model, conduction velocity was calculated with respect to activation time differences between nodes 1 and 2 labelled in Fig. 1, situated at the tissue mid-point (x = 1.5 cm) and end (x = 3.0 cm).
III. Results
A. Effect of Bath Loading on Wavefront Morphology During Pacing
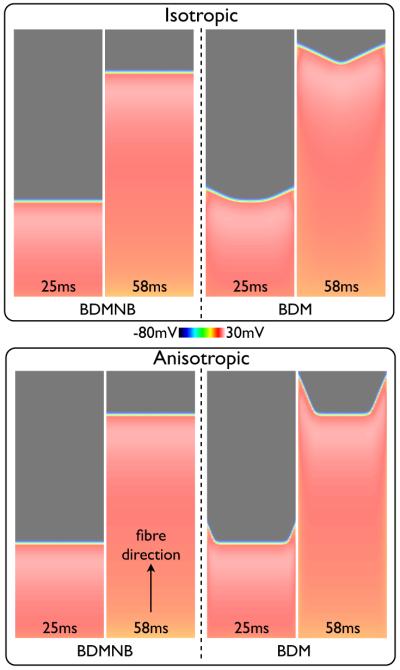
Fig. 2 shows snap-shots of the Vm distribution within the slab model at different instances in time following pacing for the BDMNB (left) and BDM (right) methods, with conductivities representing the isotropic (top) and anisotropic (bottom) cases. Here, we see that in both isotropic and anisotropic panels the wavefront in the BDMNB case is fully planar throughout its propagation. However, in the BDM case the wavefront exhibits a significant curvature with an increased conduction velocity at the tissue edges relative to the centre causing a V-shaped wavefront morphology, as seen in previous bidomain modelling studies [2], [26]. This V-shaped morphology is more pronounced in the anisotropic case, due to the increased conductivity along the fibre (x-) direction relative to the cross-fibre direction. Edge conduction velocity is 11.1% faster in the BDM case relative to the BDMNB case (49.3 vs. 44.3 cm/s, respectively) for isotropic conduction, and 15.2% faster (50.8 vs. 44.1 cm/s) for the anistropic case. The slight increase in BDM conduction velocity in the anistropic case is due to the increased concaved nature of the wavefront [27].
Fig. 2.
Snap-shots of Vm distribution within the slab model following a pacing stimulus along the x = 0 face for the BDMNB (left) and BDM (right) solution methods. Top panel shows the isotropic case (), bottom panel shows the anisotropic case (, ) with fibres aligned along the x-axis.
Furthermore, initially (25 ms images) the wavefront at the centre of the tissue in the BDM case propagates at approximately the same speed as the BDMNB wavefront, as tissue in this region is not directly affected by the presence of the bath. However, due to the angled propagation direction of the wavefront close to the tissue edge, steady-state (whereby all regions of the tissue have the same conduction velocity) is eventually reached, which can be seen happens more rapidly in the isotropic case.
B. Sensitivity of Bath-Loading Effect to Specific Conductivity Values
1) Influence of Different Standard Conductivity Sets
In Section III-A it was shown how the presence of a conducting bath along the tissue edges in the bidomain case increased local conduction velocity, affecting wavefront morphology. Here, we examine how the use of different standard conductivity sets influences this effect.
Fig. 3 shows Vm distributions following pacing with the BDM approach using the three different standard conductivity sets detailed in Table I for propagation along the fibre direction (left) and along the cross-fibre direction (right). For all conductivity sets, propagation along the fibre direction produces a more highly curved wavefront than along the cross fibre direction. In addition, the specific combination of conductivity parameter values used in the bidomain model is seen to significantly influence the interaction of the wavefront with the surrounding bath. For example, using the Clerc (1976) conductivity set produces a very small degree of curvature in the wavefront, whereas the Roberts & Scher (1982) conductivity set gives a pronounced V-shaped wavefront morphology for both propagation directions. Edge conduction velocity is 2.4% / 0.7% faster in the BDM case relative to the BDMNB case (Vm data not shown) for Clerc (1976) along the fibre / cross fibre directions, respectively, compared to 22.6% / 3.6% for Roberts et al. (1979) and 47.6% / 15.1% for Roberts & Scher (1982).
Fig. 3.
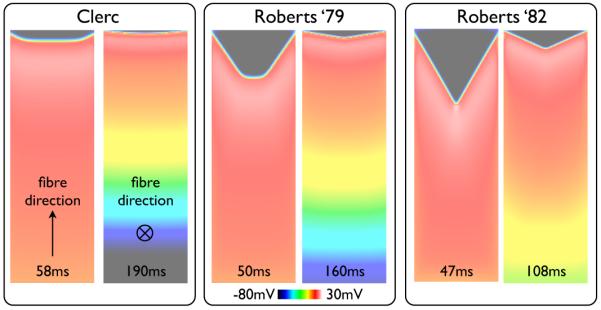
Snap-shots of Vm distribution within the slab model following pacing for simulations performed with the BDM approach using the three different standard conductivity sets given in Table I. For each conductivity set, the left image shows the case of propagation along the fibre direction, with the right image showing propagation along the cross-fibre direction. Times of each snap-shot following pacing are shown at the base of each image.
2) Relating Wavefront Curvature to Specific Conductitiy Values
In order to explain the large difference in the bath loading effect seen in Fig. 3 above for different standard conductivity sets, we begin by first considering the effective conductivity experienced by the tissue close to the boundary with the bath. In Section II-C, the parameter Rζ was introduced to define the ratio of the effective bulk conductivity experienced at the tissue edge in the presence of a bath, relative to that experienced deep within the bulk of the tissue. Table II calculates the respective values of Rζ for each set of standard conductivity values given in Table I in both fibre and cross-fibre directions (ζ = l, t) using Eq. (10).
TABLE II.
Bulk conductivity values (gbulk) and effective bulk conductivity at the edge shunted by the bath (gedge), along with the ratio between the two (Rζ) for both fibre (l) and cross-fibre (t) directions for the three standard conductivity sets of Table I
| Parameter | Clerc (1976) | Roberts et al (1979) | Roberts & Scher (1982 |
|---|---|---|---|
| 0.13 | 0.123 | 0.089 | |
| 0.145 | 0.219 | 0.254 | |
| Rl | 1.12 | 1.78 | 2.86 |
| 0.0176 | 0.022 | 0.034 | |
| 0.0186 | 0.025 | 0.057 | |
| Rt | 1.057 | 1.15 | 1.65 |
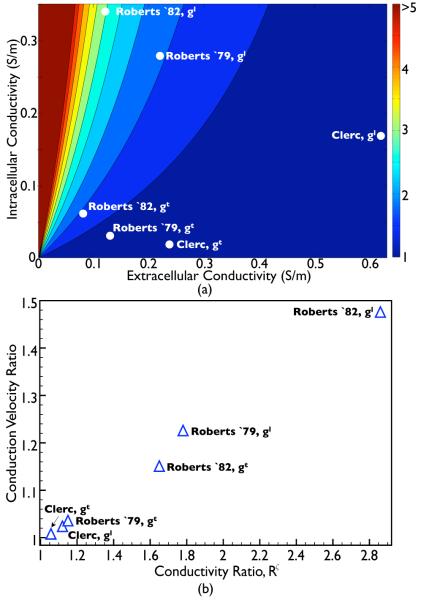
To investigate how the specific numerical values of the conductivity parameters influence the induced wavefront curvature through interaction with the conducting bath, Fig. 4(a) plots the variation in the conductivity ratio Rζ as a function of both gi and ge (for the default value of gb = 1.0 S/m) for fibre and cross-fibre directions (ζ = l, t). Also shown in the plot are the points corresponding to the values of Rζ derived from the standard conductivity sets given in Table II. Fig. 4 shows that large values of Rζ are given primarily for relatively small values of ge, along with large values of gi.
Fig. 4.
(a) 2-dimensional parameter space plot showing the variation in the conductivity ratio (Rζ) with intra and extracellular conductivity parameters. White dots within the plot show explicit values of Rζ for each standard conductivity set in both fibre and cross-fibre directions (ζ = l, t), as detailed in Table II. (b) Variation in the simulated effective conduction velocity of the BDM model at the tissue edge, relative to the conduction velocity experienced with the BDMNB model (for the same conductivity parameter set) as a function of the conductivity ratio Rζ given in Table II.
Fig. 4(b) investigates the relationship between the value of the conductivity ratio Rζ and the witnessed wavefront curvature induced by the bath as found from bidomain simulations. Here, the curvature is quantified by the relative conduction velocity experienced at the tissue edge for the BDM model (shown in Fig. 3) relative to the conduction velocity experienced at the tissue edge for the corresponding BDMNB case for the same conductivity set (Vm data not shown). Fig. 4(b) clearly demonstrates how, as Rζ increases, the conduction velocity at the tissue edge in the BDM model relative to the BDMNB model also increases in an approximately linear manner. Thus, the relative ‘effective’ conductivity descrepency between tissue edge and tissue centre, induced by the presence of the bath, provides a biophysical explanation for the increased wavefront curvature effect witnessed in Fig. 3.
C. Effect of Bath Parameters
Experimentally, the specific nature of the extracellular medium surrounding the tissue may vary. For example, optical mapping experiments of shock-induced arrhythmogenesis record activity from a heart entirely submerged within a perfusion bath, with many centimeters of bath surrounding the exterior heart surfaces [5], [6]. On the other-hand, other preparations may only be arterially-perfused, with just a thin layer (approximately < 0.5–2 mm [28]) of perfusate surrounding the tissue, keeping it alive. Furthermore, the nature and conductivity of the perfusing substance can also vary, for example, in-vivo the heart is perfused with blood, not Tyrode’s solution. Therefore, here we examine how the bath-loading effects on the wavefront witnessed above are affected by changes in the parameters defining the perfusing bath.
1) Influence of Bath Conductivity
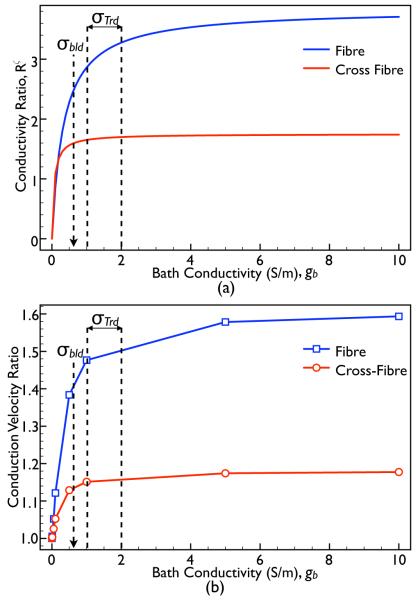
From Eq. (10), we can see that for particular values of gi and ge, the conductivity ratio Rζ is entirely a function of the bath conductivity, gb. Fig. 5(a) plots this analytical variation in Rζ as a function of gb, along both the fibre (blue) and cross-fibre (red) directions (using the Roberts & Scher (1982) standard conductivity set). In Fig. 5(b), we plot the conduction velocity ratio of the simulated BDM case relative to the BDMNB case (constant) measured within the slab model as gb is varied for both fibre (blue) and cross-fibre (red) directions with Roberts & Scher (1982) conductivities. Annotated in both panels are the previously published conductivity values of blood (σbld = 0.6 [2]) and Tyrode’s solution (σTrd = 1.0 → 2.0 [2], [9]).
Fig. 5.
(a) Plot showing the variation in the conductivity ratio parameter Rζ (with the Roberts & Scher (1982) standard conductivity set) as a function of the conductivity of the surrounding bath, gb, along both the fibre (blue) and cross-fibre (red) directions. (b) Variation in conduction velocity ratio of the BDM case relative to the BDMNB case as the conductivity of the bath (gb) with the model is varied for propagation along both the fibre (blue) and cross-fibre (red) directions.
In Fig. 5(a), we see a very rapid rise in Rζ as gb increases from 0 to approximately 0.5. This rapid increase in Rζ over such gb values is matched by an equally rapid increase in conduction velocity in the BDM case, demonstrated by Fig. 5(b), whilst for larger gb values, both Rζ and conduction velocity are seen to plateau. Importantly, we note that for the commonly used values of bath conductivities in simulations (blood or Tyrode’s solution), R and conduction velocity are both high and relatively constant. Finally, we see that as gbath → 0, the conduction velocity experienced by the BDM case tends to that of the BDMNB case (ratio tends to 1), as expected, which physically corresponds to the situation of an infinitely resistive bath surrounding the tissue (exposure to air, for example).
2) Influence of Bath Width
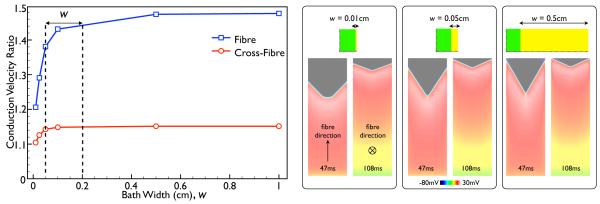
Fig. 6 shows the variation in the measured conduction velocity ratio of the BDM case relative to the BDMNB case within the slab model as the width of the bath surrounding the slab is varied, considering propagation in both the fibre (blue) and cross-fibre (red) directions, using Roberts & Scher (1982) conductivity set. Annotated on the plot is the range of typical perfusing bath widths (w) commonly used in experimental optical mapping set-ups (0.5–2 mm) [28].
Fig. 6.
Variation in conduction velocity ratio of the BDM case relative to the BDMNB case as the width of the bath is varied for propagation along both the fibre (blue) and cross-fibre (red) directions (using Roberts & Scher (1982) conductivities). Panels on right show snap-shots of Vm distributions within the slab model for 3 different bath widths, each showing both the case of propagation along the fibre (left) and the cross-fibre (right) directions, at the time instances given at the base of each image.
The Figure shows that, in both cases, the conduction velocity in the BDM case increases rapidly up until a bath width of approximately 0.1 cm, after which it is seen to plateau. However, even for the thinnest bath simulated (0.01 cm), the conduction velocity of the BDM case is still significantly faster than in the BDMNB case both along the fibre and cross-fibre directions with respective conduction velocity ratios of 1.21 and 1.10. Finally, throughout the range of w, the conduction velocity of the BDM case is always significantly greater than for the BDMNB case.
D. Representing the Bath-Loading Effect with an Augmented Monodomain Equivalent Bidomain Model
In the Sections above, it was shown how the presence of a surrounding conducting bath has a significant impact on both wavefront morphology and conduction velocity in the BDM model, which varies with the specific set of conductivity parameters used. Here, we demonstrate how the use of the MDMEQ presented in Section II-C can faithfully replicate these important features.
1) Proof of Principle
An important feature of the MDMEQ model is the use of the conductivity ratio Rζ (defined in (Eq. 10)) to scale the eigenvalues of the conductivity tensor of the tagged elements close to the tissue-bath boundary. This is important as Fig. 4 demonstrated how the value of Rζ is closely correlated with the witnessed increase in conduction velocity in the BDM relative to the BDMNB case.
Simulations were peformed using the MDMEQ slab model for each of the standard conductivity sets of Table I. For example, in the case of the Clerc (1976) conductivities, in the tagged edge region, the values of and are taken as those specified in Table I multiplied by Rl (1.12 from Table II), whereas the values of and are multiplied by Rt (1.057), with all other conductivities outside of the tagged region remaining unchanged. Simulation times for the MDMEQ model were approximately 7 times faster compared to the BDM model.
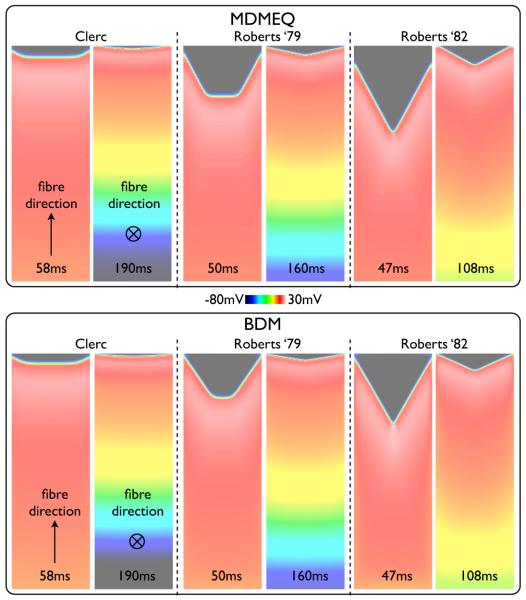
Fig. 7 shows the simulation results using the MDMEQ model (top) relative to those using the BDM model (centre, repeated from Fig. 3), showing snap-shots of Vm distributions at various times following pacing, comparing each of the three standard conductivity sets. As can be seen from the Figure, for all conductivity sets, the MDMEQ model faithfully recreates both the wavefront morphology and conduction velocity predicted by the more computationally-expensive BDM model. Times of activation of the end edge node point in the slab in the MDMEQ model were 59.12 ms / 189.78 ms for Clerc (1976), 51.64 ms / 160.79 ms for Roberts et al. (1979) and 50.82 ms / 107.49 ms for Roberts & Scher (1982) conductivities for propagation along the fibre/cross-fibre directions, respectively, compared to 58.61 ms / 190.21 ms, 50.17 ms / 161.32 ms and 47.49 ms / 108.06 ms using the BDM model, representing respective difference magnitudes of 0.87% / 0.23% for Clerc (1976), 2.93% / 0.33% for Roberts et al. (1979) and 7.01% / 0.53% for Roberts & Scher (1982) in activation times.
Fig. 7.
Snap-shots of Vm distribution within the slab model following a pacing stimulus with the MDMEQ model (left) using the three different standard conductivity sets given in Table I. For comparison, the same snap-shots from the BDM model are shown (right). For each case, both fibre (top) and cross-fibre (bottom) simulations are also shown, with the time of snap-shot shown at the base of the image.
Finally, APD values were calculated at all points along the transmural line of x = 2.5 cm in the model for the case of conductivity values specified by Roberts & Scher (1982) (which produced the most significantly curved wavefront) for both BDM and MDMEQ models. Differences in APD values between corresponding transmural locations were found to vary by < 2 ms between the two models, showing that the MDMEQ model successfully predicts both depolarisation and repolarisation wave morphologies.
2) Application to Complex Geometry
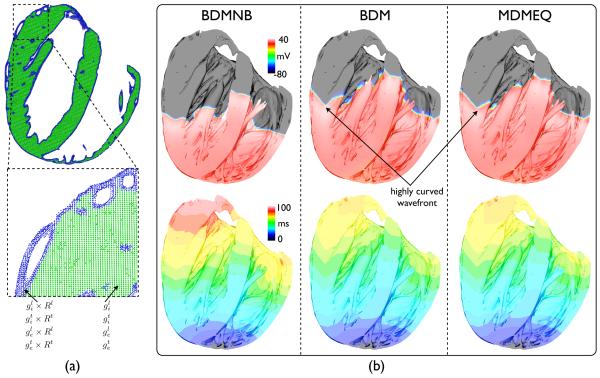
Here, we consider the application of the novel MDMEQ model, shown above to successfully replicate the conduction velocity and wavefront morphology of the BDM model on a simple slab model, to a high resolution rabbit ventricular model, described in Section II-A. Fig. 8(a) shows how the method of increasing conductivity in the edge elements is applied to the complex ventricular model. In this case, only the two myocardial tissue elements nearest to the tissue-bath interface are tagged (shown in blue), due to the increased element edge-length in the ventricular model relative to the simple slab model. Fig. 8(b) then shows simulation results following an apical stimulus with the Roberts & Scher (1982) conductivity set (Table I) using the BDMNB (left), the BDM (centre) and MDMEQ (right) approaches: top row show snap-shots 50 ms following the pacing stimulus of the Vm distribution throughout the ventricular cavities; bottom row shows time of first activation map plots.
Fig. 8.
(a) Schematic representation of the method used to replicate the BDM model wavefront shape and conduction velocity using the MDMEQ approach within the complex whole ventricular geometry, using the same method as shown in Fig. 1(b). Here, a longitudinal slice through the ventricles is shown with the two tissue elements immediately bordering the tissue edges at the tissue-bath interface (corresponding nodes shown in blue) tagged and assigned increased conductivity values, scaled by Rζ in the respective conductivity direction (ζ = l, t). (b) Simulation results following apical pacing within the whole-ventricular rabbit model using BDMNB, BDM and MDMEQ approaches. Top row shows snap-shots of Vm distribution throughout the ventricular cavities, where clipping planes have been used to facilitate visualisation of the activity within the cavities. Bottom row shows activation time maps (in ms) from the onset of the pacing stimulus until the time of first activation of each myocardial node point.
Clearly evident from snap-shots of Fig. 8(b) is the increased conduction velocity of tissue close to the tissue-bath interface in the BDM resulting in a significantly curved wavefront, relative to the BDMNB images. This effect is also visable from the isocontours within the activation maps. In addition, this increased conduction velocity seen within the BDM simulations results in a significantly faster total activation time of the ventricles (76.1 ms) relative to that seen in the BDMNB (93.4 ms) simulations. However, most importantly, both the increased wavefront curvature and the faster total activation time are replicated in the MDMEQ model (total activation time 78.7 ms, just 3.4% slower than the BDM model) - the isocontours of the activation maps of the BDM and MDMEQ models can be seen to be highly correlated to one-another throughout all regions of the ventricles.
IV. Discussion
Since the early application of bidomain theory, it has been well-known that the presence of a conducting bath surrounding the myocardium induces a curvature in the propagating activation wavefront via the bath-loading effect [2], [8], [9]. In this study, we have investigated the biophysical origins of this effect and focussed on its relationship to specific conductivity parameters of the system, known to vary widely in the literature [10]. This acquired knowledge has facilitated the development of a novel augmented monodomain equivalent bidomain model, which can faithfully replicate the bath-loading induced curvature in wavefront morphology due to associated differences in conduction velocity between tissue surface and bulk, specific to different conductivity sets, with a computationally inexpensive monodomain approach. The developed method can be used on both simplified as well as highly anatomically-complex cardiac models, and can be easily tuned to specifically represent different bidomain conductivity parameters.
A. Utility of Novel Monodomain-Equivalent Bidomain Model
Monodomain, not bidomain, models of cardiac electrical activity are almost exclusively used in computational investigations of cardiac arrhymia mechanisms [13], [14], [15], [16], [17] due to the relatively large load required to solve the bidomain problem over large-scale models [18]. The presented augmented monodomain equivalent bidomain modelling approach facilitates investigation of the consequences of the bath-induced wavefront curvature upon arrhythmic activity during very long duration simulations due to its much faster solution time, shown here to be approximately 7 times faster than the BDM model, on the particular set-up used here.
Differences in wavefront morphology and conduction velocity between the BDM model and the presented MDMEQ model were found to be very minor, relative to the overall accuracy of the simulations. Furthermore, no relevant deviations are expected for any simulation studies which require the computation of paced activation sequences, owing to the synchronising effect of stimulation. However, it remains to be investigated whether differences between the formulation arise over time in the case of more complex self-sustained activation patterns. Furthermore, although a previous study by Roth (1998) [29] showed how differences in anisotropy ratios could influence the trajectory of spiral wave tips during arrhythmias, no apparent difference in arrhythmia complexity was seen. Although our MDMEQ approach cannot explicity represent such anisotropy ratio-related effects, we believe that the bath-loading induced wavefront curvature which it does successfully represent will significantly dominate the resulting complexity of arrhythmias in bidomain representations. Thus, we believe our model, combined with the well-established Φe recovery techniques (allowing EGC information to be derived from Vm) [19], [4], therefore allows simulation of all relevant bidomain phenomena (other than extracellular stimulation) with a monodomain approach, facilitating investigation of arrhythmia mechanisms in long-duration simulations. However, it is important to note that, as the ECG is uniquely determined by the polarisation state of the tissue, the novel MDMEQ method presented here will result in a significantly better approximation of the ECG, due to the improved representation of the source distribution. Finally, for detailed studies of the effects of extracellular stimulation, however, the bidomain model remains the most appropriate choice, although the presented modified monodomain formulation can be employed right after stimulation effects have subsided, at least under the given stimulation protocol.
Furthermore, as the use of fully orthotropic representations of cardiac tissue become more widespread [30], our MDMEQ approach can be easily adapted to represent the increased conductivity along each of the three ortho-normal directions (as opposed to just the fibre and cross-fibre directions used here). However, this is will require accurate values of conductivities within both intra- and extracellular domains to be obtained for the fibre, sheet and sheet-normal directions, which can then be used to derive three separate conductivity ratios Rζ to scale the bulk conductivities along each respective direction.
B. Dependence of Bath-Loading Effect on Conductivity Parameters
In this study, we have demonstrated a significant variation in the witnessed bath-loading effects through using different standard published conductivity sets, commonly used in computational bidomain simulations [11], [12], [24]. This variation has been explained through investigation into the specific biophysical origin of the effect: we see a large curvature in the activation wavefront (and a large difference between surface conduction velocities between BDM and BDMNB cases) when there is a large difference in the ‘effective’ conductivity experienced by the bulk of the tissue close to the tissue-bath interface, relative to the effective conductivity within the centre of the tissue, away from external surfaces. The conductivity ratio Rζ defined here, which quantifies this difference in conductivity between edge and bulk, is a function of both the intra- and extracellular tissue conductivities ( and ) along a given direction ζ, as well as that of the surrounding bath (gb). Identifying such a dependence has allowed us to define a parameter that uniquely quantifies and predicts the expected bath-loading effects on the wavefront in terms of the specific conductivities of a given system. The results of this analysis thus provide an important consideration when choosing different conductivity values for bidomain studies.
Furthermore, the substantial magnitude of the effect witnessed for certain parameter sets (Roberts & Scher (1982), for example) thus suggests the importance of using a bidomain approach (or equivalent) when performing simulations of electrical activity, particularly with respect to studies of arrhythmias. Specifically, it remains an open question how wavefront curvature induced by the bath-loading affects filament stability and the evolution and resulting complexity of arrhythmias (as has shown to be important in the case of fibre rotation [13] and geometric surface curvature [31]), and, furthermore, how interactions with a conducting/insulating boundary may affect arrhythmia induction [32].
C. Role of the Surrounding Extracellular Bath
Computational cardiac models are often used to directly compare simulation results with ex-vivo experimental measurements [6] as well as to provide insight into the functioning of the heart in-vivo. In each case, the exact nature of the preparation, and more specifically the surrounding extracellular medium, can differ.
The results from this study (Fig. 6) have demonstrated that even the thinnest layer (~ 0.1 mm) of conducting medium in contact with the tissue surface will produce a significant bath-loading effect on the activation wavefront. Thus, the bath-loading effect is expected to be present when modelling both arterially-perfused Langendorf preparations (where only a very thin layer of perfusate would be expected to be on the tissue surface, sufficient to prevent ischemia) as well as when simulating ventricular models fully submerged in perfusing baths with filled ventricles.
Furthermore, the results of Fig. 5 demonstrated little differences in the expected bath-loading effect for conductivities of the surrounding bath of gb > 0.5 S/m. Thus, the effects of induced wavefront curvature would be expected to be present to a similar degree when modelling an in-vivo scenario of the heart in contact with blood within the cavities (gb ≈ 0.6 S/m [2], [4]) as when perfused with Tyrode’s solution (gb ≈ 1.0 – 2.0 S/m [2], [9]).
V. Conclusions
In summary, this study has investigated the bath-loading effects during cardiac bidomain simulations and presented a novel augmented monodomain equivalent bidomain model faithfully replicating all aspects of wavefront morphology and conduction velocity of the bidomain model within reasonable bounds of accuracy, but with a fraction of the computational cost (≈ 7 times faster than bidomain). The augmented monodomain equivalent model can be easily applied to simulate the bath-loading effects for any specific set of conductivity parameters, which are also shown to significantly influence the resulting wavefront curvature in bidomain simulations. However, bath-loading induced wavefront curvature is seen to be less dependent upon the thickness of the surrounding bath or its conductivity, with even relatively thin surrounding fluid layers (~ 0.1 mm) and relatively low gb (~ 0.5 S/m) still producing significant wavefront curvature in bidomain simulations. The results of this study have important implications in the use of bidomain and monodomain simulation approaches, particularly with respect to the investigation of cardiac arrhythmia mechanisms, as well as in the choice of particular conductivity values to use in each case. It is hoped that the use of the augmented monodomain equivalent bidomain model will facilitate the accurate simulation of cardiac wavefront dynamics at a reduced computational cost and aid in the faithful comparison of simulations with experiments.
Acknowledgements
The authors acknowledge the use of the computing resources provided the Oxford Supercomputing Centre (OSC).
M. Bishop is supported by the Wellcome Trust through a Sir Henry Wellcome Postdoctoral Fellowship. G. Plank is supported by Austrian Science Fund FWF grant (F3210-N18).
Biography
Martin J. Bishop received the M. Phys. degree in Physics (’03) and the D. Phil. degree in Computational Biology (’08) from the University of Oxford, UK. He is currently a Sir Henry Wellcome Postdoctoral Fellow based at the Computing Laboratory, University of Oxford, UK. His current research interests include computational cardiac modelling and imaging.

Gernot Plank received the M.Sc. (’96) and Ph.D. (’00) degrees in electrical engineering from the Institute of Biomedical Engineering, Technical University of Graz, Austria. Currently he is Associate Professor with the Institute of Biophysics, Medical University of Graz, Austria and Academic Fellow with the Oxford e-Research Centre, University of Oxford, UK. Prior, he was a Postdoctoral Fellow with the Technical University of Valencia, Spain (’00–’02), the University of Calgary, AB, Canada (’03) and Marie Curie Fellow with Johns Hopkins University (’06–’08). His research interests include computational modeling of cardiac bioelectric activity, microscopic mapping of the cardiac electric field and defibrillation.
Footnotes
Personal use of this material is permitted. However, permission to use this material for any other purposes must be obtained from the IEEE by sending an email to pubs-permissions@ieee.org.
Contributor Information
Martin J. Bishop, Computing Laboratory, University of Oxford, Oxford OX1 3QD, UK, martin.bishop@comlab.ox.ac.uk
Gernot Plank, Institute of Biophysics, Medical University of Graz, Graz, Austria and Oxford e-Research Centre, University of Oxford, Oxford, UK.
References
- [1].Henriquez CS. Simulating the electrical behavior of cardiac tissue using the bidomain model. Crit Rev Biomed Eng. 1993;21:1–77. [PubMed] [Google Scholar]
- [2].Henriquez CS, Muzikant AL, Smoak CK. Anisotropy, fiber curvature, and bath loading effects on activation in thin and thick cardiac tissue preparations: simulations in a three-dimensional bidomain model. J Cardiovasc Electrophysiol. 1996;7:424–44. doi: 10.1111/j.1540-8167.1996.tb00548.x. [DOI] [PubMed] [Google Scholar]
- [3].Trayanova N, Plank G, Rodríguez B. What have we learned from mathematical models of defibrillation and postshock arrhythmogenesis? application of bidomain simulations. Heart Rhythm. 2006:1232–1235. doi: 10.1016/j.hrthm.2006.04.015. [DOI] [PMC free article] [PubMed] [Google Scholar]
- [4].Potse M, Dubé B, Richer J, Vinet A, Gulrajani RM. A comparison of monodomain and bidomain reaction-diffusion models for action potential propagation in the human heart. IEEE Trans Biomed Eng. 2006;53:2425–35. doi: 10.1109/TBME.2006.880875. [DOI] [PubMed] [Google Scholar]
- [5].Rodriguez B, Li L, Eason J, Efimov I, Trayanova N. Differences between left and right ventricular chamber geometry affect cardiac vulnerability to electric shocks. Circ Res. 2005;97:168–175. doi: 10.1161/01.RES.0000174429.00987.17. [DOI] [PMC free article] [PubMed] [Google Scholar]
- [6].Bishop MJ, Rodriguez B, Qu F, Efimov IR, Gavaghan DJ, Trayanova NA. The role of photon scattering in optical signal distortion during arrhythmia and defibrillation. Biophys J. 93:3714–26. doi: 10.1529/biophysj.107.110981. [DOI] [PMC free article] [PubMed] [Google Scholar]
- [7].Fenton F, Luther S, Cherry E, Otani N, Krinsky V, Pumir A, Bodenschatz E, Gilmour RF. Termination of atrial fibrillation using pulsed low-energy far-field stimulation. Circulation. 2009;120:467–76. doi: 10.1161/CIRCULATIONAHA.108.825091. [DOI] [PMC free article] [PubMed] [Google Scholar]
- [8].Plonsey R, Henriquez C, Trayanova N. Extracellular (volume conductor) effect on adjoining cardiac muscle electrophysiology. Med & Biol Eng & Comp. 1988;26:126–9. doi: 10.1007/BF02442253. [DOI] [PubMed] [Google Scholar]
- [9].Roth BJ. Effect of a perfusing bath on the rate of rise of an action potential propagating through a slab of cardiac tissue. Annals Biomed Eng. 1996;24:639–46. doi: 10.1007/BF02684177. [DOI] [PubMed] [Google Scholar]
- [10].Roth B. Electrical conductivity values used with the bidomain model of cardiac tissue. IEEE Trans Biomed Eng. 1997;44:326–328. doi: 10.1109/10.563303. [DOI] [PubMed] [Google Scholar]
- [11].Roberts DE, Hersh LT, Scher AM. Influence of cardiac fiber orientation on wavefront voltage, conduction velocity, and tissue resistivity in the dog. Circ Res. 1979;44:701–12. doi: 10.1161/01.res.44.5.701. [DOI] [PubMed] [Google Scholar]
- [12].Roberts DE, Scher AM. Effect of tissue anisotropy on extracellular potential fields in canine myocardium in situ. Circ Res. 1982;50:342–51. doi: 10.1161/01.res.50.3.342. [DOI] [PubMed] [Google Scholar]
- [13].Fenton F, Karma A. Vortex dynamics in three-dimensional continuous myocardium with fiber rotation: filament instability and fibrillation. Chaos. 1998;8:20–47. doi: 10.1063/1.166311. [DOI] [PubMed] [Google Scholar]
- [14].Qu Z, Kil J, Xie F, Garfinkel A, Weiss JN. Scroll wave dynamics in a three-dimensional cardiac tissue model: roles of restitution, thickness, and fiber rotation. Biophys J. 2000;78:2761–75. doi: 10.1016/S0006-3495(00)76821-4. [DOI] [PMC free article] [PubMed] [Google Scholar]
- [15].Xie F, Qu Z, Yang J, Baher A, Weiss J, Garfinkel A. A simulation study of the effects of cardiac anatomy in ventricular fibrillation. J Clin Invest. 2004;113:686–693. doi: 10.1172/JCI17341. [DOI] [PMC free article] [PubMed] [Google Scholar]
- [16].Tusscher KT, Hren R, Panfilov A. Organization of ventricular fibrillation in the human heart. Circ Res. 2007 doi: 10.1161/CIRCRESAHA.107.150730. [DOI] [PubMed] [Google Scholar]
- [17].Clayton RH. Vortex filament dynamics in computational models of ventricular fibrillation in the heart. Chaos. 2008;18:043127. doi: 10.1063/1.3043805. [DOI] [PubMed] [Google Scholar]
- [18].Plank G, Burton RAB, Hales P, Bishop M, Mansoori T, Bernabeu MO, Garny A, Prassl AJ, Bollensdorff C, Mason F, Mahmood F, Rodriguez B, Grau V, Schneider JE, Gavaghan D, Kohl P. Generation of histo-anatomically representative models of the individual heart: tools and application. Phil Trans Roy Soc A. 2009;367:2257–92. doi: 10.1098/rsta.2009.0056. [DOI] [PMC free article] [PubMed] [Google Scholar]
- [19].Clayton R, Holden AV. Computational framework for simulating the mechanisms and ecg of re-entrant ventricular fibrillation. Physiol Meas. 2002;23:707–26. doi: 10.1088/0967-3334/23/4/310. [DOI] [PubMed] [Google Scholar]
- [20].Bishop M, Plank G, Burton R, Schneider J, Gavaghan D, Grau V, Kohl P. Development of an anatomically-detailed mri-derived rabbit ventricular model and assessment of its impact on simulation of electrophysiological function. Am J Physiol Heart Circ Physiol. 2010 doi: 10.1152/ajpheart.00606.2009. [DOI] [PMC free article] [PubMed] [Google Scholar]
- [21].Nielsen B, Ruud T, Line G, Tveito A. Optimal monodomain approximations of the bidomain equations. App Math Comp. 2007;184:276–90. [Google Scholar]
- [22].Hooks DA, Trew ML, Caldwell BJ, Sands GB, LeGrice IJ, Smaill BH. Laminar arrangement of ventricular myocytes influences electrical behavior of the heart. Circ Res. 2007;101:e103–12. doi: 10.1161/CIRCRESAHA.107.161075. [DOI] [PubMed] [Google Scholar]
- [23].Mahajan A, Shiferaw Y, Sato D, Baher A, Olcese R, Xie L-H, Yang M-J, Chen P-S, Restrepo J, K. ad A, Garfinkel A, Qu Z, Weiss JN. A rabbit ventricular action potential model replicating cardiac dynamics at rapid heart rates. Biophys J. 2008;94:392–410. doi: 10.1529/biophysj.106.98160. [DOI] [PMC free article] [PubMed] [Google Scholar]
- [24].Clerc L. Directional differences of impulse spread in trabecular muscle from mammalian heart. J Physiol (Lond) 1976;255:335–46. doi: 10.1113/jphysiol.1976.sp011283. [DOI] [PMC free article] [PubMed] [Google Scholar]
- [25].Vigmond E, Hughes M, Plank G, Leon L. Computational tools for modeling electrical activity in cardiac tissue. J Electrocardiol. 2003;36:69–74. doi: 10.1016/j.jelectrocard.2003.09.017. [DOI] [PubMed] [Google Scholar]
- [26].Roth BJ. Influence of a perfusing bath on the foot of the cardiac action potential. Circ Res. 2000;86:E19–22. doi: 10.1161/01.res.86.2.e19. [DOI] [PubMed] [Google Scholar]
- [27].Qu Z, Xie F, Garfinkel A, Weiss JN. Origins of spiral wave meander and breakup in a two-dimensional cardiac tissue model. Annals Biomed Eng. 2000;28:755–71. doi: 10.1114/1.1289474. [DOI] [PubMed] [Google Scholar]
- [28].Plank G, Prassl A, Hofer E, Trayanova NA. Evaluating intramural virtual electrodes in the myocardial wedge preparation: simulations of experimental conditions. Biophys J. 2008;94:1904–15. doi: 10.1529/biophysj.107.121343. [DOI] [PMC free article] [PubMed] [Google Scholar]
- [29].Roth B. Frequency locking of meandering spiral waves in cardiac tissue. Physical Rev E. 1998;57:R3735–38. [Google Scholar]
- [30].Hooks D, Tomlinson K, Marsden S, LeGrice I, Smaill B, Pullan A, Hunter P. Cardiac microstructure: implications for electrical propagation and defibrillation in the heart. Circ Res. 2002;91(4):331–338. doi: 10.1161/01.res.0000031957.70034.89. [DOI] [PubMed] [Google Scholar]
- [31].Rogers J. Wave front fragmentation due to ventricular geometry in a model of the rabbit heart. Chaos. 2002;12:779–87. doi: 10.1063/1.1483956. [DOI] [PubMed] [Google Scholar]
- [32].Siso-Nadal F, Otani N, Gilmour R, Fox J. Boundary-induced reentry in homogeneous excitable tissue. Physical Review E. 2008;78:031925. doi: 10.1103/PhysRevE.78.031925. [DOI] [PMC free article] [PubMed] [Google Scholar]


