Abstract
Ionotropic glutamate receptors (iGluRs) are ligand-gated ion channels that mediate the majority of excitatory synaptic transmission in the central nervous system. The free energy of neurotransmitter-binding to the ligand-binding domains (LBDs) of iGluRs is converted into useful work to drive receptor activation. Here, the principal thermodynamic contributions from ligand-docking and ligand-induced LBD closure are computed for nine ligands of GluA2 using all-atom molecular dynamics free energy simulations. The results are validated by a comparison with experimentally measured apparent affinities to the isolated LBD. Features in the free energy landscapes governing LBD closure are critical determinants of binding free energies. An analysis of accessible LBD conformations transposed into the context of an intact GluA2 receptor reveals that the relative displacement of specific diagonal subunits in the tetrameric structure may be key to the action of partial agonists.
INTRODUCTION
Ionotropic glutamate receptors (iGluRs) are tetrameric protein complexes that transduce chemical signals carried by neurotransmitter molecules into electrical impulses propagated in the postsynaptic neuron. Each protein subunit includes an amino-terminal domain (ATD) and a cytoplasmic carboxy-terminal domain (CTD) involved in receptor assembly, trafficking and regulation, a transmembrane domain (TMD) forming the membrane-spanning ion channel, and a ligand-binding domain (LBD) which is key to channel gating1. The binding of agonist molecules to the LBDs drives the opening of the transmembrane pore, allowing cations to flow across the cell membrane to trigger the generation of a nerve impulse. Full agonists such as glutamate display the highest observed levels of efficacy at the receptor, while antagonists block receptor activation, and partial agonists produce sub-maximal response when applied at saturating concentrations.
The LBD is a flexible clamshell-shaped protein, which makes a conformational transition from an open to a closed state upon the binding of an agonist molecule into the cleft separating its two lobes. Four LBDs are tethered to the TMD via short linkers, and once the LBDs close down to encapsulate the ligand, the local conformational change is assumed to force the opening of the TM channel2. A central issue is to understand how the binding of different ligands leads to, or inhibits, the activation of the receptor. One possible mechanism, inferred from crystal structures of LBD–ligand complexes, is that ligand efficacy is directly correlated with the amount of cleft closure induced by the bound ligand3. There are discrepancies, however, which are not fully understood. For example, the LBD of NR1 and GluK5 subunits have been shown to close fully even when bound to partial agonists4,5. The relative twist between the two lobes has also been suggested to be important6–8. Such observations suggest that a purely “structural” explanation, based solely on cleft closure is not completely satisfactory.
Alternatively, a “dynamical” mechanistic perspective might be that full agonists succeed in tightly closing down the clamshell via strong LBD–ligand interactions, while bound partial agonists exert only weak cleft-closing forces and are thus unable to prevent transient fluctuations leading to partial re-openings of the LBD. The measured binding affinities of some antagonists to the isolated GluA2 LBD are stronger than the affinities of some agonists, which suggest that only a fraction of the total binding free energy is available to close the LBD and activate the receptor3,9. A number of studies have shown that the efficacy of an agonist can also be modulated by the stability of the closed LBD–agonist complex10–13.
A contrast can be drawn between the “structural” and “dynamical” views, where function is either explained by X-ray structures of the LBD in complex with different ligands or by the fluctuations and transient excursions of the LBD away from a static conformation, although both are necessarily oversimplified. Nevertheless, it is difficult to achieve a deeper understanding of the mechanism of activation of iGluR receptors without a detailed dissection of the different thermodynamic contributions associated with ligand-binding and LBD closure, which provides the link between structure and dynamics. Although central to understanding the activation mechanism of ligand-gated receptors, such thermodynamic information is difficult to access directly by experimental means, and remains essentially “hidden” from direct observations. In this paper, the free energy contributions governing the distinct sub-processes of ligand-docking and LBD closure for the GluA2 receptor from Rattus norvegicus are determined for nine different ligands using all-atom molecular dynamics (MD) simulations with explicit solvent molecules. The results are then used to carry out an analysis of LBD conformational distributions in the context of a full-length receptor, revealing key structural asymmetries that may impact activation.
RESULTS
Ligand-binding free energy calculations
To provide a broad perspective on the different modes of ligand action on the GluA2 receptor, the binding of three full agonists, three partial agonists, and three antagonists was characterized with all-atom MD simulations with explicit solvent (Fig. 1). The absolute binding free energies between each ligand and the flexible LBD were computed as the sum of separate contributions corresponding to different steps of the ligand-binding process (see Online Methods). This computational approach, based on umbrella sampling potential of mean force (PMF) calculations, follows from a rigorous statistical mechanical formulation of noncovalent binding14 (see Theory in Supplemental Information). This procedure involving applied restraints limits the amount of configurational space the ligand must sample while rigorously accounting for the associated free energies (see Fig. 2 and Supplementary Figs. 1 and 2). The computations represent a total aggregate simulation time of ~1 µs.
Figure 1.
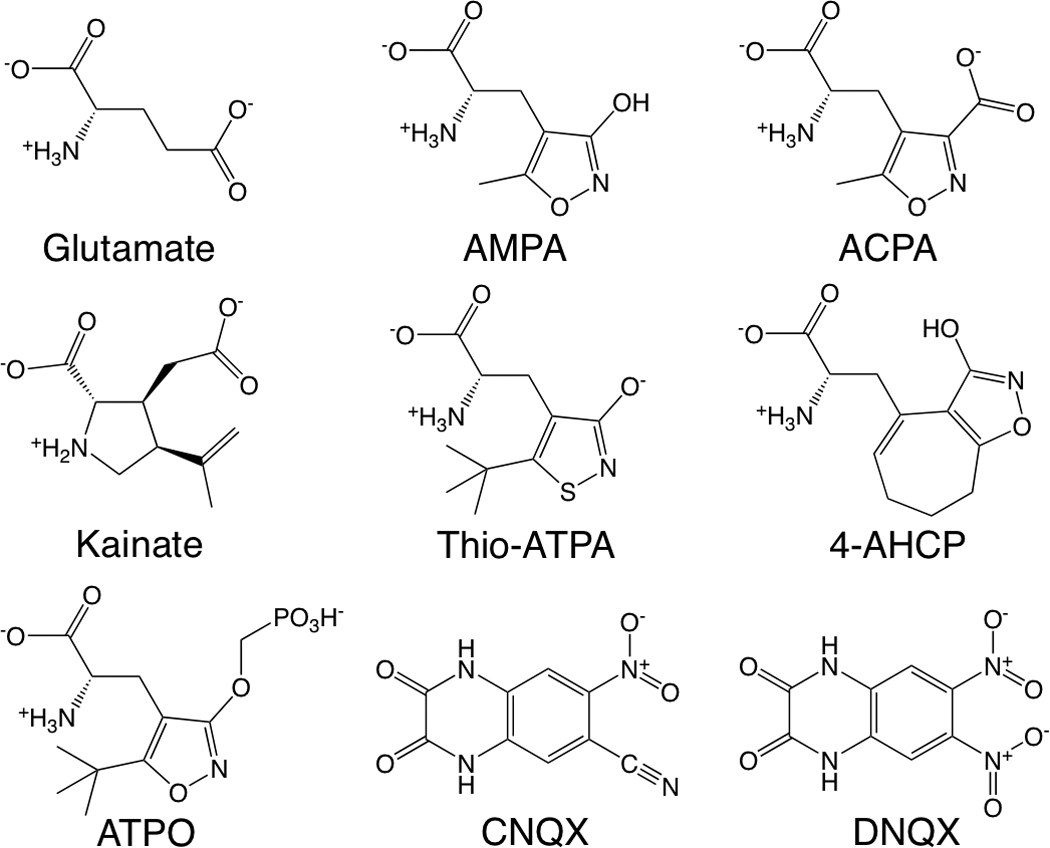
Ligands of GluA2. The full agonists (top row) are glutamate, α-amino-3-hydroxy-5-methyl-4-isoxazole propionic acid (AMPA), and (S)-2-amino-3-(3-carboxy-5-methylisoxazol-4-yl)propionic acid (ACPA). The partial agonists (middle row) are kainate, (S)-2-amino-3-(3-hydroxy-5-tert-butyl-4-isothiazolyl)propionic acid (thio-ATPA), and (S)-2-amino-3-(3-hydroxy-7,8-dihydro-6H-cyclohepta[d]-4-isoxazolyl)propionic acid (4-AHCP). The antagonists (bottom row) are (S)-2-Amino-3-[5-tert-butyl-3-(phosphonomethoxy)-4-isoxazolyl]propionic acid (ATPO), 6-cyano-7-nitroquinoxaline-2,3-dione (CNQX), and 6,7-dinitroquinoxaline-2,3 dione (DNQX). Crystal structures of each of these ligands in complex with the GluA2 LBD are used for our molecular models3,6,9,22–24.
Figure 2.
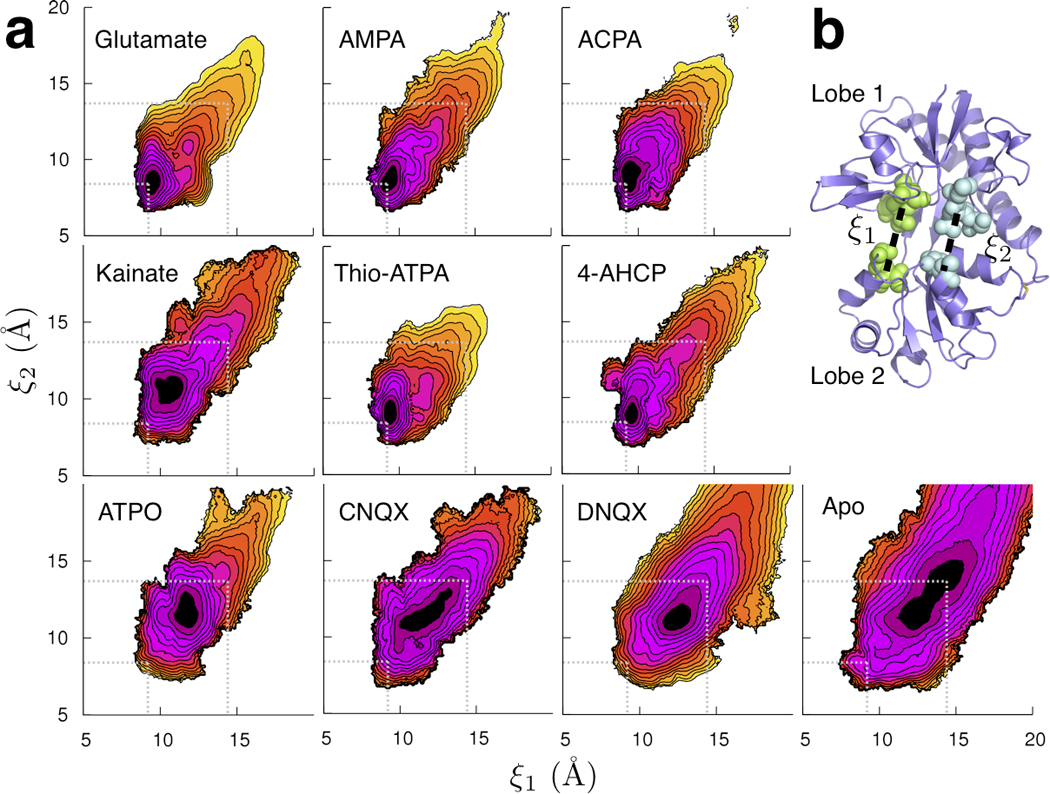
LBD conformational distributions. (a) The free energy landscapes governing LBD closure for the holo and apo proteins calculated from all-atom umbrella sampling MD simulations with explicit solvent. Each contour line corresponds to 1 kcal mol−1, with the darker colors indicating more favorable conformations. The free energy minimum associated with the most closed conformation is for AMPA (ξ1, ξ2) = (9.2 Å, 8.4 Å). The conformation used for the ligand-docking simulations is (14.4 Å, 13.7 Å). These locations are indicated by the dotted lines in each panel for reference. (b) The 2D order parameter (ξ1, ξ2) describing closure of the GluA2 LBD. Each distance (dashed line) is measured between the center-of-mass (COM) of the residues whose atoms are shown as spheres. The crystal structure of the open, apo LBD (1FTO) is shown.
Spectroscopic and stopped-flow kinetic analyses indicate that ligands dock into a pocket formed by residues P478, T480, and R485 in Lobe 1 before forming additional interactions with residues in Lobe 29,15,16. In the ligand-docking simulations, the LBD is restrained to an open conformation that allows a ligand to access its docking site ((ξ1, ξ2) = (14.4 Å, 13.7 Å)). Atomic-scale fluctuations around the open conformation are sampled, but closure of the LBD is not permitted. This conformation is within the computed free energy basin of the apo LBD and is therefore predicted to be visited frequently by the protein prior to ligand-docking (see Fig. 2 and Supplementary Fig. 3).
The free energy contributions from both ligand-docking , and LBD closure, ΔGclose, are required to correctly calculate the binding affinity between a ligand and a flexible protein. As observed from Figure 3a, the docking step, by itself, is insufficient to predict affinity, as evidenced by the lack of correlation between and the experimentally measured binding free energies. This is expected since docking is only one of several contributions that must be taken into account (see Eq. 1 in Online Methods). A moderate correlation exists between ΔGclose and the experimental values (Fig. 3b), but a very strong correlation exists when the sum of the docking and LBD closure components, , is considered (Fig. 3c). The correlation coefficient R2 is 0.879 with a slope of 1.039, implying that the computed binding affinities are in excellent agreement with experimental measurements. Glutamate and thio-ATPA have positive ΔGdock, indicating that docking into the LBD from bulk solvent is an unfavorable process for these two ligands (see Fig. 3a). The substantial gain in free energy from LBD closure, however, compensates for the unfavorable resulting in a favorable ΔGbind (see Fig. 3b,c). The antagonists CNQX and DNQX exhibit the most favorable docking free energies among the nine ligands. ΔGclose for all nine ligands are negative, but ΔGclose for CNQX and DNQX are the smallest in magnitude. See Supplementary Table 1 for all components of the absolute binding free energies for all nine ligands. The free energy contributions for glutamate and kainate are consistent with hydrogen-deuterium (HD) exchange measurements17. The broader free energy basin for CNQX vs. DNQX is also consistent with the HD exchange measurements, reflecting lobe dynamics for CNQX that are not observed for DNQX.
Figure 3.
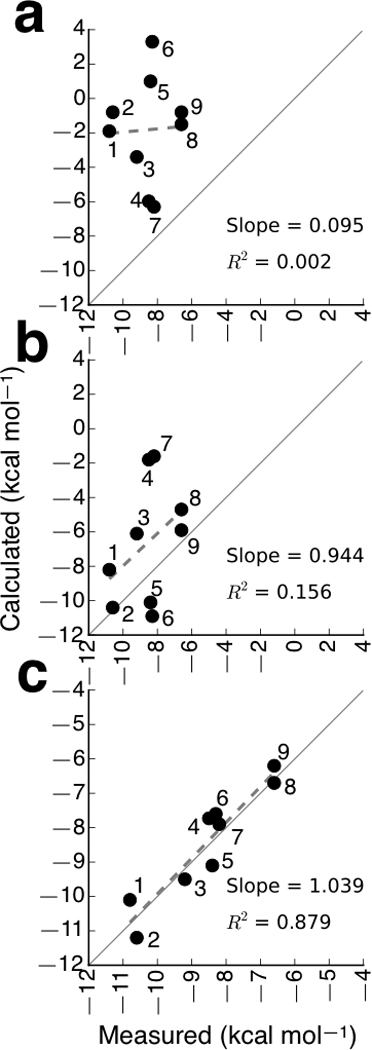
Comparison of calculated free energy contributions with experimentally measured effective ligand-binding affinities to the isolated GluA2 LBD. (a) Calculated . (b) Calculated ΔGclose. (c) Calculated . In each plot, the solid line, which has slope = 1, indicates perfect agreement between the calculated and experimental values. The dashed lines are linear regression fits to the data, and their slopes and correlation coefficients are reported. Each ligand is marked numerically in increasing order from the highest experimentally measured affinity to the lowest affinity (see Supplementary Table 1): 1 = AMPA, 2 = ACPA, 3 = 4-AHCP, 4 = CNQX, 5 = glutamate, 6 = thio-ATPA, 7 = DNQX, 8 = kainate, and 9 = ATPO.
An issue of practical importance is whether the charged ligands might tend to change their protonation states upon binding to the LBD. Free energy perturbation (FEP) calculations indicate that the ionizable groups on the ligands can be modeled to retain their bulk solvent protonation states, even when fully bound (see Fig. 1, Supplementary Table 2 and Supplementary Methods). These states are in agreement with Fourier transform infrared measurements18. Calculation of the binding free energy for alternate protonation states of AMPA and 4-AHCP, i.e., states determined to be inappropriate, give values that agree less well with the experimental measurements (see Supplementary Table 3).
Free energy landscapes are critical to evaluating binding
Having validated the computational methodology and the MD simulations by comparing with experimentally measured dissociation constants for nine ligands, it is of interest to examine next the role of the individual free energy contributions that are “hidden” in the total binding free energy on receptor activation. An interesting question, in particular, is whether the amount of free energy associated with LBD closure ΔGclose—clearly a key component in receptor activation—is accurately reflected in crystal structures of the LBD–ligand complexes. Supplementary Figure 4 shows that the calculated ΔGclose and the extent of LBD closure seen in the crystal structures relative to the AMPA structure are only weakly correlated (R2 = 0.569), suggesting that the extent of closure, by itself, cannot account for the free energy associated with the protein's conformational transition. The LBD free energy landscapes displayed in Figure 2, therefore, appear to be critical to assess ΔGclose. All the free energy landscapes feature a single major free energy basin. The locations of the global free energy minima for the nine ligands are in good agreement with the crystal structure conformations of each LBD–ligand complex. The largest discrepancy is observed for kainate, where the predicted ”most favored” LBD conformation is more open than is observed crystallographically ((Δξ1, Δξ2) = (1.2 Å, 1.4 Å)), the crystal structure conformation being higher in free energy by ~1.8 kcal mol−1. The kainate landscape suggests that this weak partial agonist may stabilize a relatively open LBD conformation, but rare transitions to more closed conformations could trigger channel activation. Importantly, the locations of these minima for the nine ligands are generally segregated as expected when ranked in terms of the effective one-dimensional coordinate (ξ1 + ξ2)/2: full agonists < partial agonists < antagonists, (see Fig. 2 and Supplementary Table 4).
Topological features in the free energy landscapes
The detailed topological features in the different landscapes, as well as the number and shapes of shallow metastable states surrounding the basins, differ among the nine ligands, even within the full agonist, partial agonist, and antagonist classes. A metastable state in the glutamate landscape that corresponds to the largest cleft opening at which the ligand forms interactions with both Lobes 1 and 2 has previously been described19. This conformation is (ξ1, ξ2) ≈(12.0 Å, 11.0 Å). Topological features resembling finger-like extensions from the free energy basin are seen in a similar location in the AMPA, thio-ATPA, and 4-AHCP landscapes (see Fig. 2 and Supplementary Fig. 5). The topologies of the glutamate and thio-ATPA landscapes suggest that LBD closure from (ξ1, ξ2) = (12.0 Å, 11.0 Å) proceeds first along ξ2 followed by ξ1. Conversely, the AMPA landscape suggests closure first along ξ1 followed by ξ2. Either trajectory seems plausible for 4-AHCP. The broad, shallow basin for ACPA suggests a more diffusive pathway of closure. For kainate and the antagonists, (ξ1, ξ2) = (12.0 Å, 11.0 Å) is near the free energy minimum. Free energy landscapes for two LBD mutants, T686A and T686S, have previously been described19 and were found to be consistent with experimental observations that indicate T686 mutations destabilize cleft closure10.
LBD conformational distributions in an intact receptor
It is of interest to try to clarify how the local conformational change within the LBD might impact the TMD in the context of an intact full-length receptor using the present sets of MD free energy landscapes. To address this question, LBD snapshots spanning the free energy landscapes taken from the MD simulations were transposed onto the crystal structure of an intact GluA2 receptor2 (see Fig. 4a). Only the residues in Lobe 1 of the LBD were superimposed, thereby preserving the back-to-back dimer interfaces as well as the relative disposition of all four LBDs with respect to the ATDs. All tetrameric combinations of snapshot configurations were assembled. The proper Boltzmann weight of each snapshot, p(ξ1, ξ2), was obtained directly from the free energy landscapes, p(ξ1, ξ2) ∝ exp[−βW (ξ1, ξ2)], where β−1 = kBT is the Boltzmann constant times temperature. This structural analysis therefore reflects an equilibrium ensemble of the complexes in the different accessible states, and also assumes that each LBD opens and closes independently of the others. The following Boltzmann-weighted displacements were then calculated: (1) the root-mean-squared-displacement (r.m.s.d.) between the superimposed LBD tetramer and the LBD tetramer from the crystallized GluA2 receptor, and (2) the six pairwise distances between the LBDs. The r.m.s.d.s and distances involve a selection of residues in Lobe 2 near the region that connects to the TMD (see Online Methods). The r.m.s.d. was measured with respect to the Cα atoms, and the pairwise distances were measured between the center-of-mass (COM) of these atoms.
Figure 4.
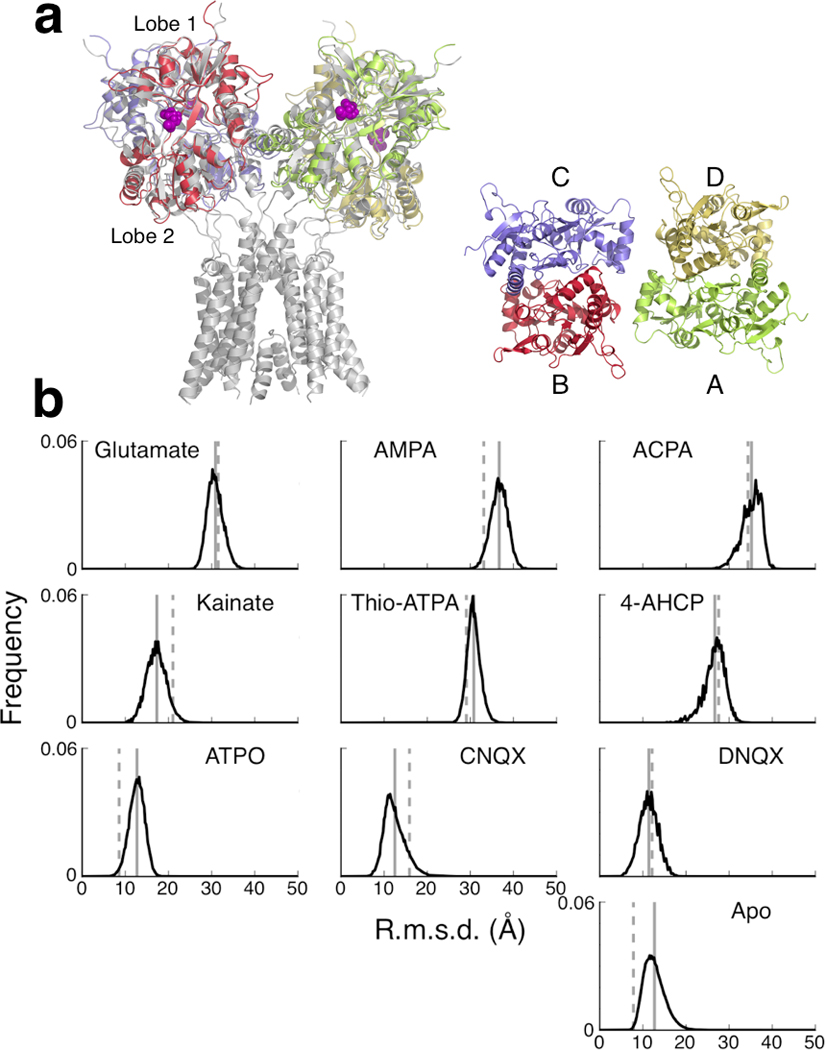
LBD conformational distributions in the context of an intact receptor. (a, left) Superposition of LBD conformations spanning the free energy landscapes onto the crystal structure of the intact GluA2 receptor (gray2; the ATD is not shown). The LBDs were superimposed only in Lobe 1. (a, right) Labeling of the four LBDs in an intact iGluR, as viewed from above. The LBDs assemble as a pair of dimers, where A–D is one dimer and B–C is the other. (b) R.m.s.d. distributions of LBD conformations relative to the intact receptor. The r.m.s.d. was measured in regions in Lobe 2 (see Online Methods). The solid line indicates the average r.m.s.d. (see Supplementary Table 5). The dashed line indicates the r.m.s.d. measured from the isolated LBD–ligand crystal structure.
The LBDs of the intact GluA2 structure are in open conformations since they are bound to the antagonist ZK20077520. LBD–agonist conformations deviate more than the LBD–antagonist or apo LBD conformations. Histograms of the Boltzmann-weighted r.m.s.d. measurements in the LBDs for the holo and apo forms are shown in Figure 4b. Overall, the averages of the r.m.s.d. distributions come up as expected, with full agonists > partial agonists > antagonists (see Supplementary Table 5). For some ligands, e.g., glutamate, the average r.m.s.d. closely agrees with the r.m.s.d. obtained by directly superimposing the LBD–ligand crystal structure. For other ligands, e.g., AMPA, as well as the apo LBD, the differences between the thermal averages and the crystal structures are pronounced. These differences suggest that the crystal structure conformations of the different LBD–ligand complexes do not always quantitatively account for the amount of conformational change that ligand-binding may be able to transmit to the TMD. For example, the LBD–AMPA crystal structure underestimates the average amount of conformational change the LBD samples upon binding AMPA, and the LBD–kainate crystal structure overestimates it. Since the (ξ1, ξ2) corresponding to the computed global free energy minima agree well with the (ξ1, ξ2) of the respective crystal structures (see Supplementary Table 4), the differences in the r.m.s.d. distributions arise necessarily from the features in the free energy landscapes governing LBD closure.
A different perspective on the amount of useful work that the LBDs can transmit to the TMD is revealed by considering the Boltzmann-weighted pairwise distances between Lobes 2 for the holo and apo LBDs. Histograms of these measurements are shown in Figure 5. These distributions provide mechanistic inferences in terms of the amount of conformational change that can be transmitted to the ion channel gate by ligand-bound LBDs in the context of a full-length receptor. The antagonist and apo distributions are clearly distinct from the full agonist distributions, although there is some overlap in the tails. The width of the distribution is related to how strongly the ligand stabilizes the LBD conformation around its free energy minimum (see Supplementary Table 5 for statistics on the distributions). These widths vary among the ligands, but a strong correlation with ligand type is not apparent. The average values of the distributions for kainate are closer to the averages for the antagonists than to those for the full agonists. This observation is consistent with kainate being a weak partial agonist. The averages of the distributions for 4-AHCP, in contrast, are closer to the averages for the full agonists than to those for the antagonists. The 4-AHCP peaks are shifted to the left relative to the full agonists, indicating a reduced capacity to open the ion channel. Surprisingly, the thio-ATPA distributions almost completely coincide with the distributions for glutamate in all but the A–C distance. For the diagonal A–C pair, thio-ATPA is shifted to the left of the full agonists. The reduced displacement solely in the A–C direction relative to glutamate may explain why thio-ATPA acts as a strong partial agonist rather than as a full agonist. When the crystal structures of LBD–glutamate and LBD–(thio-ATPA) are superimposed onto the intact GluA2 structure, most inter-Lobe 2 distances are smaller for the thio-ATPA complex than for the glutamate complex (see Supplementary Table 5). The present analysis of equilibrium conformational distributions, however, suggests this tempered agonism stems only from reduced displacement along the diagonal A–C direction rather than from several directions. Subunit non-equivalence has also been previously suggested for GluK2 receptors21. Another noteworthy observation is that the B–D distributions (the other diagonal direction) resemble the A–D and B–C distributions with an offset distance of about 35 Å. This similarity suggests that a given ligand induces an equivalent amount of displacement in these three directions.
Figure 5.
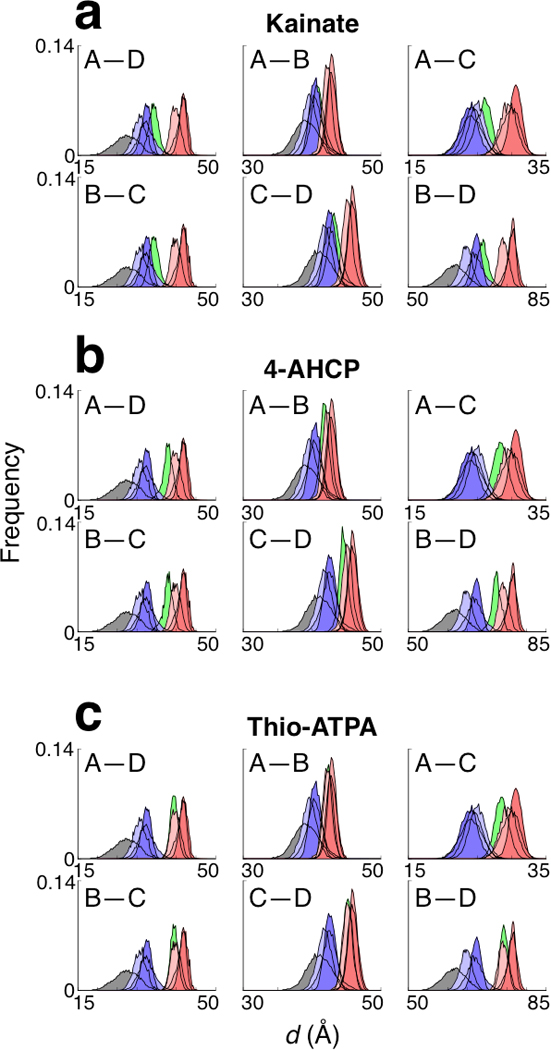
Inter-LBD distance distributions. LBD conformations were superimposed onto the intact GluA2 structure (see Fig. 4), and the pairwise distances were measured between regions in Lobe 2 (see Online Methods). The apo LBD is gray, the LBD–antagonist complexes are blue, and the LBD–full agonist complexes are red. The LBD–partial agonist complexes for (a) kainate, (b) 4-AHCP, and (c) thio-ATPA are green. See Supplementary Table 5 for statistics and the distances measured using the isolated LBD–ligand crystal structures.
DISCUSSION
The analysis presented here provides a first dissection of the energetic components governing the molecular conformations and interactions likely to be key to iGluR function. Topological features in the free energy landscapes governing LBD closure appear to be important for evaluating agonist efficacy. Although the results deduced by transposing the calculated free energy landscapes of isolated LBDs onto the full-length GluA2 receptor are partly speculative, they provide a useful roadmap for the interpretation and design of experimental investigations. These receptors are allosteric proteins in which the effects triggered by ligand-binding are propagated over an appreciable distance through the molecule. Here, a quantitative account of the (hidden) relationship between structure and energy is established for the LBDs using MD free energy simulations. The conformational dynamics of LBD assemblies in complex with different ligands, deduced from the free energy landscapes, builds upon the information provided by crystal structures of LBD–ligand complexes, thus offering a more complete understanding of how the action of full agonists, partial agonists, and antagonists is associated with LBD closure. The present computational framework could be extended to the analysis of other ligand-gated receptors and their activation characteristics.
METHODS
Methods and any associated references are available in the online version of the paper at http://www.nature.com/nsmb/.
Supplementary Material
ACKNOWLEDGMENTS
We thank Eric Gouaux, Vasanthi Jayaraman, Christy Landes, Mark Mayer, Robert Oswald, and Harel Weinstein for review of the manuscript. We thank Wenxun Gan for discussions. This work was supported by grant MCB-0920261 from the National Science Foundation (NSF) and grant GM062342 from the National Institutes of Health (NIH).
Footnotes
Note: Supplementary information is available on the Nature Structural & Molecular Biology website.
AUTHOR CONTRIBUTIONS
A.Y.L. and B.R. designed the research, analyzed the data and wrote the manuscript. A.Y.L. performed the computations.
COMPETING FINANCIAL INTERESTS
The authors declare no competing financial interests.
REFERENCES
- 1.Mayer ML. Glutamate receptors at atomic resolution. Nature. 2006;440:456–462. doi: 10.1038/nature04709. [DOI] [PubMed] [Google Scholar]
- 2.Sobolevsky AI, Rosconi MP, Gouaux E. X-ray structure, symmetry and mechanism of an AMPA-subtype glutamate receptor. Nature. 2009;462:745–756. doi: 10.1038/nature08624. [DOI] [PMC free article] [PubMed] [Google Scholar]
- 3.Armstrong N, Gouaux E. Mechanisms for activation and antagonism of an AMPA-sensitive glutamate receptor: crystal structures of the GluR2 ligand binding core. Neuron. 2000;28:165–181. doi: 10.1016/s0896-6273(00)00094-5. [DOI] [PubMed] [Google Scholar]
- 4.Inanobe A, Furukawa H, Gouaux E. Mechanism of partial agonist action at the NR1 subunit of NMDA receptors. Neuron. 2005;47:71–84. doi: 10.1016/j.neuron.2005.05.022. [DOI] [PubMed] [Google Scholar]
- 5.Frydenvang K, et al. Full domain closure of the ligand-binding core of the ionotropic glutamate receptor iGluR5 induced by the high affinity agonist dysiherbaine and the functional antagonist 8,9-dideoxyneodysiherbaine. J Biol Chem. 2009;284:14219–14229. doi: 10.1074/jbc.M808547200. [DOI] [PMC free article] [PubMed] [Google Scholar]
- 6.Holm MM, Lunn ML, Traynelis SF, Kastrup JS, Egebjerg J. Structural determinants of agonist-specific kinetics at the ionotropic glutamate receptor 2. Proc Natl Acad Sci U S A. 2005;102:12053–12058. doi: 10.1073/pnas.0505522102. [DOI] [PMC free article] [PubMed] [Google Scholar]
- 7.Bjerrum EJ, Biggin PC. Rigid body essential X-ray crystallography: Distinguishing the bend and twist of glutamate receptor ligand binding domains. Proteins. 2008;72:434–446. doi: 10.1002/prot.21941. [DOI] [PubMed] [Google Scholar]
- 8.Birdsey-Benson A, Gill A, Henderson LP, Madden DR. Enhanced efficacy without further cleft closure: reevaluating twist as a source of agonist efficacy in AMPA receptors. J Neurosci. 2010;30:1463–1470. doi: 10.1523/JNEUROSCI.4558-09.2010. [DOI] [PMC free article] [PubMed] [Google Scholar]
- 9.Ahmed AH, et al. Mechanisms of antagonism of the GluR2 AMPA receptor: structure and dynamics of the complex of two willardiine antagonists with the glutamate binding domain. Biochemistry. 2009;48:3894–3903. doi: 10.1021/bi900107m. [DOI] [PMC free article] [PubMed] [Google Scholar]
- 10.Robert A, Armstrong N, Gouaux JE, Howe JR. AMPA receptor binding cleft mutations that alter affinity, efficacy, and recovery from desensitization. J Neurosci. 2005;25:3752–3762. doi: 10.1523/JNEUROSCI.0188-05.2005. [DOI] [PMC free article] [PubMed] [Google Scholar]
- 11.Weston MC, Gertler C, Mayer ML, Rosenmund C. Interdomain interactions in AMPA and kainate receptors regulate affinity for glutamate. J Neurosci. 2006;26:7650–7658. doi: 10.1523/JNEUROSCI.1519-06.2006. [DOI] [PMC free article] [PubMed] [Google Scholar]
- 12.Zhang W, Cho Y, Lolis E, Howe JR. Structural and single-channel results indicate that the rates of ligand binding domain closing and opening directly impact AMPA receptor gating. J Neurosci. 2008;28:932–943. doi: 10.1523/JNEUROSCI.3309-07.2008. [DOI] [PMC free article] [PubMed] [Google Scholar]
- 13.Maltsev AS, Ahmed AH, Fenwick MK, Jane DE, Oswald RE. Mechanism of partial agonism at the GluR2 AMPA receptor: Measurements of lobe orientation in solution. Biochemistry. 2008;47:10600–10610. doi: 10.1021/bi800843c. [DOI] [PMC free article] [PubMed] [Google Scholar]
- 14.Woo HJ, Roux B. Calculation of absolute protein-ligand binding free energy from computer simulations. Proc Natl Acad Sci U S A. 2005;102:6825–6830. doi: 10.1073/pnas.0409005102. [DOI] [PMC free article] [PubMed] [Google Scholar]
- 15.Abele R, Keinänen K, Madden DR. Agonist-induced isomerization in a glutamate receptor ligand-binding domain. J Biol Chem. 2000;275:21355–21363. doi: 10.1074/jbc.M909883199. [DOI] [PubMed] [Google Scholar]
- 16.Cheng Q, Du M, Ramanoudjame G, Jayaraman V. Evolution of glutamate interactions during binding to a glutamate receptor. Nat Chem Biol. 2005;1:329–332. doi: 10.1038/nchembio738. [DOI] [PubMed] [Google Scholar]
- 17.Fenwick MK, Oswald RE. On the mechanisms of alpha-amino-3-hydroxy-5-methylisoxazole-4-propionic acid (AMPA) receptor binding to glutamate and kainate. J Biol Chem. 2010;285:12334–12343. doi: 10.1074/jbc.M109.086371. [DOI] [PMC free article] [PubMed] [Google Scholar]
- 18.Cheng Q, Jayaraman V. Chemistry and conformation of the ligand-binding domain of GluR2 subtype of glutamate receptors. J Biol Chem. 2004;279:26346–26350. doi: 10.1074/jbc.M403111200. [DOI] [PubMed] [Google Scholar]
- 19.Lau AY, Roux B. The free energy landscapes governing conformational changes in a glutamate receptor ligand-binding domain. Structure. 2007;15:1203–1214. doi: 10.1016/j.str.2007.07.015. [DOI] [PMC free article] [PubMed] [Google Scholar]
- 20.Turski L, et al. ZK200775: a phosphonate quinoxalinedione AMPA antagonist for neuroprotection in stroke and trauma. Proc Natl Acad Sci U S A. 1998;95:10960–10965. doi: 10.1073/pnas.95.18.10960. [DOI] [PMC free article] [PubMed] [Google Scholar]
- 21.Das U, Kumar J, Mayer ML, Plested AJR. Domain organization and function in GluK2 subtype kainate receptors. Proc Natl Acad Sci U S A. 2010;107:8463–8468. doi: 10.1073/pnas.1000838107. [DOI] [PMC free article] [PubMed] [Google Scholar]
- 22.Hogner A, et al. Structural basis for AMPA receptor activation and ligand selectivity: crystal structures of five agonist complexes with the GluR2 ligand-binding core. J Mol Biol. 2002;322:93–109. doi: 10.1016/s0022-2836(02)00650-2. [DOI] [PubMed] [Google Scholar]
- 23.Nielsen BB, et al. Exploring the GluR2 ligand-binding core in complex with the bicyclical AMPA analogue (S)-4-AHCP. FEBS J. 2005;272:1639–1648. doi: 10.1111/j.1742-4658.2005.04583.x. [DOI] [PubMed] [Google Scholar]
- 24.Hogner A, et al. Competitive antagonism of AMPA receptors by ligands of different classes: crystal structure of ATPO bound to the GluR2 ligand-binding core, in comparison with DNQX. J Med Chem. 2003;46:214–221. doi: 10.1021/jm020989v. [DOI] [PubMed] [Google Scholar]
- 25.Fiser A, Sali A. ModLoop: automated modeling of loops in protein structures. Bioinformatics. 2003;19:2500–2502. doi: 10.1093/bioinformatics/btg362. [DOI] [PubMed] [Google Scholar]
- 26.Krivov GG, Shapovalov MV, Dunbrack RLJ. Improved prediction of protein side-chain conformations with SCWRL4. Proteins. 2009;77:778–795. doi: 10.1002/prot.22488. [DOI] [PMC free article] [PubMed] [Google Scholar]
- 27.Wang J, Wang W, Kollman PA, Case DA. Automatic atom type and bond type perception in molecular mechanical calculations. J Mol Graph Model. 2006;25:247–260. doi: 10.1016/j.jmgm.2005.12.005. [DOI] [PubMed] [Google Scholar]
- 28.Wang J, Wolf RM, Caldwell JW, Kollman PA, Case DA. Development and testing of a general AMBER force field. J Comput Chem. 2004;25:1157–1174. doi: 10.1002/jcc.20035. [DOI] [PubMed] [Google Scholar]
- 29.MacKerell ADJ, et al. J Phys Chem B. 1998;102:3586–3616. doi: 10.1021/jp973084f. [DOI] [PubMed] [Google Scholar]
- 30.Frisch MJ, et al. Gaussian 03, Revision C.02. 2004. [Google Scholar]
- 31.Brooks BR, et al. CHARMM: the biomolecular simulation program. J Comput Chem. 2009;30:1545–1614. doi: 10.1002/jcc.21287. [DOI] [PMC free article] [PubMed] [Google Scholar]
- 32.Kumar S, Rosenberg JM, Bouzida D, Swendsen RH, Kollman PA. The weighted histogram analysis method for free energy calculations on biomolecules. I. The method. J Comput Chem. 1992;13:1011–1021. [Google Scholar]
- 33.Souaille M, Roux B. Extension to the weighted histogram analysis method: combining umbrella sampling with free energy calculations. Comput Phys Comm. 2001;135:40–57. [Google Scholar]
Associated Data
This section collects any data citations, data availability statements, or supplementary materials included in this article.


