

Summary
Vibrio parahaemolyticus senses surfaces via impeded rotation of its polar flagellum. We have exploited this surface sensing mechanism to trick the organism into thinking it is on a surface when it is growing in liquid. This facilitated studies of global gene expression in a way that avoided many of the complications of surface-to-liquid comparisons, and illuminated ~70 genes that respond to surface sensing per se. Almost all are surface-induced (not repressed) and encode swarming motility proteins, virulence factors, or sensory enzymes involved with chemoreception and c-di-GMP signaling. Follow-up studies were done to place the surface-responsive genes in a regulatory hierarchy. Mapping the hierarchy revealed two surprises about LafK, a transcriptional activator that until now has been considered to be the master regulator for the lateral flagellar system. First, LafK controls a more diverse set of genes than previously appreciated. Second, some laf genes are not under LafK control, which means LafK is not the master regulator after all. Additional experiments motivated by the transcriptome analyses revealed that growth on a surface lowers c-di-GMP levels and enhances cytotoxicity. Thus, we demonstrate that V. parahaemolyticus can invoke a program of gene control upon encountering a surface and the specific identities of the surface-responsive genes are pertinent to colonization and pathogenesis.
Keywords: swarming, surface sensing, transcriptome, virulence, c-di-GMP
Introduction
How do bacteria respond to growth on surfaces? The lifestyle of bacteria growing in liquid clearly seems quite distinct from their life growing biofilms or on surfaces. This has been reflected in comparisons of global gene activity or protein content between planktonic and biofilm bacteria (reviewed in (An and Parsek, 2007) and swimming and swarming bacteria. Swarming is one particular type of adaptation to growth on a surface that results in differentiation to a specialized cell type that is able to move rapidly over surfaces and through viscous environments.
Comparisons of cells grown in liquid and on surfaces have revealed profound differences between swimmers and swarmers. For example, almost 1/3 of the S. enterica serovar Typhimurium transcriptome was observed to be differentially regulated on analyzing a comprehensive time series of liquid- and surface-grown bacteria (Wang et al., 2004). Moreover, a proteomic analysis of S. enterica swimmer and swarmer cells revealed changes in the abundance of more than 130 proteins (Kim and Surette, 2004). In Pseudomonas aeruginosa 417 genes, representing ~7.5% of the genome, showed greater than 2-fold changes in expression comparing swimmers and swarmers (Overhage et al., 2008). Similarly, in Proteus mirabilis 587 genes (~16% of the genome) were differentially expressed >2-fold comparing broth-grown and swarming bacteria (Pearson et al., 2010). In total, these studies present a striking picture of how large the differences between life in liquid and life on a surface can be. They seem important because many of the observed differences have implications for virulence as well as environmental survival strategies.
However, there are many parameters impacting growth in liquid compared to growth on a surface. These include diffusion and availability of oxygen and nutrients and accumulation of toxic byproducts of growth. Concentrations of cell-cell signaling molecules must differ for cells packed in a community compared to cells growing in liquid culture–as must also factors such as cell-cell contact, mobility, and heterogeneity of the population. These considerations make it impossible to discern from the studies cited above which changes in gene expression reflect metabolic influences and which are the result of some intrinsic response to growth on surfaces.
We examine this issue using the marine bacterium and pathogen Vibrio parahaemolyticus. V. parahaemolyticus swarming is robust, occurring on 0.5 to 2.5% agar. The swarmer cells are highly flagellated and can be quite long (Belas et al., 1986). Key for these studies is that surface sensing per se is known to elicit induction of the swarming motility system. The organism possesses two, distinct flagellar systems. The polar system (Fla) is dedicated to swimming, whereas lateral system (Laf) is reserved for swarming (McCarter, 2004). There are no shared structural components. The single, sheathed polar organelle is produced continuously, and hundreds of lateral flagella are produced only during growth on surfaces and in viscous environments (reviewed in (McCarter, 2001, 2004, 2005). Thus, with respect to specificity and fold regulation of gene expression, the laf system of V. parahaemolyticus is an ideal marker of surface adaptation and differentiation: the swimmer makes no lateral flagella, while the swarmer is elongated and makes numerous lateral organelles (illustrated in Fig. 1).
FIGURE 1. Swimmer and swarmer cells and the lateral flagellar system of V. parahaemolyticus.
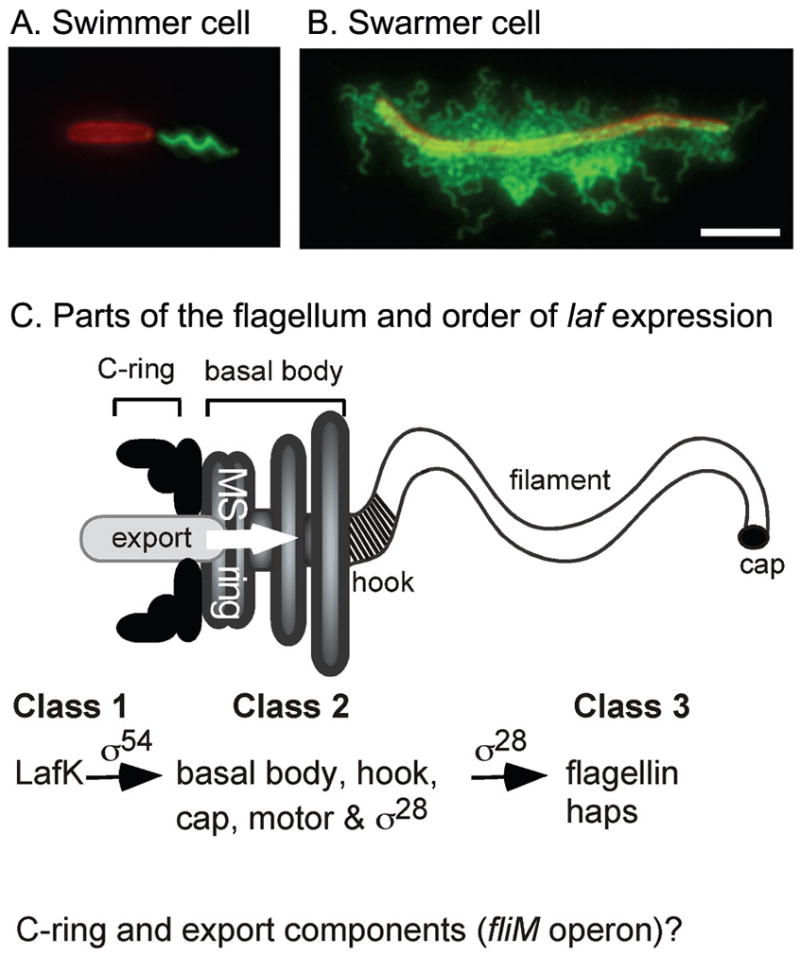
LM5674 (wild type) swimmer cell grown in liquid (A) and swarmer cell grown on a surface (B) are profoundly different. Cells were fixed and examined by immunofluorescence microscopy. Both panels are of the same magnification and the bar indicates 5 μm. Cells were stained with membrane dye FM 4–64 (colored red) and anti-polar flagellin antiserum (A, colored green) or anti-lateral flagellin antiserum (B, colored green). C. Schematic of the flagellar organelle and the hierarchy of lateral flagellar (laf) gene expression. Previous work established that LafK, a σ54-dependent regulator was required for expression of Class 2 genes, which mostly encode the components of the basal body and hook as well as a specialized sigma factor. This sigma (FliA, or σ28) is required for expression of Class 3 genes, which encode the flagellin subunit and the haps, which are the adaptors for joining the propeller to the hook. The placement of the fliM operon, which encodes components of the C-ring and membrane-associated export components, within the regulatory cascade was unknown at the outset of this work.
Surface sensing in V. parahaemolyticus occurs via the polar flagellum: conditions impeding movement of the swimming organelle inform the bacterium of its physical environment. These conditions can include growth on surfaces or in highly viscous liquid media, mutation of the polar flagellar genes, and the sodium channel blocking drug phenamil, which poisons the energy source driving polar (but not lateral) flagellar rotation (Belas et al., 1986; Kawagishi et al., 1996; McCarter et al., 1988). All polar flagellar mutants that have been isolated with defects affecting swimming motility cause expression of lateral flagellar genes in liquid, including mutants that produce no polar flagellar components and mutants that produce a paralyzed polar flagellum (reviewed in McCarter, 2004). Thus, when the organism cannot swim, it induces a new mode of translocation. However, interference with the polar organelle is not sufficient to evoke the swarmer cell program. A second signal is required, which is iron limitation (McCarter and Silverman, 1989). We suspect that imposition of dual requirements for such a costly differentiation event ensures that differentiation to the surface mobile cell type occurs under strictly appropriate conditions, i.e., when the bacterium finds itself in an environment where it cannot move (i.e., swim) and cannot grow well (i.e., partial starvation conditions).
In this work, we define a core set of genes whose expression is specifically responsive to the surface-adapted lifestyle. By using polar flagellar mutants grown in iron-deficient broth and by using iron-poor medium supplemented with the drug that specifically prevents rotation of the polar flagellar motor, we use “pseudosurface” conditions to elicit swarming gene expression in liquid and analyze the global surface-responsive transcriptome in a new way. Coupling the transcriptome studies with a combination of mutant analyses, RTPCR, and reporter gene fusions, allowed us to establish the initial framework for a circuitry diagram of the surface-responsive network of gene control. The genes in this network provide information about general surface colonization strategies. Our data imply that surface sensing in V. parahaemolyticus not only induces the swarming motility system but also invokes new capacities for sensing and responding to environmental cues and for preparing for encounters with a potential host.
Results
Overview of microarray growth conditions
In order to dissect the complex transcriptional differences occurring during growth in liquid and on surfaces, RNA profiles were captured using multiple conditions, wild-type and mutant strains, and by exploiting our understanding of the induction of the laf gene system. All strains were grown in heart infusion medium (HI). Our benchmark swarming strain LM5674 was grown on a surface (S), which was HI medium solidified with 1.5% agar, in liquid (L), which was HI broth with no addition, and in iron-limiting liquid (LD), which was HI broth with the iron chelator 2,2′-dipyridyl. A pseudosurface condition (PS1) was achieved by growing two different polar flagellar mutants in iron-limiting broth. An alternate pseudosurface condition (PS2) was achieved by growing the wild-type strain in iron-limiting broth amended with phenamil, a specific inhibitor of the sodium-driven polar flagellar motor (Yorimitsu and Homma, 2001). The swarming-defective strain LM7789, which has a lesion in the regulatory gene encoding the σ54-dependent transcription factor LafK (Stewart and McCarter, 2003), was also grown on a surface [S(K−)]. Table 1 summarizes the microarray experiments performed for this analysis. Six conditions were used to query the chips; each of these conditions was repeated 2 or more times (as indicated in Table 1) with independently isolated RNA samples for each replicate.
TABLE 1.
Microarray strains, growth conditions and cell length dataa
| Strain description or genotype (Strain number) | Array designation | Description of array condition | number of chips probed b | Average length in μm (SE) | Average percent > 5 μm (SP) |
|---|---|---|---|---|---|
| Wild type (LM5674) | S | Surface | 4 | 6.44 (0.19) | 44 (2) |
| Wild type (LM5674) | L | Liquid | 2 | 3.21 (0.06) | 5 (1) |
| Wild type (LM5674) | LD | Iron-limiting broth (Liquid + iron chelator Dipyridyl) | 3 | 3.11 (0.05) | 4 (1) |
|
flaM::EzKAN (LM5392) motA2::TnphoA (LM4652) |
PS1 | Pseudosurface 1: Polar flagellar mutants grown in iron-limiting broth | 2 | 3.99 (0.33) | 14 (2) |
| Wild type (LM5674) | PS2 | Pseudosurface 2: Wild type grown in iron- limiting broth with polar flagellar motor inhibitor phenamil | 2 | 4.66 (0.08) | 19 (2) |
| ΔlafK (LM7789) | S(K−) | Swarm-defective lafK regulatory mutant grown on a surface | 2 | 3.72 (0.08) | 15 (1) |
Cell length data was calculated by scoring at least 100 cells per sample at time of harvest for each RNA preparation and averaging the samples. The number of cells longer than 5 μm was also calculated and expressed as a percentage of the total. Standard errors of the mean (SE) or standard errors of the average (SP) are given in parentheses.
Number of chips probed is also equal to number of independent RNA preparation.
Establishing surface growth conditions for RNA harvesting
Luminous reporter strains with fusions in lateral flagellar genes (laf::lux fusions) have been used to study laf gene expression (Stewart and McCarter, 2003), and such a strain was used as the guide to establish the timing for the microarray experiments. In a typical experiment, the laf::lux reporter strain was spread on plates and harvested periodically during growth for OD600nm and luminescence measurements (Figure 2A). Strong induction of laf gene expression was detected at 6 h, i.e., luminescence increased from a baseline of ~20 to ~20,000 SLU (light units normalized to OD600nm). This time was selected as the appropriate point for capturing the swarming RNA profile. It coincided with the maximal numbers of long cells and maximal average cell length for the wild-type strain (Table 1). The amount of lateral flagellin (Laf), the structural subunit for the lateral flagellar propeller, produced by the surface-grown wild type (S) harvested at the 6 h time point is shown in the immunoblot in Figure 2D. The lafK regulatory mutant strain LM7789, which cannot swarm, was grown and harvested similarly for the RNA purification. The flagellin profile for this mutant grown on a surface and harvested at the 6 h time point [S(K−)] is also shown in Figure 2D: it does not synthesize lateral flagella, although it does produce polar flagellin (Fla).
FIGURE 2. Conditions inducing the swarmer cell program.

The luminescent reporter strain LM5738 carrying a lux fusion in the laf hook operon was used as a guide for establishing the microarray growth conditions. A. Luminescence and growth of laf::lux reporter strain LM5738 during growth on a surface. Cells were spread on plates and harvested periodically. Luminescence is reported as specific light units (SLU), which are total light units per min per ml per OD600nm. B. Growth of the laf::lux reporter strain during growth in liquid (L), liquid dipyridyl (LD, iron-limiting broth), and liquid dipyridyl phenamil (PS2, pseudosurface 2). C. Luminescence of the laf::lux reporter strain during growth in L, LD, and PS2. D. Immunoblot of samples harvested for microarray analyses. Samples: wild type LM5674 grown in liquid (L) and on a surface (S), the lafK regulatory mutant LM7789 grown on a surface [S(K−)], the wild type grown in iron-limiting broth (LD) and grown in iron-limiting broth and phenamil (PS2), and the polar flagellar mutant LM5392 grown in iron-limiting broth (PS1). This polar flagellar mutant makes no polar flagellins. The immunoblot was probed with antisera directed against the lateral flagellin subunit (Laf) and the constitutively produced polar flagellins (Fla).
Establishing pseudosurface growth conditions for RNA harvesting
Lateral flagellar gene expression was induced in liquid by using “pseudosurface” conditions, achieved by impairing polar flagellar function—either by using mutant strains with structural defects in the polar flagellum (PS1) or by using the sodium channel blocking drug phenamil to inhibit rotation of the sodium-driven, polar flagellum (PS2) (Kawagishi et al., 1996; McCarter et al., 1988). Figure 2C shows a typical profile of laf induction in liquid medium containing phenamil supplemented with the highest concentration of the iron chelator sufficient to induce laf::lux gene expression without having a significant deleterious impact on growth rate (Figure 2B). The data also demonstrate that iron restriction per se does not induce laf::lux expression. RNA was prepared from wild-type cultures grown similarly and harvested at the 200 min time point, which corresponded to the peak of laf::lux expression. The amount of lateral flagellin produced by the wild-type strain at the time of harvest is shown in Figure 2D: lateral flagella are produced only in the pseudosurface condition (PS2 = LD plus phenamil) and not in liquid (L) or liquid plus dipyridyl (LD).
The alternative pseudosurface condition (PS1) was achieved by using polar flagellar mutant strains grown in iron-limiting broth. The transcriptional profiles of two polar flagellar mutant strains were examined in order to avoid potential allele-specific effects on the surface sensing response. [Although it turned out that there were no appreciable differences in transcription profiles between the 2 strains.] LM5392 (flaM1) contains a defect in a polar flagellar regulatory gene; it cannot swim and fails to synthesize the polar flagellum (Fla−). LM4262 (motX1699) contains a defect in a polar flagellar motor gene; it is also completely unable to swim but produces a paralyzed polar flagellum. The amount of lateral flagellin produced by the Fla− strain LM5392 grown in LD and harvested for the microarray RNA sample is shown in Figure 2D (PS1).
Cell length data (Table 1) generally conformed to the gene expression and flagellin measurements. For example, approximately 14% of the PS1 cells and 19% of the PS2 cells were greater than 5 μm in length compared to 4–5% of the L or LD population. Although neither pseudosurface condition induced elongation as effectively as growth on a surface (~46% long), we believe this is partly a consequence of not fully limiting for iron (a compromise adopted in order to match growth optimally) because increasing dipyridyl conditions resulted in higher fold induction of laf::lux reporters and greater cell elongation (data not shown). However, iron is not the only relevant factor promoting elongation as the swarming-defective lafK mutant failed to elongate as effectively as the wild-type strain when grown on a surface (~15% vs 46% long, respectively).
Defining the LafK regulon
To begin to analyze global gene expression during growth on a surface, we examined the LafK regulon. The comparison of RNA profiles between surface-grown lafK+ and lafK− strains was predicted to display differences in known laf genes and permit a validation test for our newly developed microarrays, both with respect to chip design and assessment of the method to capture swarmer cells. Prior studies identified 38 laf genes and established a transcriptional hierarchy of gene control by using reporter transposon (Tn5lux) mutagenesis (Stewart and McCarter, 2003). This cascade of gene control is summarized in Fig. 1C. LafK was found to be a key σ54-dependent transcriptional regulator, directing the expression of Class 2 operons encoding many of the components of the hook/basal body structure of the flagellum as well as a gene encoding a specialized σ factor FliAL (σ28) that is in turn required to direct transcription of Class 3 laf genes, including lafA (VPA1548), the structural gene encoding the flagellin subunits that comprise the flagellar propeller. In the 2003 study, one flagellar operon, VPA1540–46 encoding C-ring components (FliM and FliN) and cytoplasmic membrane export components (FliP, FliQ, FliR, FlhA, and FlhB), was not placed in the hierarchy because no lux fusions were isolated in this operon. LafK is homologous to the polar flagellar regulator FlaK, which is orthologous to the master polar flagellar regulators in other members of the Vibrionaceae as well as Pseudomonas species, e.g., FlrA in Vibrio cholerae and Vibrio fischeri and FleQ in P. aeruginosa (Kim and McCarter, 2004; McCarter, 2001).
The microarray analysis showed decreased transcription of 44 genes (>4-fold, p value < 0.05) in the lafK strain compared to the wild type (Table 2 and Table S1). No genes appeared to be negatively regulated by LafK (using the 4-fold cutoff). Many (68%) but not all of the genes identified by this comparison were the previously defined laf genes. Moreover, the observed fold differences in gene expression between the two strains were large, e.g., the change in transcription between lafK+ vs lafK− strains for lafA (VPA1548) was 984-fold. Thus, the data not only reveal that we have developed growth conditions to successfully capture the transcriptome of the swarmer cell, but also that this system has the capacity to report a robust dynamic range of gene expression.
TABLE 2.
The LafK regulona
| Geneb | Description of predicted product | Fold change | ||
|---|---|---|---|---|
| S vs S(K−) | S vs L | S vs LD | ||
| <VP0649>c | hypothetical, 401 aa | 5 | 7 | 4 |
| VP0763 | conserved hypothetical protein; 39 aa | 40 | 39 | 48 |
| VP1293-94 | small RNA (~400 nucleotides) | 80 | 54 | 54 |
| <VP1682> | type III secretion protein | 4 | 4 | 3 |
| <VP1701> | type III secretion regulator; ExsC | 5 | 6 | 4 |
| <VPA0227> | alkaline serine protease | 7 | 20 | 10 |
| VPA0260 | FlgO, lytic transglycosylase | 7 | 9 | 12 |
| VPA0261 | FlgN, chaperone | 25 | 169 | 124 |
| VPA0262 | FlgM, anti sigma factor | 15 | 52 | 52 |
| VPA0264 | FlgB, proximal rod | 735 | 493 | 485 |
| VPA0265 | FlgC, proximal rod | 269 | 249 | 345 |
| VPA0266 | FlgD, hook assembly | 302 | 292 | 312 |
| VPA0267 | FlgE, hook | 239 | 256 | 299 |
| VPA0268 | FlgF, proximal rod | 281 | 169 | 261 |
| VPA0269 | FlgG, distal rod | 216 | 213 | 250 |
| VPA0270 | FlgH, L ring | 45 | 56 | 54 |
| VPA0271 | FlgI, P ring | 66 | 70 | 70 |
| VPA0272 | FlgJ, peptidoglycan hydrolase | 54 | 64 | 69 |
| VPA0273 | FlgK, hook-associated protein 1 | 296 | 235 | 215 |
| VPA0274 | FlgL, hook-associated protein 2 | 119 | 318 | 291 |
| VPA0275 | FlgU, unknown but required for swarming | 13 | 70 | 52 |
| VPA1294 | SPOR-domain containing protein involved with peptidoglycan binding | 174 | 134 | 150 |
| VPA1295 | hypothetical protein | 312 | 242 | 317 |
| VPA1492 | methyl-accepting chemotaxis protein | 13 | 22 | 18 |
| VPA1532 | FliJ, flagellar export | 14 | 12 | 16 |
| VPA1533 | FliI, flagellum-specific ATP synthase | 75 | 72 | 79 |
| VPA1534 | FliH, flagellar assembly protein | 63 | 77 | 82 |
| VPA1535 | FliG, motor switch protein | 78 | 59 | 83 |
| VPA1536 | FliF, MS ring | 253 | 196 | 265 |
| VPA1537 | FliE, hook-rod junction | 159 | 111 | 152 |
| VPA1538 | LafK, σ54-dependent regulator | 54 | 90 | 88 |
| VPA1539 | MotY, H+ motor component | 17 | 164 | 136 |
| VPA1548 | LafA, lateral flagellin | 984 | 641 | 584 |
| VPA1550 | FliD, distal cap | 276 | 292 | 276 |
| VPA1551 | FliS, chaperone | 374 | 264 | 450 |
| VPA1552 | FliT, chaperone | 519 | 269 | 350 |
| VPA1553 | FliK, hook-length control | 366 | 359 | 429 |
| VPA1554 | FliL, flagellar protein | 342 | 315 | 371 |
| VPA1555 | FliA, lateral specific sigma 28 | 219 | 354 | 288 |
| VPA1556 | MotA, H+ motor component | 140 | 166 | 161 |
| VPA1557 | MotB, H+ motor component | 219 | 187 | 184 |
| VPA1558 | FliU, new potential lateral product | 24 | 23 | 21 |
| VPA1649 | Metalloendoprotease, LytM (M23family) | 45 | 188 | 201 |
| NT01A1551e | CcmA-domain containing protein | 20 | 35 | 36 |
Genes differentially expressed (>4-fold and p < 0.05) comparing wild-type swarming strain LM5674 and the lafK mutant strain grown on a plate. For all of the genes above, except those noted by brackets, the false discovery rate for each of the three comparisons is below 1%. Complete data, with p and q values are given in supplementary Table 1.
Boxed genes indicate potential operons and bold indicates the first gene in the operon.
< > Bracketed genes indicate those that have higher false discovery rates (>1%) and are therefore classified as “Tier 2” genes. VP0260 also had a high false discovery rate, but we suspect this is because it is the last gene in an operon.
NT01VPA1551 was annotated by TIGR after the original annotation was performed.
Three new potential laf genes were revealed by the transcriptome comparison. These genes were not annotated as flagellar genes; however they each occur as the distal gene in a laf operon confirmed by RTPCR (data not shown). Transposon mutants were isolated with insertions in VPA0275 (encoding a hypothetical protein) and VPA0260 (encoding a periplasmic lytic transglycosylase; pfam01464; E-value= 5.9e–29). They have severe swarming defects, comparable to a mutant with a lesion in the hook gene (Figure 3A). The phenotype of a mutant with a lesion in VPA1558 (also encoding a hypothetical) is not yet known. LafK regulated one other new, motility-related gene, VPA1492, encoding a predicted, methyl accepting chemotaxis protein (Mcp, 13-fold), and its mutant phenotype also is not known (NB: V. parahaemolyticus possesses 29 genes encoding Mcps).
FIGURE 3. Phenotypes and reporter gene expression in strains with mutations in the surface-responsive program.

A. Swarming phenotypes of strains: LM5431 (wild-type swarming strain), LM5738 (flgBL::Tn5lux), LM9889 (vpa0260::Tn5), LM9890 (vpa0275::Tn5), LM6159 (vpa1598::Tn5lux), LM6161 (vp1002::Tn5lux), LM9376 (vpa0227::Tn5lux), and LM5093 (wild-type swarming strain). Strains were inoculated on HI swarm agar and incubated for 12 h at room temperature. B. Luminescence of strain LM9376 carrying the vpa0227::lux reporter in the gene encoding the alkaline serine protease and its congenic derivative LM9620, which has a ΔlafK mutation. Strains were grown as per the microarray conditions and harvested periodically for OD600nm and luminescence measurements. C. Luminescence of strains with reporter lux fusions in surface-regulated genes (VPA0227, VP1002, and VPA1598). The control strain LM8858 contains a fusion in a constitutively expressed gene (VP0575). Strains were grown as per the microarray conditions and harvested periodically for light measurements. Maximum achieved luminescence is reported as normalized specific light units (SLU). Error bars represent standard deviation of triplicate measurements. Each experiment has been repeated at least three times with similar result.
The scope of LafK regulation extends beyond flagellar genes
Microarray comparisons of lafK+ and lafK− strains led to the unexpected discovery that LafK regulates several genes that are not likely to be directly involved in assembly or function of the lateral flagella. Some of these genes showed very high fold changes in gene expression. For example, VPA1295 and VPA1294, which form a potential operon, showed >170-fold expression differences. VPA1295 encodes a small hypothetical protein (90 aa) with a predicted signal peptide. VPA1294 encodes a predicted 134 aa protein containing a SPOR domain (pfam05036; E-value= 2.2e–12). SPOR domains seem involved in peptidoglycan binding and have been found in proteins affecting sporulation and cell division. Other highly regulated genes include VP0763 (40-fold), encoding a very small predicted protein (39 aa), and an intergenic region between VP1293–1294 (80-fold), which appears to encode a small RNA whose size is at least 420 bp, the size of a product detected by RTPCR. Another potential operon showing LafK-dependence included VPA1649 and NTO1VPA1551 (>20-fold). The deduced protein VPA1649 is a predicted metalloendoprotease; the downstream and overlapping coding region, NTO1VPA1551, encodes a predicted product (147 aa) containing the CcmA conserved domain, which is involved in cell shape determination (COG1664; E-value=7e–17).
To explore the regulation of some of these genes, new RNA preparations were isolated from the wild type grown in liquid and the following surface-grown strains: wild type, lafK, and fliAL. Figure 4 shows the products of RTPCR reactions that were designed to amplify the new potential LafK-dependent target mRNAs, specifically those encoding the small RNA, the SPOR protein, the metalloendoprotease, and the Mcp. Primers for the polar flagellar fliAP, whose expression is constitutive, were used to produce the normalization control in each reaction. Each of the queried genes showed LafK-dependence, i.e., a product was found in the wild-type sample whereas little or no product was observed for the lafK mutant RNA (and in liquid-grown wild type). Furthermore, these genes were not (or poorly) transcribed in a strain with a defect in fliAL. We examined nucleotide sequences upstream of the newly identified members of the LafK regulon for potential σ28-dependent promoters using a consensus sequence derived previously on the basis of primer extension (Stewart and McCarter, 2003). In agreement with the RTPCR results, potential signature σ28-dependent promoter sequences could be detected for these LafK/σ28-dependent genes (Table S2). A signature promoter was also found for VP0763, which showed 40-fold LafK-dependent regulation by the microarray analysis, but was not examined by RTPCR. Thus, the transcription of these genes can be placed within Class 3 of the laf hierarchy of gene control, as they required both LafK and the laf-specific sigma factor for transcription. The RTPCR profile of the Class 2 gene (LafK-dependent but σ28-independent) fliDL, encoding the flagellar capping protein, is shown for comparison (Figure 4).
FIGURE 4. RTPCR analyzing surface-responsive gene expression.

RNA was prepared from the following wild-type and mutant strains grown in liquid (L) or on plates (S) and harvested according to the microarray conditions: LM5674 (WT), LM7789 (lafK mutant), and LM6210 (σ28 defective mutant). In each RTPCR reaction primers were included to amplify the target gene and a constitutively expressed control gene (designated with *), which was the polar flagellar σ28 (VP2232). Patterns of gene expression are divided into three classes as indicated. The genes examined (and gene product): VPA1538 (LafK), VPA1540 (FliM), VPA0459 (Collagenase), VPA1598 (GlcNAc binding protein), VP2370 (hypothetical), VP1482 (c-di-GMP signaling), VPA1550 (FliD), VPA1548 (LafA), VPA1492 (Mcp), VP1293-94 (small RNA), VPA1294 (SPOR protein), and VPA1649 (Metalloprotease). Primers and sizes of products are given in Table S5. [Note: there is no RTPCR product for lafK mRNA in the lafK strain because it is a deletion mutant.] The RTPCR reaction products are shown organized in the hierarchical classes of gene control determined in part by these analyses.
Four additional genes showed ~5-fold differential expression: they encode type three secretion proteins (VP1682, VP1701), a hypothetical protein (VP0649), and an alkaline serine protease (VPA0227). We note that the evidence for their differential expression is suggestive, but weak in light of genomewide testing, as their false discovery rates (Table S1) are higher than the other genes included in Table 2. LafK-dependence for vpa0227 was examined directly by introducing a lafK deletion into a strain carrying a luminescence reporter in VPA0227. Luminescence was greatly reduced in strain LM9620 (vpa0227::lux ΔlafK) compared to LM9376 (vpa0227::lux) throughout a timecourse of growth on plates (Figure 3B). Strain LM9376 showed no defect in swarming (Figure 3A).
LafK is not at the apex of the lateral flagellar hierarchy of gene transcription—nor is the fliML operon
The transcriptome comparisons displayed LafK-dependence for transcription of all known laf genes except for the fliML operon (VPA1540–46, fliMNPQflhABL). Thus while homologous to the master regulators of many flagellar systems (Kim and McCarter, 2004; McCarter, 2001), LafK is not a master lateral regulator in the sense that it is not required for all laf gene expression. Although the result was surprising, it was consistent with prior primer extension mapping of the start site of VPA1540 (fliML) transcription, which failed to illuminate a predicted σ54-dependent promoter for fliML. Transcriptional fusions in lafK and flgCL (a gene in the basal body/hook operon) were used to examine the relationship between the fliML operon and the flagellar hierarchy. Reporter plasmids were moved into the wild type or a host of mutant strains, including lafK, rpoN, and 2 mutants with defects in the fliML operon (flhAL or fliQL mutations). [All of these mutants have similarly severe defects in swarming motility (Stewart and McCarter, 2003).] These strains were grown on plates and harvested periodically for β-galactosidase measurements. Activity is reported as the maximal activity during growth and is normalized to the wild-type strain. Unlike lafK and rpoN mutants, which failed to express flgC::lacZ, the fliQ and flhA mutants modulated but did not abrogate flgC::lacZ expression, reducing activity to ~30 to 50% of the wild type level (Figure 5B). The fliM operon mutations also had only small effects on lafK::lacZ expression, reducing the β-galactosidase level ~65 to 80% of the wild-type level (Figure 5A). In addition, the data demonstrate that feedback regulation occurs to modulate lafK expression because lafK and rpoN mutants showed lower lafK::lacZ activity than the wild type; therefore, the lafK operon belongs to both Class 1 and Class 2 (in Figure 1). Mutational interference within the fliML operon does not create a full functional block—or checkpoint—in the hierarchy of gene expression to preclude expression of lafK and downstream genes. These results (and data presented in Figure 4 and Table 3) suggest that the fliML operon, like the lafK operon, belongs to Class 1. Together these two operons encode the core components of the flagellar export apparatus.
FIGURE 5. Probing the lateral hierarchy of expression by using mutants and reporter fusions.

The wild-type and indicated lateral flagellar mutant strains carried reporter plasmids with lafK::lacZ or flgCL::lacZ fusions. Strains were grown on plates and harvested periodically to measure β-galactosidase. The wild-type strain carrying each reporter was also grown as indicated in liquid (L). Activity is reported as maximal activity during growth (which occurred at ~ 10 h on plates) and is normalized to the percentage of maximal reporter activity in the wild-type strain, which was ~1500 Miller units for lafK and ~300 Miller units for flgC. These experiments were replicated at least three times with similar result and error bars are the standard deviation of triplicate assays in a single representative experiment. For all comparisons, the LacZ activity in the mutant strains was significantly different from the activity in the wild type strain (p values <0.004).
Table 3.
Surface-induced genes
| Gene | Description | Positive fold change | |||||
|---|---|---|---|---|---|---|---|
| S vs L | S vs LD | PS1 vs L | PS1 vs LD | PS2 vs L | PS2 vs LD | ||
| Up-regulated core set, common to all comparisonsa | |||||||
| VP0763 | conserved hypothetical protein; 39 aa | 39 | 48 | 12 | 15 | 11 | 14 |
| VP1002 | hypothetical protein, 906 aa | 39 | 29 | 5 | 4 | 10 | 8 |
| VP1293-VP1294 | Intergenic region | 54 | 54 | 13 | 13 | 9 | 9 |
| VP1682 | type III secretion protein | 4 | 4 | 5 | 3 | 4 | 3 |
| VP1698 | type III secretion protein | 3 | 2 | 3 | 2 | 3 | 2 |
| VP1701b | type III secretion regulator; ExsC | 6 | 4 | 5 | 4 | 5 | 4 |
| VP1702 | type III secretion protein, ExsE | 5 | 5 | 5 | 3 | 4 | 3 |
| VP2370 | hypothetical protein, 151 aa | 6 | 5 | 6 | 5 | 16 | 14 |
| VPA0260 | FlgO, lytic transglycosylase | 9 | 12 | 4 | 6 | 4 | 6 |
| VPA0261 | FlgN, chaperone | 169 | 124 | 111 | 81 | 89 | 65 |
| VPA0262 | FlgM, anti sigma factor | 52 | 52 | 56 | 56 | 42 | 42 |
| VPA0264 | FlgB, proximal rod | 493 | 485 | 167 | 164 | 279 | 274 |
| VPA0265 | FlgC, proximal rod | 249 | 345 | 64 | 89 | 116 | 161 |
| VPA0266 | FlgD, hook assembly | 292 | 312 | 101 | 108 | 186 | 199 |
| VPA0267 | FlgE, hook | 256 | 299 | 94 | 110 | 186 | 217 |
| VPA0268 | FlgF, proximal rod | 169 | 261 | 51 | 79 | 146 | 225 |
| VPA0269 | FlgG, distal rod | 213 | 250 | 60 | 71 | 174 | 204 |
| VPA0270 | FlgH, Lring | 56 | 54 | 8 | 7 | 28 | 27 |
| VPA0271 | FlgI, P ring | 70 | 70 | 16 | 16 | 40 | 40 |
| VPA0272 | FlgJ, peptidoglycan hydrolase | 64 | 69 | 17 | 18 | 37 | 40 |
| VPA0273 | FlgK, hook-associated protein 1 | 235 | 215 | 70 | 64 | 92 | 85 |
| VPA0274 | FlgL, hook-associated protein 2 | 318 | 291 | 144 | 132 | 220 | 201 |
| VPA0275 | FlgU, unkown but required for swarming | 70 | 52 | 30 | 22 | 58 | 43 |
| <VPA0227>c | alkaline serine protease | 20 | 10 | 3 *d | 1 * | 10 | 5 |
| VPA0418 | conserved hypothetical protein | 4 | 3 | 4 | 3 | 8 | 6 |
| VPA0419-20 | Intergenic region | 3 | 3 | 3 | 2 | 5 | 4 |
| <VPA0459> | collagenase | 127 | 127 | 2* | 2 | 10 | 13 |
| VPA0867 | DnaJ-related protein | 2 | 2 | 2 | 2 | 3 | 3 |
| VPA1294 | SPOR-domain containing protein | 134 | 150 | 20 | 22 | 12 | 14 |
| VPA1295 | hypothetical protein, 257 aa | 242 | 317 | 46 | 61 | 32 | 42 |
| <VPA1492> | methyl-accepting chemotaxis protein | 22 | 18 | 2 | 2 * | 2 | 2 * |
| <VPA1511> | ScrC (GGDEF protein) | 2 | 3 | 2 * | 2 | 2 * | 2 |
| VPA1512 | ScrB (extracellular solute binding protein) | 8 | 5 | 8 | 5 | 7 | 5 |
| VPA1513 | ScrA (aminotransferase) | 5 | 4 | 6 | 5 | 6 | 5 |
| VPA1532 | FliJ, flagellar export | 12 | 16 | 4 | 5 | 8 | 10 |
| VPA1533 | FliI, flagellum-specific ATP synthase | 72 | 79 | 21 | 23 | 34 | 37 |
| VPA1534 | FliH, flagellar assembly protein | 77 | 82 | 30 | 32 | 60 | 64 |
| VPA1535 | FliG, motor switch protein | 59 | 83 | 23 | 33 | 39 | 56 |
| VPA1536 | FliF, MS ring | 196 | 265 | 80 | 108 | 91 | 123 |
| VPA1537 | FliE, hook-rod junction | 111 | 152 | 84 | 115 | 117 | 161 |
| VPA1538 | LafK, σ54-dependent regulator | 90 | 88 | 47 | 46 | 80 | 78 |
| VPA1539 | MotY (H+ motor component) | 164 | 136 | 70 | 58 | 77 | 63 |
| VPA1540 | FliM, C-ring switch | 286 | 238 | 100 | 83 | 143 | 119 |
| VPA1541 | FliN, C-ring switch | 108 | 143 | 31 | 41 | 42 | 56 |
| VPA1542 | FliP, export/assembly apparatus | 47 | 33 | 7 | 5 | 15 | 11 |
| VPA1543 | FliQ, export/assembly apparatus | 73 | 88 | 11 | 13 | 16 | 19 |
| VPA1544 | FliR, export/assembly apparatus | 15 | 16 | 3 | 3 | 5 | 5 |
| VPA1545 | FlhB, export/assembly apparatus | 17 | 15 | 3 | 3 | 6 | 5 |
| VPA1546 | FlhA, export/assembly apparatus | 17 | 21 | 3 | 4 | 5 | 7 |
| VPA1548 | lateral flagellin LafA | 641 | 584 | 346 | 316 | 398 | 363 |
| VPA1550 | FliD, distal cap | 292 | 276 | 120 | 114 | 145 | 137 |
| VPA1551 | FliS, chaperone | 264 | 450 | 110 | 188 | 166 | 283 |
| VPA1552 | FliT, chaperone | 269 | 350 | 124 | 162 | 183 | 238 |
| VPA1553 | FliK, hook-length control | 359 | 429 | 118 | 141 | 220 | 263 |
| VPA1554 | FliL | 315 | 371 | 141 | 167 | 210 | 248 |
| VPA1555 | FliA, lateral specific s28 | 354 | 288 | 104 | 85 | 204 | 166 |
| VPA1556 | MotA (H+ motor component) | 166 | 161 | 50 | 48 | 75 | 72 |
| VPA1557 | MotB (H+ motor component) | 187 | 184 | 56 | 55 | 54 | 53 |
| VPA1558 | FliU, new potential lateral gene product | 23 | 21 | 5 | 5 | 7 | 6 |
| VPA1598 | Chitin-binding protein (N-acetyl glucosamine binding) | 111 | 163 | 22 | 32 | 18 | 26 |
| VPA1624 | conserved hypothetical protein | 4 | 4 | 2 | 2 | 3 | 3 |
| VPA1649 | Metalloendoprotease, LytM (M23 family) | 188 | 201 | 46 | 49 | 73 | 78 |
| NT01VPA1551 | CcmA-domain containing protein, 147 aa | 35 | 36 | 19 | 19 | 25 | 25 |
| Up-regulated Tier 2 genes d | |||||||
| VP0004 | ribonuclease P protein component | 3 | 7 | 1 * | 2 | 3 | 6 |
| VP0296 | adenylylsulfate kinase | 7 | 4 | 4 | 2 * | 50 | 25 |
| VP0375 | putative lipoprotein | 3 | 6 | 1 * | 3 | 2 * | 5 |
| VP0649 | conserved hypothetical protein | 7 | 4 | 4 * | 3* | 7 | 5 |
| VP1666 | type III secretion protein | 2 | 2 * | 3 | 3 | 4 | 3 |
| VP1680 | type III secretion protein | 3 | 2 * | 6 | 4 | 4 | 3 * |
| VP1692 | type III secretion protein | 2 | 2* | 3 | 2 | 3 | 2 |
| VP1696 | type III secretion protein | 3 | 2 | 3 | 2 | 2 | 2 * |
| VP1697 | type III secretion protein | 4 | 3 | 2 | 2 * | 2 | 2 * |
| VP2338 | chitinase sulfite reductase (NADPH) flavoprotein alpha- | 10 | 12 | 3 * | 3 | 27 | 32 |
| VP2722 | component | 33 | 18 | 4 | 2 * | 76 | 42 |
| VPA0288 | leukocidin | 88 | 38 | 3 | 1 * | 10 | 4 |
| VPA1509 | threonine 3-dehydrogenase | 6 | 6 | 5 | 4 | 13 | 11 |
| VPA1510f | 2-amino-3-ketobutyrate coenzyme A ligase | 8 | 5 | 11 | 7 | 18 | 11 |
Core induced genes were regulated in all surface to liquid comparisons (by >2-fold and with p value <0.05).
Boxed genes are in potential operons and bold indicates most promoter proximal gene.
< > bracketed genes indicate surface-induced Tier 2 genes (induced in at least 4/6 comparisons) that have been confirmed in another way, i.e., being regulated by LafK (VPA0227 and VPA1492), by having surface-induced enzymatic activity (VPA0459) or lux reporter fusion activity (VPA0227), or by being in an operon with other core induced genes (VPA1511).
indicates failure to meet criteria: either low fold or high p value.
Tier 2 genes were derived as being in common between all [S vs L, PS1 vs L, PS2 vs L] or [S vs LD, PS1 vs LD, PS2 vs LD] comparisons and induced at least 2-fold (with p value <0.05) by at least 4/6 of all surface to liquid comparisons.
This operon has been placed in Tier 2. Although it meets the statistical requirements for differential expression, independent confirmation of its regulation has not been obtained. A kbl::lux reporter fusion strain showed slight fold differences in regulation in S vs L that were not consistent throughout growth (data not shown).
Growth on surfaces versus growth in liquid
To capture the full spectrum of differences in gene expression between swimming and swarming cells, we compared the profiles obtained for exponentially growing swimming and swarming cells, i.e., cells grown in liquid (L) and on an agar surface (S). This comparison produced 338 genes whose expression was increased and 361 genes whose expression was decreased by growth on surfaces (>2-fold and p value <0.05). This represents ~13.5% of the genome. Of these, 235 were regulated >4-fold (145 up and 90 down, listed in Table S3). Among the induced genes were all members of the LafK regulon (in Table 2). The fold inductions observed in the S vs L comparison were generally comparable to the fold regulation found in the lafK+ vs lafK− comparison, and these values are also given for comparison in Table 2. For example, VPA1548 (encoding the flagellin subunit) was induced 641-fold when grown on a surface compared to liquid, similar to the 984-fold induction observed for the lafK+ vs lafK− comparison. Moreover, the entire fliML operon, which was not regulated by LafK, was induced in the S vs L comparison; e.g., fliML (VPA1540), the first gene in this operon, showed 286-fold induction upon growth on a surface. Data for all of the genes in this operon are reported in Table 3. The RTPCR verification for the expression profile of fliML is shown in Figure 4: very little mRNA was detected for the wild type grown in liquid compared to the amount of mRNA produced for all surface-grown samples (wild type, lafK, fliALstrains).
Pseudosurface and surface comparisons allow the construction of a core set of surface-responsive genes
Comparison of growth in liquid and pseudosurface conditions eliminated many of the physiological variables occurring between L and S environments, and permitted elucidation of the gene expression changes unique to surface sensing, i.e., the polar flagellum-mediated adaptation to the surface. The degrees of laf expression induced by the PS conditions compared to the L condition were similar (generally within 3-fold) although not quite fully achieving the degree of laf induction observed in cells grown on plates (S). For example, the flagellin gene VPA1548 was induced 346-fold by the PS1 condition and 398-fold by the PS2 condition, compared to 641-fold for surface-grown conditions (Table 3).
Six surface to liquid comparisons (i.e., S vs L, S vs LD, PS1 vs L, PS1 vs LD, PS2 vs L, and PS2 vs LD) were made as well as the iron-limiting liquid vs liquid control comparison (LD vs L). The fold cut-off for these comparisons was 2-fold and the p values were < 0.05. We then identified a core set of surface-regulated genes that behaved similarly in these comparisons (61 induced and 5 repressed genes). The core genes and their fold regulation are listed in Table 3 and 4, induced and repressed, respectively. [Venn diagrams are provided for an overview of the commonly regulated genes in Figure S1.] The core genes include but are not limited to swarming motility genes (and their identities are described below). Many of these genes showed very large changes in expression upon growth on a surface compared to liquid (S vs L). Moreover, there was coherence in the gene sets, i.e., for the most part if a gene was part of an operon, all of the genes in that operon showed a similar pattern of regulation. Figure 6 plots the representative expression profiles in a way that reveals the relative abundance of message and the magnitude fold change in expression. Three general profiles of gene expression were observed: LafK-dependent-surface induced, LafK-independent surface-induced, and LafK-independent surface-repressed.
Table 4.
Surface-repressed genes
| Gene | Description | Negative fold change | |||||
|---|---|---|---|---|---|---|---|
| S vs L | S vs LD | PS1 vs L | PS1 vs LD | PS2 vs L | PS2 vs LD | ||
|
Down-regulated core set, common to all comparisonsa | |||||||
| VP1482b | response regulator receiver | 12 | 12 | 5 | 6 | 7 | 8 |
| VP1483 | diguanylate cyclase | 7 | 7 | 6 | 6 | 6 | 6 |
| VP1881 | c-di-GMP phosphodiesterase | 22 | 14 | 18 | 12 | 6 | 4 |
| VP1892 | methyl-accepting chemotaxis protein | 10 | 7 | 12 | 9 | 9 | 7 |
| <VP2876>c | nucleotide binding protein | 30 | 8 | 16 | 4*d | 22 | 6 |
| VP2877 | DnaQ-like exonuclease | 40 | 7 | 23 | 4 | 31 | 6 |
| <VP2878> | acetyl-CoA synthase | 10 | 3* | 9 | 3* | 23 | 7 |
| Down-regulated Tier 2 genese | |||||||
| VP0376 | c-di-GMP phosphodiesterase | 5 | 3 | 3 | 2* | 4 | 2* |
| VP0629 | homocysteine synthase | 5 | 3 | 3 | 2* | 3 | 2 |
| VP1117 | hypothetical protein | 10 | 3 | 6 | 2* | 9 | 3 |
| VP1524 | nicotinate mononucleotide:5,6-dimethylbenzimidazole phosphoribosyltransferase | 7 | 3 | 3 | 1* | 6 | 2 |
| VP2701 | MSHA biogenesis protein MshE | 3 | 3 | 2 | 2* | 2 | 2* |
| VP2702 | MSHA biogenesis protein MshN | 3 | 2 | 2 | 2* | 2 | 2 |
| VP2714 | aminotransferase, class V | 2 | 1* | 3 | 1* | 6 | 3 |
| VP3059 | acetolactate synthase II, small subunit | 3 | 3 | 2* | 2 | 3 | 3 |
| VPA0711 | aminotransferase, class II | 5 | 7 | 3* | 4 | 4 | 5 |
Core genes were repressed in all comparisons [S vs L, PS1 vs L, PS2 vs L, S vs LD, PS1 vs LD, PS2 vs LD].
Boxes outline genes in potential operon with promoter proximal gene in bold type.
<VP2876> and <VP2877> do not meet the core criteria (being Tier 2 genes); however they are in a potential transcriptional unit with VP2877.
indicates poor fold or p value.
Tier 2 genes were derived from genes in common [S vs L, PS1 vs L, PS2 vs L] or [S vs LD, PS1 vs LD, PS2 vs LD] and are repressed in at least 4/6 comparisons (by fold >2 and with p value <0.05).
FIGURE 6. Profiles of surface-responsive gene expression.

The normalized expression values (log2) for selected genes as captured by the microarray analysis are plotted for each microarray condition. The profiles of gene expression represent three differentially expressed classes and one control class: A. Surface-induced, LafK-dependent; B, Surface-induced, LafK-independent; C, Surface-repressed, LafK-independent; and D, Representative control genes showing constitutive expression over these conditions. Error bars represent standard error of replicates.
In addition, Tables 3 and 4 include some genes (~20 in number, designated as Tier 2) that marginally missed being included by using the core criteria, i.e., genes that showed consistent regulation in 4/6 comparisons. Some of the Tier 2 genes were placed in the core if the surface regulation profile was verified by an independent means (as indicated below). We emphasize that the core represents a minimum set—a robust set of genes derived from 6 comparisons and mostly showing > 4-fold changes in gene expression when grown on a surface. Certainly some of the Tier 2 and additional genes at the periphery of our stringency criteria may also belong to the core set of surface-responsive genes and future work must evaluate the significance of their observed regulation. We note that genes regulated specifically by PS1 or PS2 conditions for the most part include polar flagellar or phenamil-specific genes, respectively.
The comparisons and cutoffs used to populate Tables 3 and 4 are not independent, i.e., each condition is used twice. As a result, it is not obvious how to define an overall false discovery rate for these tables. Nevertheless, a conservative upper bound may be established by taking the two essentially independent comparisons S vs L and PS1 vs LD and multiplying their false discovery rates. Using this as justification, we estimate that the false discovery rate among Tier 1 genes is below 0.5%, and that the false discovery rate for Tier 2 genes is below 5%. We remark that because these analyses were performed using a heterologous array (Strain BB22 has not been sequenced), the core also represents the minimal list because there may be some strain-specific genes to be discovered.
Flagellar and nonflagellar genes are induced by surface sensing
The pseudosurface (PS1 and PS2) and surface (S) conditions induced all of the LafK-dependent genes identified by the lafK+ vs lafK− trancriptome comparison; representative LafK-dependent, flagellar and nonflagellar gene expression profiles are shown Figure 6A. Genes in the fliML operon (VPA1540–1546) exemplify the second observed pattern of expression. Transcription of this operon was induced by S or PS conditions, but was not regulated by LafK. Some nonflagellar genes were regulated similarly as those in the fliML operon; representative transcription profiles are shown in Figure 6B, including VP1002, (~39-fold, S vs L), VP2370 (~6-fold, S vs L), VPA1598 (~111-fold, S vs L) and VPA0459 (~127-fold, S vs L). These results were corroborated by RTPCR (Figure 4). Similar to fliML, little or no product was produced for VPA0459, VPA1598, or VP2370 using RNA prepared from the wild-type strain grown in liquid, whereas product was found for all of the surface-grown RNA samples.
Strains with reporter Tn5lux insertions in VP1002 and VPA1598 were isolated. They exhibited surface-induced luminescence, as did the LafK-regulated vpa0227::lux reporter strain (Fig. 3C). These strains produced little light when grown in L (<16 SLU), whereas growth in S induced luminescence (> 2,000, SLU, Figure 3C). The transposon insertions caused no defect in swarming motility (Figure 3A). VP1002 encodes a large hypothetical lipoprotein (906 aa). VPA1598 encodes a product homologous to the secreted, N-acetyl glucosamine binding protein A of V. cholerae (VCA0811; 70% Identities/82% Positives; E-value=0.0). In addition to having large fold degrees of regulation, the level of expression for some of these genes was particularly high. For example, growth on a surface induced a level of expression of VPA1598 (encoding the GlcNAc binding protein) almost equivalent to that for a ribosomal protein gene (Figure 6).
Genes negatively regulated by growth on a surface
Only a few genes showed lower expression profiles in surface or pseudosurface grown cells (Table 4). Transcription of one methyl accepting chemoreceptor gene, VP1892, was decreased ~10-fold by growth on S or PS compared to L. Repression was observed for another set of genes (VP2876 to VP2878) that potentially form an operon involved in nucleotide signaling because they encode proteins with cyclic nucleotide binding and CBS domains (COG2905; E-value=1.0e-180) and DnaQ-like exonuclease (DEDDh; E-value=4e-32) domains. (Figure 6C).
Two genes sets pertinent to c-di-GMP signaling were also negatively regulated. VP1482 and VP1483 (potentially forming an operon) were repressed ~8-fold for all surface conditions (Figure 6C); this result was confirmed by RTPCR (Figure 4). This operon encodes one protein with a response regulator receiver domain (REC; E-value=5e-18) and another protein with a PAS_4 domain (pfam08448; E-value=0.008) and a GGDEF domain (pfam00990; E-value=1e-43), which is the catalytic domain responsible for c-di-GMP formation. VP1881 was repressed ~11 fold over all surface to liquid comparisons; it encodes a predicted membrane-bound c-di-GMP phosphodiesterase, containing a highly conserved EAL domain (pfam00563; E-value=3e-34).
c-di-GMP levels during growth on a surface
These transcriptome analyses revealed positive and negative expression changes for genes encoding enzymes involved in the synthesis and degradation of the second messenger c-di-GMP. Genes encoding both a diguanylate cyclase and phosphodiesterase were repressed approximately the same fold and to similar levels of expression by growth on a surface (Table 4 and Figure 6C), while another operon encoding a phosphodiesterase was induced by growth on surfaces and pseudosurfaces (Table 3). This operon, named scrABC (VPA1513-11), was implicated previously in the regulation of swarming. Mutants with defects in the scrABC operon are profoundly defective for swarming motility; the operon is ~ 8-fold upregulated by growth on surfaces compared to liquid as measured by using a scrC::lux reporter; and ScrC was demonstrated to affect the cellular c-di-GMP pool (Boles and McCarter, 2002; Ferreira et al., 2008). The level of expression of this operon during surface growth was >5 log2 higher than the levels observed for either of the surface-repressed c-di-GMP-pertinent genes. Although one cannot deduce c-di-GMP levels directly from the gene expression patterns, particularly since these are sensory-coupled enzymes, the fact that microarray data reports a high absolute level of expression of the scrABC operon (Figure 6B) is consistent with its strong mutant phenotype. Together, the data suggest that c-di-GMP signaling plays a role during growth on a surface.
To examine c-di-GMP, the nucleotide pools of the wild type strain grown in liquid and on a surface according the microarray conditions were extracted for analysis by using high-performance liquid chromatography-coupled mass spectrometry. The mean observed value of the c-di-GMP concentration for liquid-grown cells (11.8 pmol/mg total bacterial protein) was higher than the concentration for surface-grown cells (7.64 pmol/mg) (Figure 7). The ΔscrABC strain was grown similarly on a surface. In a prior study, the products of the scrABC operon were demonstrated to decrease the cellular level of c-di-GMP; however these studies did not examine the level of this nucleotide during growth on a surface. Consistent with the demonstrated role of ScrABC acting as a phosphodiesterase and playing a regulatory role during swarming, the intracellular level of c-di-GMP was higher for the ΔscrABC mutant strain (11.0 pmol/mg) than its wild-type parent during growth on a surface (Figure 7).
Figure 7. Intracellular concentration of c-di-GMP.

The wild-type strain LM5674 was grown in liquid (L) and on a surface (S) as per the microarray condition and harvested to determine the concentration of c-di-GMP. Mutant strain LM6567 (ΔscrABC; Scr−) was also extracted after growth on a surface. The average concentrations of two replicates calculated as pmol c-di-GMP per OD600nm unit were: L, 3.09 (± 0.2); S, 1.48 (± 0.02); and S(Scr−), 2.03 (± 0.04), with the standard deviation given in parentheses. For the graph, these numbers were converted to pmole per mg bacterial protein using an experimentally derived conversion factor for each strain grown under the particular condition. The amount of c-di-GMP measured for surface-grown wild type (S) was statistically different compared to liquid-grown wild type (L) or to the surface-grown scrABC mutant [S(Scr−)], specifically p values < 0.018 and < 0.002, respectively, determined by using Student’s t test.
Linking surface-responsive gene expression and virulence
Some genes induced by surface and pseudosurface conditions encode products that are potential virulence factors, e.g., collagenase, alkaline serine protease, N-acetyl glucosamine binding protein, and metalloendoprotease. Collagenase production was examined for strains grown in liquid by assaying supernatants using a fluorogenic substrate. Specifically, the wild-type strain was grown in L, LD, and PS1; the fla mutant in LD (=PS2), and the lafK mutant in LDP (pseudosurface condition). Little collagenase activity was detected in the supernatants for the wild-type strain grown in L or LD, whereas considerable activity was detected for all of the strains grown under PS conditions (Figure 8A). These results provide evidence that VPA0459 encodes a collagenase that is specifically induced in a LafK-independent manner by growth on a surface.
FIGURE 8. Growth on a surface enhances collagenase activity and cytotoxicity towards host cells in culture.
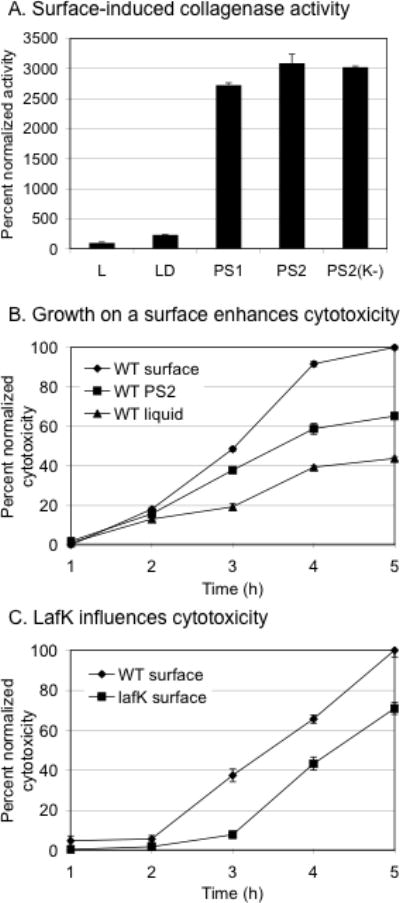
A. Collagenase activity of wild-type and mutant strains. Strains were grown in liquid as per the indicated microarray condition, harvested at similar OD600nm, centrifuged, and the supernatants were used in a fluorescence-based collagenase assay. Activity is reported as percent activity normalized to the activity of the wild-type strain grown in liquid, which was ~280 units. Purified Clostridium histolyticum Type IV collagenase (0.1 U) produced ~7000 fluorescence units in this assay. The reaction time was 120 min. Growth conditions and strains: The wild-type strain LM5674 in L, LD, and PS2; the Fla− strain LM5392 in LD (PS1); and the lafK mutant LM7789 in PS2 (PS2 (K−)]. The experiments were repeated at least three times with similar results. A representative experiment is shown and error bars represent standard deviation of triplicate measurements. B. The wild-type strain was grown as per microarray conditions (S, PS2, and L) and used to infect Chinese hamster ovary (CHO) host cells. Cytotoxicity was assayed by measuring release of host cell lactate dehydrogenase over time; it is expressed as percentage of maximum WT cytotoxicity for the experiment. Maximal WT cytotoxicity was usually ~70 % of total lysis achieved with detergent Triton X-100. Multiplicity of infection was ~15. Error bars indicate standard error of the mean of 6 individual samples at each time point for a representative experiment. P values at 3, 4, and 5 h were less than 0.004 for all comparisons (i.e., S vs L, PS2 vs L, and S vs PS2). C. The wild-type and lafK strains were grown and harvested on a surface as per microarray growth conditions, used to infect host cells, and assayed as described above. The p values for the lafK mutant compared to the wild type at 3, 4 and 5 h were 0.004, 0.02, and 0.04, respectively. Each of these experiments has been repeated at least three times with similar result.
Another class of virulence genes showing enhanced expression as a consequence of growth on surfaces encodes components of a type three secretion system that is located on chromosome 1 (T3SS1), exemplified by VP1701 in Figure 6A. These T3SS1 genes showed increased expression as a consequence of growth on S and PS conditions and decreased expression in the lafK mutant. In fact, many linked genes encoding other T3SS components showed a similar trend in gene expression, albeit their fold or p values fell slightly outside of our criteria (Figure S2 plots gene expression profiles for many of these).
To examine whether growth on a surface might stimulate virulence, the capacity of V. parahaemolyticus to kill host cells was measured using a cytotoxicity assay. For these experiments, surface and liquid grown cells were used to infect Chinese hamster ovary CCL-61 (CHO) cells and host cell lysis was monitored over time by measuring release of the host enzyme lactate dehydrogenase. This assay has been used as a measure of V. parahaemolyticus T3SS1 activity during co-culture with a variety of mammalian cell lines (Park et al., 2004; Zhou et al., 2009). Pre-growth of the wild type V. parahaemolyticus on S enhanced the degree of cytotoxicity to host cells compared to prior growth in L as did pre-growth under PS2 conditions, albeit not quite as well as growth on plates (Figure 8B). The cytotoxicity of a lafK mutant was also assessed because this mutant displayed decreased expression of T3SS1 genes and other potential virulence genes (Table 2). The surface-adapted lafK mutant [S(K−)] showed delayed and reduced cytotoxicity compared to the surface-adapted wild-type strain [S] (Figure 8C). Thus, we conclude that growth on a surface can elevate the potential virulence of the organism and this is in part due to regulation occuring through LafK.
Discussion
For bacteria, growth on surfaces results in profound changes in gene expression compared to growth in liquid. Although many of these changes are due to the complex physiology of growth under different circumstances, some may be the result of a programmed response to the surface per se. In this work we have defined a core set of genes in Vibrio parahaemolyticus belonging to a surface-responsive program of gene regulation. The surface-responsive genes have been distinguished from a larger group of genes whose expression changes as a consequence of growth on a solid medium because their expression also changes when the bacterium is manipulated into sensing that it is on a surface while growing in liquid.
The surface-responsive core is relatively small in number (<70) and contains many more positively than negatively regulated genes. Almost 2/3 of the induced genes are involved in swarming motility. We have positioned the core genes in a wiring diagram of gene control (summarized in Figure 9). Transcription of some requires the specialized lafσ28 for expression (Class 3 genes), other genes utilize the σ54-dependent LafK regulatory protein (Class 2 genes), and others are co-regulated with lafK itself (Class 1 genes). Certain of the Class 2 genes, in particular the flagellar genes, strictly require LafK (and σ54)for expression, whereas the transcription of other genes (such as certain virulence genes) is modulated by, but not stringently dependent upon LafK. We emphasize that our core genes comprise a robust minimal set; we have confirmed their membership in various ways. Clearly there are more surface-responsive genes to be discovered, e.g., genes with small fold regulation found at the periphery of our statistical criteria as well as genes unique to our particular strain of V. parahaemolyticus since a heterologous array was probed. Below we discuss some themes that have emerged from our transcriptional profiles and follow-up studies.
FIGURE 9. The surface sensing program of gene control in V. parahaemolyticus includes motility, virulence and sensory enzymes.

A core set of ~70 genes is regulated in response to surface sensing mediated by the polar flagellar organelle. Our microarray studies coupled with RTPCR and reporter gene analysis in this and also prior work enables the construction of a working scheme of gene control organized in three hierarchical levels. Class 1 expression is LafK-independent and includes the lafK operon. Other Class 1 genes comprise the lateral fliM operon, as well as non-flagellar genes, including genes pertinent to c-di-GMP signaling, colonization (N-acetyl glucosamine binding protein), and virulence (collagenase). Although the majority of the Class 1 genes are induced by growth on a surface and pseudosurface conditions, some were surface-repressed (distinguished by the dark box). Class 2 expression is promoted by the transcription factor LafK and σ54. LafK directs expression of the flagellar genes needed primarily for assembly of the hook basal body structure and upregulates its own operon, which includes motor, MS-ring and the flagellar ATPase genes. LafK also modulates transcription of type three secretion genes (T3SS1) and VPA0227 encoding an alkaline serine protease; however these genes do not absolutely require LafK for transcription (and so are placed a Class 2 box distinct from the lateral flagellar operons). LafK directs expression of fliAL encoding the specialized laf σ28, which in turn promotes expression of theClass 3 genes including those encoding LafA flagellin, a chemoreceptor, metalloendoprotease, CcmA, a peptidoglycan-binding protein (SPOR), and a small RNA.
Swarming motility
As expected from the dimorphic pattern of flagellation in this organism, the majority of the surface-regulated genes are laf genes; however there were some surprises. A few new potential motility genes were discovered. These encode nontraditional products as they have no known flagellar orthologs, although they were found to be transcribed as part of extended laf operons. Transposon insertions in 2 of these genes resulted in swarming deficiencies. Two chemotaxis receptor proteins were regulated approximately 10-fold—one induced and one repressed by growth on the surface. The σ54-dependent regulator LafK was disqualified from its putative role as the “master” lateral flagellar regulator by the discovery that some flagellar genes were not regulated by LafK; instead, they were found co-regulated with lafK. Products of the fliML operon and the downstream genes in the lafK operon form the C-ring and export apparatus. Not being strictly under control of a flagellar regulator suggests that perhaps these genes are not dedicated solely to laf protein export.
There were a few genes showing high fold surface induction whose products may be pertinent to the morphological changes accompanying swarmer cell differentiation. For example, VPA1294 (regulated ~500-fold between L and S) encodes a product predicted to be a small outer membrane protein with a peptidoglycan-binding SPOR domain. Perhaps inserting hundreds of flagellar basal bodies into the elongated swarmer cell envelope requires some remodeling or reinforcement of the cell wall. Alternately, VPA1294 could play a more direct role in swarmer cell elongation as multiple proteins with SPOR domains have recently been shown to participate in cell division in bacteria (Arends et al., 2010; Dai et al., 1993; Gerding et al., 2009; Moll and Thanbichler, 2009).
A 2-gene operon showed similarly large surface induction (~400-fold induction in S vs L). VPA1649 is predicted to be in the M23 peptidase (or LytM) family, members of which are zinc metalloproteases. It shows conservation of all of the active-site residues determined for the staphylococcal ALE-1 enzyme, a glycylglycine endopeptidase (Fujiwara et al., 2005). VPA1649 might also be involved in cell wall modification during swarming. Support for such an idea also derives from the identity of the product encoded by the downstream gene co-regulated with VPA1649. The second gene product contains the predicted conserved domain CcmA (COG1664) that has been implicated in curved cell morphology in a few organisms. In fact, the genes and their organization in the V. parahaemolyticus operon show striking resemblance to the three-gene shape locus of Helicobacter pylori, which encodes two M23-family metalloendopeptidases and ccmA (Sycuro et al., 2010); interestingly, the coding region of ccmA overlaps with the upstream protease gene in both organisms. H. pylori mutants with defects in this locus form curved, rather than helical rods. P. mirabilis also has a ccmA homolog, although it is not found in an operon with a peptidase and it encodes a larger, membrane-bound protein. Nevertheless, expression of the gene (PMI1153) is upregulated during swarming (7-fold), the Ccm1 product is more abundant in swarmer cells (~20-fold), and a C-terminal truncation mutation (but not a full deletion) affected cell morphology and swarming behavior (Hay et al., 1999; Pearson et al., 2010).
Elongation
Swarmers cells are often quite long (Harshey, 1994); however the basis for this elongation is not understood in any organism. One interesting finding resulting from our studies was that the lafK mutant failed to elongate fully when grown on a surface. However we note, with some disappointment, that there were no observed changes in expression of genes known to be involved in cell division in any of our microarray comparisons. Taken together, we suspect that elongation may result from small changes in gene expression or be initiated by post-transcriptional mechanisms that could be further amplified by downstream events, e.g., the massive overproduction of the lateral flagella might interfere with assembly of a functional septal ring.
Sensory Reception
Several of the surface-regulated genes encode enzymes involved in sensing and or transducing signals. Among these are two chemotaxis receptor proteins and three surface-regulated genes encoding enzymes with the capacity to modulate levels of the second messenger c-di-GMP. The latter are multidomain proteins containing signal reception/transduction domains coupled to output enzymatic domains capable of synthesizing (DC activity) or degrading (PDE activity) c-di-GMP. Expression of one MCP increased and another decreased in response to growth on a surface. The task of deciphering their specific roles is complicated by the fact that the organism possesses a plethora of chemoreceptors (29 in number); however we hypothesize that the fluctuations represent an altered capacity for modulating swarming behavior in response to new or different cues. Chemotaxis is required to coordinate swarming motility, although regulation of lateral flagellar gene expression is unaffected by chemotaxis mutations (Sar et al., 1990 and L. McCarter, unpublished).
The direction of regulation the genes encoding the c-di-GMP pertinent enzymes was also mixed: expression of genes encoding one PDE and one DC was repressed while that for another PDE was increased by growth on the surface. Moreover, like the panoply of chemoreceptors found in V. parahaemolyticus, the organism possesses at least 59 c-di-GMP pertinent sensory proteins. We interpret this to indicate that particular enzymes do not solely dictate the concentration of cellular c-di-GMP; rather their influence on the cellular level depends upon their relative abundance and the signals they process. Nevertheless, we were able to analyze cellular c-di-GMP and found that the c-di-GMP pool was lower for cells growing on a surface at the onset of swarming compared to growth in liquid. A lower concentration of c-di-GMP is consistent with the fact that surface sensing induces a very active form of motility, i.e., swarming (Wolfe and Visick, 2008).
Colonization and virulence
The third theme of regulation appears to be one relevant for pathogenesis. VPA1598 encodes a potential key colonization factor. Upon induction, this gene showed remarkably high-level expression in the microarray analyses, i.e., similar to the level of expression for the flagellin gene lafA or rRNA genes. The predicted product of VPA1598 is an N-acetyl glucosamine and chitin-binding protein, and is homologous to V. cholerae GbpA, which promotes adherence to zooplankton as well as human epithelial cells (Kirn et al., 2005).
One large gene set exhibiting enhanced expression under surface and pseudosurface conditions encodes components of a T3SS. These genes are predominantly found in the pathogenicity island located on chromosome 1 (Makino et al., 2003). They were regulated between 4–6-fold in L vs S and L vs PS comparisons. In fact, this trend in expression was observed for most of the predicted T3SS1 genes, albeit the fold regulation was smaller. Furthermore, this group of genes showed diminished expression in the lafK mutant.
Other surface-induced genes that seem pertinent for the pathogenesis of the organism include an alkaline serine protease (VPA0227), a collagenase (VPA0459), and perhaps the aforementioned LytM-family metalloprotease (VPVPA1649). Two V. parahaemolyticus collagenases (VP1340 and VPA0459) have been characterized previously. VP1340 was believed to encode the major extracellular enzyme; however, the experiments were performed using broth-cultivated bacteria (Miyoshi et al., 2008). Our array analyses report relatively low constitutive expression values for VP1340 over all conditions examined, but the expression of VPA0459 increased >125-fold when the cells were grown on plates. In confirmation, secreted collagenase activity greatly increased upon cultivation in PS conditions compared to L. Thus, the pathogenic potential of the cell was found strikingly different between growth in liquid and on a surface.
Although many virulence traits have been observed to be co-regulated with swarming in many bacteria, the link between swarming and virulence has not been directly demonstrated in most cases (reviewed in Kirov, 2003; Verstraeten et al., 2008). To probe whether our observed increases in virulence gene expression were biologically meaningful in V. parahaemolyticus, the cytotoxicity of surface-adapted and liquid-grown cells was compared. We found that pre-growth on a surface or pseudosurface condition increased the ability of V. parahaemolyticus to kill host tissue culture cells. Furthermore, mutation of the swarming regulator lafK diminished cytotoxicity. Thus, the surface-responsive program of gene control seems to prepare V. parahaemolyticus for virulence.
Commonalities with other swarming bacteria
Swarming cells may play a particular role in infection because surface-associated motility can promote colonization of specialized niches, and the coupling of swarming motility and virulence gene expression may confer distinct advantages. For example, swarming motility of P. mirabilis promotes the ascending colonization of the urinary tract (Allison et al., 1994). Lateral flagella aid colonization of human intestinal cell lines by Aeromonas spp. (Kirov et al., 2004), and swarming similarly enables colonization of the distal part of the root by certain plant pathogens (Sanchez-Contreras et al., 2002). The global gene transcriptome and proteome trends observed in P. aeruginosa, P. mirabilis, S. enterica serovar Typhimurium, and now in V. parahaemolyticus clearly support the idea that surface-adapted cells are more pathogenic (Kim and Surette, 2004; Overhage et al., 2008; Pearson et al., 2010; Wang et al., 2004). Type three secretion genes were induced upon growth on surfaces in S. enterica Typhimurium, P. aeruginosa, and V. parahaemolyticus (Kim and Surette, 2004; Overhage et al., 2008; Pearson et al., 2010; Wang et al., 2004). The expression of genes encoding a variety of extracellular enzymes---e.g., elastase in P. aeruginosa (5-fold), collagenase in V. parahaemolyticus (125-fold), hemolysin and urease in P. mirabilis (8 and 5-fold, respectively), and a variety of proteases in all three organisms—are upregulated and probably provide indicators of host target specificity (Kim and Surette, 2004; Overhage et al., 2008; Pearson et al., 2010; Wang et al., 2004). What seems worth remarking with respect to V. parahaemolyticus is that the fold and absolute level of expression is very high for many of these potential virulence genes, i.e., there is a profound on/off switch from one mode to the other.
The physiology of growth on surfaces
Although this report focuses on the genes that respond to surface sensing mediated by the polar flagellum, we emphasize that the genes that have been subtracted will also be important to explore in future—studies these genes, which are induced by growth on a surface but not by either of the pseudosurface conditions, are indicated in Table S3. The identity of some will provide insight into the basic physiology of growth on surfaces and others may illuminate surface-specific responses that are distinct from those mediated by polar flagellar sensing.
Our data did not reveal evidence that surface sensing per se enhances expression of antibiotic resistance genes. However, there were some expression changes observed for genes encoding efflux pumps and other transport proteins in the S v L comparison (Table S3). The differences in antibiotic sensitivity between swimmers and swarmers that have been observed by others (Kim and Surette, 2004; Overhage et al., 2008) (Lai et al., 2009) might be organism specific; however, we suggest that those observed changes might also accrue from differences provoked by the physiology of growth on a surface and the complexity of comparing such differently growing cell types. We note that recent work supports the latter idea (Butler et al., 2010).
One physiological distinction between life in liquid vs an agar medium apparent from the transcriptome comparisons is iron availability. Diffusion of iron to V. parahaemolyticus cells growing in communities on surfaces seems limiting and iron is a key signal mediating swarmer cell differentiation (McCarter and Silverman, 1989). The problem of iron acquisition seems generally important for cells growing in communities on surfaces, whether it be in a biofilm (Glick et al.) or on agar during swarming. The microarray analysis presented here supports this observation: expression of some iron-acquisition genes increased (e.g., the ferrienterochelin TonB-dependent receptor) and expression of some genes encoding iron-containing proteins (e.g., ThiC) decreased. A list of iron-regulated genes (defined in the L v LD comparison) that were also regulated during growth on the agar medium is provided in Table S4. Regulation of iron-pertinent genes by growth on a surface was also observed in the S. enterica Typhimurium and P. aeruginosa microarray analyses performed comparing cells harvested from plates and liquid (Overhage et al., 2008; Wang et al., 2004). Indeed, much of the surface-induced transcriptome response of P. aeruginosa seems centered on producing siderophores for iron acquisition (Overhage et al., 2008).
Summary
Here we begin to define the surface-responsive program of gene control in V. parahaemolyticus. The genes in this network provide information about general surface colonization and virulence programs as well as insight into the particular strategies employed by the organism. Some general themes with respect to the kinds of genes that are co-regulated with swarming are emerging for swarming bacteria, including enhanced production of virulence factors (Kirov, 2003; Overhage et al., 2008; Pearson et al., 2010; Wang et al., 2004). For V. parahaemolyticus, we show that regulation of some of these traits is the direct consequence of the organism’s perception of its physical environment rather than a secondary consequence of metabolic differences that accrue during growth on surfaces in tightly packed communities. Moreover, our data demonstrate that the surface sensing response primes the cell to be prepared for encounters with a potential host. We also find that the panel of sensory proteins and the level of the second messenger c-di-GMP present in the cell differ between life in liquid and on a surface, suggesting that cells may be programmed to detect and respond to different cues in different environments. The ability to move over and colonize a surface has important consequences with respect to bacterial survival strategies, and our findings show that bacteria can do some things inherently differently as a direct result of their perception of their physical environment.
Experimental Procedures
Bacterial strains and media
The bacterial strains and plasmids used in this work are described in Table 5. Heart infusion (HI) broth contained 25 g heart infusion (Difco) and 15 g NaCl per liter; heart infusion plates contained HI broth with 20 g/l granulated agar (Difco). Supplements were used at the following concentrations: 50 μM 2,2′-dipyridyl (Sigma) and 40 μM phenamil methanesulfonate salt (Sigma). The isolation of Tn5 and Tn5lux insertions in V. parahaemolyticus has been described (Jaques and McCarter, 2006; Stewart and McCarter, 2003).
TABLE 5.
Bacterial strains and plasmids
| Strain | Genotype or descriptiona | Parent (reference) |
|---|---|---|
| LM4652 | motA2P::TnphoA opaR14 | LM5314 (Boles et al., 2000) |
| LM5093 | opaR6 | (Enos-Berlage et al., 2005) |
| LM5392 | flaM1P::EzKan opaR14 | LM5314 |
| LM5431 | opaR2 (Phosonomycinr) | (Stewart and McCarter, 2003) |
| LM5674 | ΔopaR1 | BB22OP (Enos-Berlage et al., 2005) |
| LM5738 | flgB1L::Tn5 lux opaR2 (lux aligned with transcription) | LM5431 (Stewart et al., 2003) |
| LM5839 | flhA1L::Tn5 lux opaR2 (lux not aligned) | LM5431 (Stewart and McCarter, 2003) |
| LM5841 | fliQ1L::Tn5 lux opaR2 (lux not aligned) | LM5431 (Stewart and McCarter, 2003) |
| LM6159 | vpa1598::Tn5 lux opaR2 (lux aligned) | LM5431 |
| LM6161 | vp1002::Tn5 lux opaR2 (lux aligned) | LM5431 |
| LM6209 | ΔrpoN1::Camr ΔopaR1 | LM5674 (Stewart and McCarter, 2003) |
| LM6210 | ΔfliA1L::Camr ΔopaR1 | LM5674 (Stewart et al., 2003) |
| LM6567 | Δ scrABC4::Camr | LM5674 (Ferreira et al., 2008) |
| LM7789 | ΔlafK2::Camr ΔopaR1 | LM5674 |
| LM7890 | ΔlafK3::Kanr ΔopaR1 | LM5674 |
| LM8858 | vp0575::Tn5lux opaR2 (lux aligned) | LM5431 |
| LM8906 | ΔopaR1/pLM3016 (flgC2L::lacZ) | LM5674 |
| LM8912 | flhA1L::Tn5 lux opaR2/pLM3016 (flgC2L::lacZ) | LM5839 |
| LM8913 | fliQ1L::Tn5 lux opaR2/pLM3016 (flgC2L::lacZ) | LM5841 |
| LM8933 | ΔrpoN1::Camr ΔopaR1 | LM6209 |
| LM8935 | ΔlafK3::Kanr ΔopaR1 | LM7890 |
| LM8936 | ΔopaR1/pLM3034 (lafK1::lacZ) | LM5674 |
| LM8943 | flhA1L::Tn5 lux opaR2/pLM3034 (lafK1::lacZ) | LM5839 |
| LM8944 | fliQ1L::Tn5 lux opaR2/pLM3034 (lafK1::lacZ) | LM5841 |
| LM8948 | ΔrpoN1::Camr ΔopaR1/pLM3034 (lafK1::lacZ) | LM6209 |
| LM8950 | ΔlafK3::Kanr ΔopaR1/pLM3034 (lafK1::lacZ) | LM7890 |
| LM9376 | vpa0227::Tn5 lux opaR6 (lux aligned) | LM5093 (Enos-Berlage et al., 2000) |
| LM9401 | kbl::Tn5 lux opaR6 (vpa1510=kbl gene; lux aligned) | LM5093 (Enos-Berlage et al., 2000) |
| LM9620 | vpa0227::Tn5 lux opaR6 ΔlafK2::Camr (lux aligned) | LM9376 |
| LM9889 | vpa0260::Tn5 ΔflaFAB2 ΔflaCD1708::Camr ΔopaR1 | LM4281 (Jaques, 2005) |
| LM9890 | vpa0275::Tn5 ΔflaFAB2 ΔflaCD1708::Camr ΔopaR1 | LM4281(Jaques, 2005) |
| Plasmid | ||
| pLM3016 | Tetr cosmid pLM1776 containing flgC2L::lacZ (Camr) | (Jaques, 2005) |
| pLM3034 | Tetr cosmid pLM2910 containing lafK1::lacZ (Genr) | (Stewart and McCarter, 2003) |
Polar (fla) and lateral (laf) flagellar genes are distinct and are indicated with the subscript P and L, respectively.
Microarray growth conditions
To examine V. parahaemolyticus grown in liquid culture, overnight cultures were diluted 1:200 in HI and grown to an OD600nm of ~0.6. The subculture was diluted to an OD600nm of 0.025 in 25 ml of HI in a 250-ml baffled flask and grown with shaking for 200 min at which time the cells were diluted into RNAprotect Bacteria Reagent (Qiagen) to a final OD600nm of 0.5. To examine V. parahaemolyticus grown on plates, cells grown overnight on HI plates were suspended and to an OD600nm of 0.05. Fifty μl of cells were spread onto HI plates. After 6 hours of growth, cells were harvested and diluted to OD600nm of 1.0 by using RNAprotect that had been diluted 2-fold in 1x DPBS pH 7.1 (Gibco). These harvested cells were used for RNA isolation, examined microscopically to document average cell length, and analyzed for flagellin production by immunoblotting.
RNA isolation, cDNA synthesis, labeling and hybridization
Cells in RNAprotect were centrifuged and lysed by using lysozyme, proteinase K, and QIAzol (Qiagen) according to manufacturer’s protocol (Qiagen RNAprotect Bacteria Reagent Handbook). For each RNA preparation, 4 ml of liquid-grown cells or 2 ml of plate-grown cells were extracted and the RNA purified using RNeasy minicolumns (Qiagen), yielding ~50 μg RNA. cDNA was synthesized using the Superscript II Reverse Transcriptase kit (Invitrogen) and pD(N)6 random hexamers (GE Healthcare). Approximately 36 μg of RNA was converted to ~7 μg cDNA and DNase digested to yield fragments between 50–200 bp. cDNA was labeled with Biotin-ddUTP (BioArray Terminal Labeling Kit; Enzo). Samples (~4.5 μg) were hybridized to the chips in the DNA Core Facility at the University of Iowa according to the standard Affymetrix protocols for E. coli.
Microarray analyses
Custom GeneChips (rhofispaa52026F; 11-μm feature size) were constructed by Affymetrix Inc. (Santa Clara, CA). Chip annotation conforms to original genome annotation and tag numbers were assigned VP numbers for chromosome 1 and VPA numbers for chromosome 2 (Makino et al., 2003). The GeneChip contains 5161 probe sets designed by using the V. parahaemolyticus RIMD2210633 genome. Analysis was done using the following software available at the University of Iowa DNA facility: Affymetrix Gene Chip Operating Software (1.2.1), Affymetrix GeneChip® Genotyping Analysis Software (GTYPE) 4.0. Using the raw signal output generated by GTYPE, processing and comparisons were made by using R version 2.8.1 GUI 1.27 Tiger build 32-bit (5301) (http://www.r-project.org/) within Bioconductor software for bioinformatics (http://www.bioconductor.org) (Gentleman et al., 2004). The complete data set was preprocessed using the GCRMA method to perform optical adjustment, background adjustment, normalization, and summarization functions (Wu et al., 2004). Data have been submitted to the NCBI and assigned the GEO accession number (GSE18763).
We note that the V. parahaemolyticus strain BB22 with which these studies were performed has yet to be sequenced; however probing the Affymetrix GeneChip with genomic BB22 DNA yielded present calls for ~98% of the predicted ORFs. Of the missing genes, many encode predicted phage, transposon, hypothetical proteins and the O-antigen locus. We also note that for multiple large transposon bank screens in strain BB22 for mutants with defects in swarming or biofilms, in only rare instances did the insertions produce ambiguous mapping to the RIMD genome. Thus, it seems reasonable to conclude that these transcriptome studies provide a good reflection of genome-wide expression patterns although a small fraction of gene activity could not be assessed.
Tests for differential expression were performed using an ANOVA model. Because p-values can be misleading in the presence of genome-wide hypothesis testing, q-values, which adjust for multiple testing, were also calculated (Storey and Tibshirani, 2003). If a gene has a q-value of 0.01, this means that if the requirements for statistical significance were lowered just enough to allow this gene to meet them, then the overall false discovery rate (FDR) of the study would be 1% (Benjamini and Hochberg, 1995).
Cell length measurements
Harvested cultures (100 μl) were fixed by dilution in an equal volume of 16% paraformaldehyde (Electron Microscopy Sciences) and were photographed using an Olympus BX60 microscope equipped with a black-and-white Spot 2 cooled charged coupled device camera (Diagnostic Instruments, Sterling Heights, Mich.). Cell length was measured using Image-Pro software version 4.1 (Media Cybernetics, Silver Spring, Md.). At least 100 cells were counted per sample.
Collagenase assay
Cultures, grown and harvested as per the specified microarray condition, were centrifuged to pellet the cells (1 ml volumes). Collagenase activity of the supernatant was measured using the EnzChek Gelatinase/Collagnase Assay Kit (Molecular Probes). The fluorescent substrate, DQ gelatin, was used at 5 μg/ml. Supernatants were diluted 1:2 into reaction buffer with substrate (200 μl final reaction volume). The reactions were performed in triplicate in 96-well optical plates and assayed at room temperature over time (30–180 min) by measuring fluorescence intensity using a microplate reader (GENious, TECAN). The excitation and emission wavelengths were 485 and 535 nm, respectively. Background fluorescence (in the reaction mixture without cells) was subtracted. Purified Clostridium histolyticum Type IV collagenase (EnzChek Collagenase Assay Kit, Invitrogen) (0.1 U) produced ~7000 fluorescence units in this assay. All strains were grown and assayed in at least three independent experiments.
Cytotoxicity Assays
Cytotoxicity was measured by co-culture of V. parahaemolyticus strains with Chinese hamster ovary (CHO) cells (ATCC CCL-61) essentially as described (Dasgupta et al., 2006). For co-culture experiments, CHO cells were seeded to yield ~ 1 × 10⁵ cells/well at the time of infection. The V. parahaemolyticus inoculum was grown as indicated using the same conditions for the microarray analyses. Bacteria were then suspended in pre-warmed Ham’s F12 at 1.5 × 10⁶ cells/ml to yield an approximate multiplicity of infection (MOI) of 15; the inoculum was also plated to calculate the actual MOI. Co-cultures were incubated at 37°C and 5% CO2 for the indicated times. Cytotoxicity was assayed by measuring release of lactate dehydrogenase (LDH) by using the CytoTox96 non-radioactive kit (Promega Corp., Madison, WI). Six replicate wells were measured per data point. Percent of lysis was calculated by comparing to total lysis obtained in control reactions using 0.9% Triton X-100; control wells without bacteria were used to calculate the background level of lysis. Experiments have been repeated at least 3 times with similar results. Tests for statistical significance were conducted by using Student’s t-test (2-tailed distribution with two sample, equal variance calculations).
c-di-GMP measurements
The extraction procedure was kindly provided by Chris Waters (personal communication and Waters et al., 2008). The equivalent of 16 OD600 units of cells that were grown and harvested as per the microarray conditions were centrifuged for 3 min at 15,000 × g and 4°C and suspended in 0.25 ml extraction buffer, which was 40% methanol-40% acetonitrile in 0.1N Formic acid. Samples were incubated at −20°C for 30 minutes and centrifuged in a microcentrifuge for 5 min at 13,000 rpm at 4°C. Supernatant was harvested (0.2 ml) and placed on ice. The residual supernatant and pellet were extracted a second time with 0.125 ml extraction buffer. The second extraction supernatant (0.1 ml) was pooled with the first and neutralized by adding 4% volume of 15% NH4CO3. Samples were stored at −80°C and centrifuged prior to analysis. Each extraction and c-di-GMP measurement was repeated for two independent growth experiments.
Ten μl per extract were analyzed by the Mass Spectrometry Facility at Michigan State University using liquid chromatography tandem mass spectrometry (LC-MS/MS) on a Quattro Premier XE mass spectrometer (Waters) coupled with a Acquity Ultra Performance LC system (Waters). C-di-GMP was detected with electrospray ionization using multiple reaction monitoring in negative ion mode at m/Z 689.16→344.31. The MS parameters were as follows: capillary voltage 3.5 kV, cone voltage 50 V, collision energy 34 V, source temperature 120 °C, desolvation temperature 350 °C, cone gas flow (nitrogen) 50 L/Hr, desolvation gas flow (nitrogen) 800 L/Hr, collision gas flow (nitrogen) 0.15 ml/min, and multiplier voltage of 650 V. Chromatography separation was reverse phase using a Waters BEH C18 2.1 X 50 mm column and a flow rate of 0.3 ml/min with the following gradient of solvent A (10 mM tributylamine + 15 mM acetic acid in 97:3 water:methanol) to solvent B (methanol): t = 0 min, A-99%:B-1%; t=2.5 min, A-80%:B-20%; t=7.0 min, A-35%: B-65%; t=7.5 min, A-5%: B-95%; time=9.01 min, A-99%:B-1%; t=10 min, end of gradient. Chemically synthesized c-di-GMP (Axxora) was dissolved in the extraction buffer at the concentrations of 250 nM, 100 nM, 20 nM, 10 nM, 5 nM, and 2 nM and used to generate a standard curve for calculation of the concentration of c-di-GMP in each extract. These analytical methods do not report the “absolute” cellular concentration of c-di-GMP. This is in part because the efficiency of our extraction procedure is not known and in-source ionization fragmentation has not been considered. Moreover, as observed by Waters, et al. 2008, there is an unknown compound in extracts of Vibrio species that has a retention time and molecular mass close to c-di-GMP that complicates peak integration. Nevertheless, these values do reflect reproducible and significant differences in the cellular c-di-GMP pool between the strains and conditions measured. The concentration of c-di-GMP was normalized to OD600nm and to bacterial protein concentration.
In order to normalize OD600 to mg protein extracted, the protein concentration was determined by using the Bradford method (Bio-Rad Protein Assay). A culture of known optical density grown as per the microarray conditions in liquid or on a surface was centrifuged, and the cell pellet dissolved in 0.1 N NaOH by heating for 15 min at 95°C as described (Spangler et al., 2010). The protein standard was BSA. Our conversion factors for mg protein per OD600nm unit were 262 (± 4.48), 193 (± 14.2), and 184 (± 22.7) mg protein per OD600nm unit for LM5674 (L), LM5674 (S), and LM6567 (S), respectively; the standard error of the mean is given in parentheses. The difference between OD600nm to protein conversion factors for cells grown in liquid and surface conditions was statistically significant (i.e., L vs S for LM5674, the p value < 0.0001). The conversion factors were derived from 4 independent growth experiments and quadruplicate assays per experiment. Samples of matched OD600nm were also compared by using a dilution series for SDS-PAGE and Coomassie staining; the estimated difference between LM5674 (L) and LM5674 (S) was less than our limit of discrimination (< 25%). Thus, the comparison using the mg protein normalization method is the most conservative estimate of the differences in c-di-GMP concentration.
Fluorescence microscopy
The wild-type strain LM5674 was grown according to microarray growth conditions in HI broth (L) and HI plates (S) to attain swim and swarmer cells. Cells were fixed and processed for immunofluorescence microscopy as described previously (Pogliano et al., 1997). The anti-Laf antiserum #127 and the anti-Fla antiserum #129 were diluted 1:80,000 and 1:5,000, respectively. Antibody-reacted cells were incubated with membrane stain FM 4–64 (0.1 mg/ml, Invitrogen) for 5 min. Micrographs were recorded on an Olympus BX60 microscope equipped with a 100x UPlanApo objective.
Immunoblotting
Samples corresponding to ~ 0.01 OD600nm units were separated in 10% acrylamide gels by SDS-PAGE and transferred to nitrocellulose. Membranes were incubated for 1 h with polar flagellin antiserum #129 and lateral flagellin antiserum #127, which have been described (Boles and McCarter, 2000). Following a second incubation with anti-rabbit IgG antibody conjugated to horseradish peroxidase (1:10,000), membranes were developed with SuperSignal chemiluminescent substrate (Pierce) and visualized using an LAS-1000 luminescent imager (Fujifilm Life Science).
Lateral flagellar reporter assays
V. parahaemolyticus strains carrying luminescence (lux) reporter fusions were grown as indicated, generally according to microarray growth conditions, and monitored periodically for bioluminescence as described (Stewart and McCarter, 2003). Maximum light production, which occurred between the 2–3 h time point in liquid and the 6–7 h time point on plates, is reported as specific light units, which are relative total light units per min per ml per OD600nm. Lux assays were performed in triplicate, and each experimentwas performed at least twice with similar results. V. parahaemolyticus strains carrying cosmids with a lacZ reporter fusion in the lateral flagellar lafK or flgC genes were grown overnight on HI plates with 10 μg/ml tetracycline. Each fusion shows surface-dependent induction of lacZ gene expression. Cells were suspended to an OD600nm of 0.10, and 100 μl were spread upon multiple HI tetracycline plates. Cells were periodically harvested from these plates by suspending in 5 ml of medium.β-galactosidase measurements that were performed according toMiller (Miller, 1972), except that the cells were permeabilized by using Koch’s lysis solution (Putnam and Koch, 1975). Assays were performed in triplicate,and standard deviations were generally less than 10% of the mean. Each experimentwas performed at least twice with similar results. Tests for statistical significance were conducted by using Student’s t-test (2-tailed distribution with two sample, equal variance calculations).
RTPCR
Reverse transcriptase polymerase chain reaction was performed by using the Access RTPCR system (Promega Corp., Madison, WI). Annealing temperature was 56oC and the reactions proceeded for 30 cycles. Control reactions, to monitor the RNA for DNA contamination, showed no products in the absence of reverse transcriptase enzyme. Each reaction contained 50 ng of RNA template and 4 primers. Two of these were gene-specific primers and two were control primers designed to monitor mRNA for the constitutively expressed gene polar flagellar fliA. PCR products were examined in 1.0% agarose gels. Primer sequences and product sizes are supplied in Table S5.
Supplementary Material
Acknowledgments
This work was supported by NIH grant 5 R21 AI065526, NSF grant 0817593, and a Medical Research Initiative Grant from the Carver College of Medicine. C.G.P. and P.J.B. were supported by the NIH Training Grant 5 T32 GM077973 “Statistics in Microbiology, Infectious Diseases & Bioinformatics.” We thank the expert resources provided by University of Iowa Carver College of Medicine DNA Core Facility, Chris Waters for his kind help in transferring the technology of measuring cellular c-di-GMP, and the excellent assistance that we received from the Mass Spectrometry Facility at Michigan State University.
References
- Allison C, Emody L, Coleman N, Hughes C. The role of swarm cell differentiation and multicellular migration in the uropathogenicity of Proteus mirabilis. J Infect Dis. 1994;169:1155–1158. doi: 10.1093/infdis/169.5.1155. [DOI] [PubMed] [Google Scholar]
- An D, Parsek MR. The promise and peril of transcriptional profiling in biofilm communities. Curr Opin Microbiol. 2007;10:292–296. doi: 10.1016/j.mib.2007.05.011. [DOI] [PubMed] [Google Scholar]
- Arends SJ, Williams K, Scott RJ, Rolong S, Popham DL, Weiss DS. Discovery and characterization of three new Escherichia coli septal ring proteins that contain a SPOR domain: DamX, DedD and RlpA. J Bacteriol. 2010;192:242–255. doi: 10.1128/JB.01244-09. [DOI] [PMC free article] [PubMed] [Google Scholar]
- Belas R, Simon M, Silverman M. Regulation of lateral flagella gene transcription in Vibrio parahaemolyticus. J Bacteriol. 1986;167:210–218. doi: 10.1128/jb.167.1.210-218.1986. [DOI] [PMC free article] [PubMed] [Google Scholar]
- Benjamini Y, Hochberg Y. Controlling the False Discovery Rate: A Practical and Powerful Approach to Multiple Testing. J Royal Statistical Soc Series B (Methodological) 1995;157:289–300. [Google Scholar]
- Boles BR, McCarter LL. Insertional inactivation of genes encoding components of the sodium-type flagellar motor and switch of Vibrio parahaemolyticus. J Bacteriol. 2000;182:1035–1045. doi: 10.1128/jb.182.4.1035-1045.2000. [DOI] [PMC free article] [PubMed] [Google Scholar]
- Boles BR, McCarter LL. Vibrio parahaemolyticus scrABC, a novel operon affecting swarming and capsular polysaccharide regulation. J Bacteriol. 2002;184:5946–5954. doi: 10.1128/JB.184.21.5946-5954.2002. [DOI] [PMC free article] [PubMed] [Google Scholar]
- Butler MT, Wang QF, Harshey RM. Cell density and mobility protect swarming bacteria against antibiotics. Proceedings of the National Academy of Sciences of the United States of America. 2010;107:3776–3781. doi: 10.1073/pnas.0910934107. [DOI] [PMC free article] [PubMed] [Google Scholar]
- Dai K, Xu Y, Lutkenhaus J. Cloning and characterization of ftsN, an essential cell division gene in Escherichia coli isolated as a multicopy suppressor of ftsA12(Ts) J Bacteriol. 1993;175:3790–3797. doi: 10.1128/jb.175.12.3790-3797.1993. [DOI] [PMC free article] [PubMed] [Google Scholar]
- Dasgupta N, Ashare A, Hunninghake GW, Yahr TL. Transcriptional induction of the Pseudomonas aeruginosa type III secretion system by low Ca2+ and host cell contact proceeds through two distinct signaling pathways. Infect Immun. 2006;74:3334–3341. doi: 10.1128/IAI.00090-06. [DOI] [PMC free article] [PubMed] [Google Scholar]
- Ferreira RB, Antunes LC, Greenberg EP, McCarter LL. Vibrio parahaemolyticus ScrC modulates cyclic dimeric GMP regulation of gene expression relevant to growth on surfaces. J Bacteriol. 2008;190:851–860. doi: 10.1128/JB.01462-07. [DOI] [PMC free article] [PubMed] [Google Scholar]
- Fujiwara T, Aoki S, Komatsuzawa H, Nishida T, Ohara M, Suginaka H, Sugai M. Mutation analysis of the histidine residues in the glycylglycine endopeptidase ALE-1. J Bacteriol. 2005;187:480–487. doi: 10.1128/JB.187.2.480-487.2005. [DOI] [PMC free article] [PubMed] [Google Scholar]
- Gentleman R, Carey V, Bates D, Bolstad B, Dettling M, Dudoit S, Ellis B, Gautier L, Ge Y, Gentry J, Hornik K, Hothorn T, Huber W, Iacus S, Irizarry R, Leisch F, Li C, Maechler M, Rossini A, Sawitzki G, Smith C, Smyth G, Tierney L, Yang J, Zhang J. Bioconductor: open software development for computational biology and bioinformatics. Genome Biology. 2004;5:R80. doi: 10.1186/gb-2004-5-10-r80. [DOI] [PMC free article] [PubMed] [Google Scholar]
- Gerding MA, Liu B, Bendezu FO, Hale CA, Bernhardt TG, de Boer PA. Self-enhanced accumulation of FtsN at division sites, and roles for other proteins with a SPOR domain (DamX, DedD, and RlpA) in Escherichia coli cell constriction. J Bacteriol. 2009;91:7383–7401. doi: 10.1128/JB.00811-09. [DOI] [PMC free article] [PubMed] [Google Scholar]
- Glick R, Gilmour C, Tremblay J, Satanower S, Avidan O, Deziel E, Greenberg EP, Poole K, Banin E. Increase in rhamnolipid synthesis under iron-limiting conditions influences surface motility and biofilm formation in Pseudomonas aeruginosa. J Bacteriol. 2010;192:2973–2980. doi: 10.1128/JB.01601-09. [DOI] [PMC free article] [PubMed] [Google Scholar]
- Harshey RM. Bees aren’t the only ones: swarming in gram-negative bacteria. Mol Microbiol. 1994;13:389–394. doi: 10.1111/j.1365-2958.1994.tb00433.x. [DOI] [PubMed] [Google Scholar]
- Hay NA, Tipper DJ, Gygi D, Hughes C. A novel membrane protein influencing cell shape and multicellular swarming of Proteus mirabilis. J Bacteriol. 1999;181:2008–2016. doi: 10.1128/jb.181.7.2008-2016.1999. [DOI] [PMC free article] [PubMed] [Google Scholar]
- Jaques S. Microbiology. Iowa City: The University of Iowa; 2005. Regulation of swarming in Vibrio parahaemolyticus; p. 177. [Google Scholar]
- Jaques S, McCarter LL. Three new regulators of swarming in Vibrio parahaemolyticus. J Bacteriol. 2006;188:2625–2635. doi: 10.1128/JB.188.7.2625-2635.2006. [DOI] [PMC free article] [PubMed] [Google Scholar]
- Kawagishi I, Imagawa M, Imae Y, McCarter L, Homma M. The sodium-driven polar flagellar motor of marine Vibrio as the mechanosensor that regulates lateral flagellar expression. Mol Microbiol. 1996;20:693–699. doi: 10.1111/j.1365-2958.1996.tb02509.x. [DOI] [PubMed] [Google Scholar]
- Kim W, Surette MG. Metabolic differentiation in actively swarming Salmonella. Mol Microbiol. 2004;54:702–714. doi: 10.1111/j.1365-2958.2004.04295.x. [DOI] [PubMed] [Google Scholar]
- Kim YK, McCarter LL. Cross-regulation in Vibrio parahaemolyticus: compensatory activation of polar flagellar genes by the lateral flagellar regulator LafK. J Bacteriol. 2004;186:4014–4018. doi: 10.1128/JB.186.12.4014-4018.2004. [DOI] [PMC free article] [PubMed] [Google Scholar]
- Kirn TJ, Jude BA, Taylor RK. A colonization factor links Vibrio cholerae environmental survival and human infection. Nature. 2005;438:863–866. doi: 10.1038/nature04249. [DOI] [PubMed] [Google Scholar]
- Kirov SM. Bacteria that express lateral flagella enable dissection of the multifunctional roles of flagella in pathogenesis. FEMS Microbiol Lett. 2003;224:151–159. doi: 10.1016/S0378-1097(03)00445-2. [DOI] [PubMed] [Google Scholar]
- Kirov SM, Castrisios M, Shaw JG. Aeromonas flagella (polar and lateral) are enterocyte adhesins that contribute to biofilm formation on surfaces. Infect Immun. 2004;72:1939–1945. doi: 10.1128/IAI.72.4.1939-1945.2004. [DOI] [PMC free article] [PubMed] [Google Scholar]
- Lai S, Tremblay J, Deziel E. Swarming motility: a multicellular behaviour conferring antimicrobial resistance. Environ Microbiol. 2009;11:126–136. doi: 10.1111/j.1462-2920.2008.01747.x. [DOI] [PubMed] [Google Scholar]
- Makino K, Oshima K, Kurokawa K, Yokoyama K, Uda T, Tagomori K, Iijima Y, Najima M, Nakano M, Yamashita A, Kubota Y, Kimura S, Yasunaga T, Honda T, Shinagawa H, Hattori M, Iida T. Genome sequence of Vibrio parahaemolyticus: a pathogenic mechanism distinct from that of V. cholerae. Lancet. 2003;361:743–749. doi: 10.1016/S0140-6736(03)12659-1. [DOI] [PubMed] [Google Scholar]
- McCarter L, Hilmen M, Silverman M. Flagellar dynamometer controls swarmer cell differentiation of V. parahaemolyticus. Cell. 1988;54:345–351. doi: 10.1016/0092-8674(88)90197-3. [DOI] [PubMed] [Google Scholar]
- McCarter L, Silverman M. Iron regulation of swarmer cell differentiation of Vibrio parahaemolyticus. J Bacteriol. 1989;171:731–736. doi: 10.1128/jb.171.2.731-736.1989. [DOI] [PMC free article] [PubMed] [Google Scholar]
- McCarter LL. Polar flagellar motility of the Vibrionaceae. Microbiol Mol Biol Rev. 2001;65:445–462. doi: 10.1128/MMBR.65.3.445-462.2001. table of contents. [DOI] [PMC free article] [PubMed] [Google Scholar]
- McCarter LL. Dual flagellar systems enable motility under different circumstances. J Mol Microbiol Biotechnol. 2004;7:18–29. doi: 10.1159/000077866. [DOI] [PubMed] [Google Scholar]
- McCarter LL. Multiple modes of motility: a second flagellar system in Escherichia coli. J Bacteriol. 2005;187:1207–1209. doi: 10.1128/JB.187.4.1207-1209.2005. [DOI] [PMC free article] [PubMed] [Google Scholar]
- Miller JH. Experiments in molecular genetics. Cold Spring Harbor, NY: Cold Spring Harbor Laboratory; 1972. [Google Scholar]
- Miyoshi S, Nitanda Y, Fujii K, Kawahara K, Li T, Maehara Y, Ramamurthy T, Takeda Y, Shinoda S. Differential gene expression and extracellular secretion of the collagenolytic enzymes by the pathogen Vibrio parahaemolyticus. FEMS Microbiol Lett. 2008;283:176–181. doi: 10.1111/j.1574-6968.2008.01159.x. [DOI] [PubMed] [Google Scholar]
- Moll A, Thanbichler M. FtsN-like proteins are conserved components of the cell division machinery in proteobacteria. Mol Microbiol. 2009;72:1037–1053. doi: 10.1111/j.1365-2958.2009.06706.x. [DOI] [PubMed] [Google Scholar]
- Overhage J, Bains M, Brazas MD, Hancock RE. Swarming of Pseudomonas aeruginosa is a complex adaptation leading to increased production of virulence factors and antibiotic resistance. J Bacteriol. 2008;190:2671–2679. doi: 10.1128/JB.01659-07. [DOI] [PMC free article] [PubMed] [Google Scholar]
- Park KS, Ono T, Rokuda M, Jang MH, Okada K, Iida T, Honda T. Functional characterization of two type III secretion systems of Vibrio parahaemolyticus. Infect Immun. 2004;72:6659–6665. doi: 10.1128/IAI.72.11.6659-6665.2004. [DOI] [PMC free article] [PubMed] [Google Scholar]
- Pearson MM, Rasko DA, Smith SN, Mobley HL. The transcriptome of swarming Proteus mirabilis. Infect Immun. 2010 doi: 10.1128/IAI.01222-09. [DOI] [PMC free article] [PubMed] [Google Scholar]
- Pogliano J, Pogliano K, Weiss DS, Losick R, JB Inactivation of FtsI inhibits constriction of the FtsZ cytokinetic ring and delays the assembly of FtsZ rings at potential division sites. Proc Natl Acad Sci USA. 1997;94:559–564. doi: 10.1073/pnas.94.2.559. [DOI] [PMC free article] [PubMed] [Google Scholar]
- Putnam SL, Koch AL. Complications in the simplest cellular enzyme assay: lysis of Escherichia coli for the assay of beta-galactosidase. Anal Biochem. 1975;63:350–360. doi: 10.1016/0003-2697(75)90357-7. [DOI] [PubMed] [Google Scholar]
- Sanchez-Contreras M, Martin M, Villacieros M, O’Gara F, Bonilla I, Rivilla R. Phenotypic selection and phase variation occur during alfalfa root colonization by Pseudomonas fluorescens F113. J Bacteriol. 2002;184:1587–1596. doi: 10.1128/JB.184.6.1587-1596.2002. [DOI] [PMC free article] [PubMed] [Google Scholar]
- Sar N, McCarter L, Simon M, Silverman M. Chemotactic control of the two flagellar systems of Vibrio parahaemolyticus. J Bacteriol. 1990;172:334–341. doi: 10.1128/jb.172.1.334-341.1990. [DOI] [PMC free article] [PubMed] [Google Scholar]
- Spangler C, Bohm A, Jenal U, Seifert R, Kaever V. Quantitation of in vitro di-guanylate cyclase activity and in vivo levels of cyclic diguanosine monophosphate by liquid chromatography-coupled tandem mass spectrometry. Naunyn-Schmiedebergs Archives of Pharmacology. 2010;381:27–27. [Google Scholar]
- Stewart BJ, McCarter LL. Lateral flagellar gene system of Vibrio parahaemolyticus. J Bacteriol. 2003;185:4508–4518. doi: 10.1128/JB.185.15.4508-4518.2003. [DOI] [PMC free article] [PubMed] [Google Scholar]
- Storey JD, Tibshirani R. Statistical significance for genomewide studies. Proc Natl Acad Sci USA. 2003;100:9440–9445. doi: 10.1073/pnas.1530509100. [DOI] [PMC free article] [PubMed] [Google Scholar]
- Sycuro LK, Pincus Z, Gutierrez KD, Biboy J, Stern CA, Vollmer W, Salama NR. Peptidoglycan Crosslinking Relaxation Promotes Helicobacter pylori’s Helical Shape and Stomach Colonization. Cell. 2010;141:822–833. doi: 10.1016/j.cell.2010.03.046. [DOI] [PMC free article] [PubMed] [Google Scholar]
- Verstraeten N, Braeken K, Debkumari B, Fauvart M, Fransaer J, Vermant J, Michiels J. Living on a surface: swarming and biofilm formation. Trends Microbiol. 2008;16:496–506. doi: 10.1016/j.tim.2008.07.004. [DOI] [PubMed] [Google Scholar]
- Wang Q, Frye JG, McClelland M, Harshey RM. Gene expression patterns during swarming in Salmonella typhimurium: genes specific to surface growth and putative new motility and pathogenicity genes. Mol Microbiol. 2004;52:169–187. doi: 10.1111/j.1365-2958.2003.03977.x. [DOI] [PubMed] [Google Scholar]
- Waters CA, Lu WY, Rabinowitz JD, Bassler BL. Quorum sensing controls biofilm formation in Vibrio cholerae through modulation of cyclic Di-GMT levels and repression of vpsT. J Bacteriol. 2008;190:2527–2536. doi: 10.1128/JB.01756-07. [DOI] [PMC free article] [PubMed] [Google Scholar]
- Wolfe AJ, Visick KL. Get the message out: cyclic-di-GMP regulates multiple levels of flagellum-based motility. J Bacteriol. 2008;190:463–475. doi: 10.1128/JB.01418-07. [DOI] [PMC free article] [PubMed] [Google Scholar]
- Wu Z, Irizarry R, Gentleman R, Martinez-Murillo F, Spencer F. A model-based background adjustment for oligonucleotide expression arrays. J Am Statistical Assoc. 2004;99:909–917. [Google Scholar]
- Yorimitsu T, Homma M. Na(+)-driven flagellar motor of Vibrio. Biochim Biophys Acta. 2001;1505:82–93. doi: 10.1016/s0005-2728(00)00279-6. [DOI] [PubMed] [Google Scholar]
- Zhou XH, Konkel ME, Call DR. Type III secretion system 1 of Vibrio parahaemolyticus induces oncosis in both epithelial and monocytic cell lines. Microbiology-Sgm. 2009;155:837–851. doi: 10.1099/mic.0.024919-0. [DOI] [PubMed] [Google Scholar]
Associated Data
This section collects any data citations, data availability statements, or supplementary materials included in this article.