

Abstract
Urate and myeloperoxidase (MPO) are associated with adverse outcomes in cardiovascular disease. In this study, we assessed whether urate is a likely physiological substrate for MPO and if the products of their interaction have the potential to exacerbate inflammation. Urate was readily oxidized by MPO and hydrogen peroxide to 5-hydroxyisourate, which decayed to predominantly allantoin. The redox intermediates of MPO were reduced by urate with rate constants of 4.6 × 10⁵ m−1 s−1 for compound I and 1.7 × 10⁴ m−1 s−1 for compound II. Urate competed with chloride for oxidation by MPO and at hyperuricemic levels is expected to be a substantive substrate for the enzyme. Oxidation of urate promoted super-stoichiometric consumption of glutathione, which indicates that it is converted to a free radical intermediate. In combination with superoxide and hydrogen peroxide, MPO oxidized urate to a reactive hydroperoxide. This would form by addition of superoxide to the urate radical. Urate also enhanced MPO-dependent consumption of nitric oxide. In human plasma, stimulated neutrophils produced allantoin in a reaction dependent on the NADPH oxidase, MPO and superoxide. We propose that urate is a physiological substrate for MPO that is oxidized to the urate radical. The reactions of this radical with superoxide and nitric oxide provide a plausible link between urate and MPO in cardiovascular disease.
Keywords: Antioxidant, Inflammation, Neutrophil, Nitric Oxide, Oxidative Stress, Oxygen Radicals, Peroxidase, Superoxide Ion, Uric Acid, Myeloperoxidase
Introduction
Uric acid (7,9-dihydro-1H-purine-2,6,8(3H)-trione) is the end product of purine nucleotide metabolism and is mostly present in the human plasma as the urate mono-anion (pKa = 5.4) (1). The concentration of urate in human plasma is much higher (200–500 μm) than that encountered in other primates because human cells do not express the enzyme urate oxidase (2). In addition, nearly 90% of urate is re-absorbed along the renal tubules (2). In plasma, this facile electron donor is considered an important antioxidant for humans (3). Urate can chelate transition metals ions and react with hydroxyl radical and hypochlorous acid to produce relatively stable products (2). Low levels of urate have been associated with neurodegenerative disorders such as Parkinson disease, multiple sclerosis, optic neuritis, and Alzheimer disease (4).
Despite its antioxidant ability, urate has been reported to increase oxidative damage (5–7) and inactivate enzymes sensitive to oxidative stress (8, 9). High levels of urate in plasma (hyperuricemia) induce inflammation because urate crystals stimulate inflammatory cells by activation of the NALP3/NLRP3 inflammasome and production of IL-1β, which triggers the acute process of gout (10, 11). Recently, it has been found that urate released from dying cells initiates an inflammatory response that involves recruitment of neutrophils (12). It is believed to act as a danger signal that regulates inflammation (13). These pro-oxidant and pro-inflammatory effects of urate could explain the association existing between hyperuricemia and the risk for cardiovascular disease and hypertension (14–18).
An early study revealed that urate is oxidized by the heme enzyme myeloperoxidase (MPO)4 (19), but the physiological relevance of this reaction has not been investigated. MPO is the most abundant enzyme in neutrophils and is proposed to play a central role in host defense (20). It catalyzes the production of hypochlorous acid from hydrogen peroxide and chloride (21) and also acts as a classical peroxidase (see Scheme 1) (22). MPO is emerging as a significant player in various inflammatory diseases, including the promotion and progression of cardiovascular disease (23). Plasma MPO levels predict future risk of coronary artery disease (24, 25) and the mortality after acute myocardial infarction (26). The oxidants it produces convert LDL to a high uptake form that promotes formation of foam cells (27), impair reverse cholesterol transport by HDL (28, 29), promote endothelial cell dysfunction (30, 31), scavenge nitric oxide (32, 33), and destabilize atherosclerotic plaques (34).
SCHEME 1.

Halogenation and peroxidation mechanisms of MPO. MP3+ is ferric myeloperoxidase. RH represents classical organic peroxidation substrates such as tyrosine, ascorbate, and urate. R• is the radical produced upon oxidation of the substrate RH.
MPO is attached to the endothelium (35, 36), and it is present with urate in atherosclerotic lesions (37). Thus, co-localization of urate and MPO suggests they may interact to affect the progression of atherosclerosis. Consequently, we sought to demonstrate whether urate is a likely physiological substrate for MPO and to identify the products that it should produce in vivo.
EXPERIMENTAL PROCEDURES
Materials
Uric acid, glutathione (GSH), bovine liver catalase, 3,3′,5,5′-tetramethylbenzidine, methionine, N-ethylmaleimide, phorbol 12-myristate 13-acetate (PMA), superoxide dismutase, tyrosine, sodium azide, and diphenyliodonium were purchased from Sigma. Isotopically labeled GSH (glycine-1,2-13C2,15N) was purchased from Cambridge Isotope Laboratories. Human leukocyte MPO (EC 1.7.1.11) was purchased from Planta Natural Products (Vienna, Austria). Its purity index (A430/A280) was 0.82, and its concentration was determined using its absorbance at 430 nm (ϵ430, 89,000 m−1 cm−1/heme) (38). Hydrogen peroxide was purchased from Merck, and working solutions were prepared daily. The concentration of hydrogen peroxide was calculated by measuring absorbance at 240 nm (ϵ240, 43.6 m−1 cm−1) (39). To prevent artifactual oxidation of urate, it was dissolved at 10 mm in 40 mm sodium hydroxide containing 100 μm diethylenediaminepentaacetic acid, then immediately diluted to the working concentration (100–400 μm) in phosphate buffer, pH 7.4, and stored in the dark.
Spectral Analyses of the Oxidation of Urate by MPO
Urate (100 μm) was incubated in 50 mm phosphate buffer, pH 7.4, with MPO (100 nm). Reactions were started by addition of 50 μm hydrogen peroxide, and UV absorbance changes were recorded on an Agilent 8453 diode array spectrophotometer. Spectra were recorded every 30 s and are the average of 10 scans collected over 1 s. Urate oxidation was also monitored at 283 nm to determine the rate of loss of urate and at 315 nm to determine the rate of formation of products.
HPLC Analysis of Oxidized Urate
Uric acid (200 μm) was oxidized by MPO (200 nm) and 50 μm hydrogen peroxide in 50 mm phosphate buffer, pH 7.4, at 20–22 °C. Reactions were stopped with catalase (50 μg/ml) and dried under vacuum. The samples were suspended in 20% 10 mm ammonium acetate buffer, pH 6.8, and 80% acetonitrile and centrifuged for 1 min at 10,000 rpm. Urate, allantoin, and other intermediates of the reaction were separated using a Waters 2690 HPLC coupled to a Waters 996 photodiode array detector. The compounds were separated on a hydrophilic interaction liquid chromatography normal phase column (150 × 4.6 mm, 5 μm). The mobile phase consisted of acetonitrile (solvent A) and 10 mm ammonium acetate, pH 6.8 (solvent B). Urate and its products of oxidation were separated using a linear gradient from 20 to 50% solvent B over 15 min. This was maintained up to 25 min. Then it returned to the initial conditions over 1 min with an equilibration time of 10 min. The injection volume was 100 μl. A flow rate of 0.5 ml/min was used. Absorbances were monitored from 210 to 400 nm. The loss of urate and production of allantoin were assessed by integrating the peak areas at 283 and 215 nm, respectively.
Identification of Oxidation Products of Urate by Mass Spectrometry
Urate and its oxidation products were separated using hydrophilic interaction liquid chromatography (particle size 150 × 4.6 mm, 5 μm) using a Surveyor HPLC pump (ThermoCorp., San Jose, CA). The mobile phase and gradient were essentially the same used on the HPLC analyses (see above). The HPLC was coupled to an ion trap mass spectrometer (ThermoFinnigan LCQ Deca XP Plus, Thermo Corp.) equipped with an electrospray ionization source. The mass spectrometer was operated using negative ionization in the full-scan mode (scan range m/z 120–200). Spray voltage was set at 5.0 kV and the capillary temperature at 260 °C, and the sheath gas nitrogen flow was 40 units. Data were also collected using selected ion monitoring of negative ions in Q1 using nitrogen as the collision gas with a dwell time of 200 ms for each species. The [M − H]− ions that were monitored had m/z values of 167 (urate), 183 (5-hydroxyisourate), and 199 (urate hydroperoxide). The electrospray voltage and temperature were 4.5 kV and 500 °C respectively. The declustering potential (V) was −45.
Rate Constant for the Reaction of Urate with MPO Compounds I and II
The kinetic studies were carried out on an Applied Photophysics SX-20MV stopped-flow (Leatherhead, UK) with a xenon arc lamp. Experiments were completed in either single mixing or double mixing mode. Reaction mixtures were followed using either a photomultiplier (single wavelength) or using a photo diode array (spectral changes). Temperature was maintained at 25 °C using a Haake model DC10-K10 refrigerated water circulator thermostat. Single wavelength kinetic traces (428 and 456 nm) were fitted with the SX20 Pro-Data Viewer software (Applied Photophysics, UK). Spectral changes in the region 380–500 nm were analyzed using PC Pro-K global analysis and data simulation software (Applied Photophysics, UK). Further analysis was completed using CKS (Chemical Kinetics Software, IBM Research) and Excel (Microsoft).
Reactions were carried out in 50 mm sodium phosphate buffer, pH 7.0. A 10-fold molar excess of hydrogen peroxide was the minimum concentration required for complete conversion of MPO into compound I (characterized by a 50% hypochromicity in the Soret band). As shown previously (40), the maximum concentration of compound I was found to occur 40 ms after reaction of ferric MPO (1 μm) with H2O2 (10 μm). This observation was checked by a series of double mixing experiments where the reaction mixture was further mixed with phosphate buffer and the delay time for the final mix varied from 20 to 60 ms. Subsequently all double mixing experiments used a delay time of 40 ms. For reduction of compound I by urate, 1 μm ferric MPO was premixed in the aging loop with 10 μm hydrogen peroxide for 40 ms. The compound I was then allowed to react with varying concentrations of urate (5, 10, and 20 μm). Formation of compound II was monitored at 454 nm (41). Two determinations (1000–4000 data points) of kobs, the pseudo-first order rate constant, were performed for each substrate concentration. Second order rate constants were calculated from the slope of the plot of the mean kobs values versus substrate concentration.
The reaction of urate with compound II was studied using the same conditions described above. MPO (1 μm) was pre-mixed with 10 μm hydrogen peroxide for a delay of 40 ms. Urate (0–40 μm) was added to the pre-mixing, and the conversion of compound II back to ferric MPO was monitored in the spectroscopic range 380–500 nm from 20 to 200 s and analyzed by monitoring the decay in absorption at 456 nm.
Effect of Urate on the Chlorination Activity of MPO
MPO activity was determined using a hydrogen peroxide electrode as described previously (42). Reactions were carried out at 25 ± 2 °C in 50 mm phosphate buffer, pH 7.4, with 150 mm sodium chloride, 30 μm hydrogen peroxide, and various concentrations of urate plus 300 μm methionine to scavenge hypochlorous acid. Reactions were started by adding 15 nm MPO. Initial rates were determined by drawing a tangent to the first 10 s of the curve for hydrogen peroxide loss. The maximum initial rate for the loss of hydrogen peroxide was determined in the absence of urate. The concentration of urate that inhibited the initial rate of loss of hydrogen peroxide by 50% (IC50) was calculated by fitting a rectangular hyperbola to the dose-response curve using nonlinear regression.
Detection of Glutathione and Oxidized Glutathione by Mass Spectrometry
Glutathione (1 mm) was incubated with 100 nm MPO and urate (200 μm) or tyrosine (100 μm) in 50 mm of phosphate buffer, pH 7.4. Reactions were started by adding 50 μm hydrogen peroxide. After 40 min, N-ethylmaleimide (1 mm) was added to block the free thiol of unreacted glutathione and afford a stable adduct. Quantification of glutathione and glutathione disulfide was carried out with slight modifications to a previously published method (43). Isotopically labeled forms of glutathione and glutathione disulfide were used as internal standards for accurate quantification. A Thermo Hypercab column (100 × 2.1 mm) was used for chromatographic separation using 100% water (0.5% formic acid) as solvent A and 50% acetonitrile and 50% propan-2-ol (0.1% formic acid) as solvent B. A flow rate of 0.2 ml/min was used, and 20 μl was injected onto the column. Glutathione and its oxidation products were eluted using a linear gradient of 0–20% solvent B over 20 min.
Oxidation of Urate and Formation of Allantoin by Isolated Neutrophils
Blood from healthy individuals was obtained with informed consent and approved by the Upper South A Regional Ethics Committee (New Zealand). Neutrophils were isolated from the blood by Ficoll-Paque centrifugation, dextran sedimentation, and hypotonic lysis of red cells (44). After isolation, neutrophils were resuspended in 10 mm phosphate buffer containing 5 mm potassium chloride and 140 mm sodium chloride (PBS), plus 1 mm calcium chloride, 0.5 mm magnesium chloride, and 1 mg/ml glucose (buffer A). Neutrophils (5 × 10⁶/ml) were then added to plasma to give a final plasma concentration of 75%. Cells were stimulated with a combination of PMA (1 μg/ml) and cytochalasin B (10 μg/ml). Aliquots (100 μl) were immediately withdrawn and added to 1.5-ml microcentrifuge tubes containing nothing, diphenyliodonium (10 μm), azide (1 mm), catalase (100 μg/ml), superoxide dismutase (20 μg/ml), or thiocyanate (1 mm). These cells were maintained at 37 °C with repeated mixing for 30 min. To follow the time course for the production of allantoin, aliquots from the suspension of stimulated neutrophils were removed at set time points. At the end of the reactions, cells were pelleted by centrifugation, and proteins in the resulting supernatants were precipitated by adding four times the volume of cold acetonitrile containing a 15N-stable isotope of allantoin. The samples were then separated by liquid chromatography using a TSK Gel-Amide column (Tosoh, Tokyo, Japan; 150 × 2.0 mm) held at 30 °C with a Luna silica guard cartridge (Phenomenex, Santa Barbara, CA; 4 × 2.00 mm). Eluent A was ammonium acetate (10 mm, pH 6.8), and eluent B was acetonitrile. Initial conditions (10% A) were maintained for 5 min before a linear gradient to 50% A over 5 min was used, maintained at 2 min before returning to starting conditions in 1 min, and re-equilibration. The flow rate was 0.2 ml/min, and the injection volume was 10 μl with samples being maintained at 4 °C in the autosampler. The eluent from the column was introduced into the mass spectrometer without splitting with diversion to waste for the first 4 min. Mass spectrometry analyses were performed using an Applied Biosystems 4000QTrap (Concord, Ontario, Canada). The electrospray needle was held at 400 °C. Nitrogen was both the curtain and collision gas. The ion spray was −4.5 kV, and the declustering potential was 78 V. Quantification of allantoin was by multiple reaction monitoring using negative electrospray ionization mass spectrometry. For unlabeled allantoin, the largest fragment ion generated by collision-induced disassociation of the [M − H]− ion was used for quantification, and a second fragment ion was used for confirmation. For unlabeled allantoin, the m/z transitions were 157 to 114 (quantifier) and 157 to 97 (confirmation). For 15N-labeled allantoin, m/z transition of 159 to 116 was used for quantification. The time allowed for each scan was set to 50 ms. Data acquisition was performed using Analyst 1.4.2.
Oxidation of Urate by MPO in the Presence of Superoxide
Urate was incubated with MPO and 50 mm phosphate buffer, pH 7.4. Xanthine oxidase and acetaldehyde (10 mm) were also included to generate superoxide and hydrogen peroxide. The activity of xanthine oxidase was determined by measuring the rate of superoxide-dependent reduction of cytochrome C (45). Reactions were carried out in the presence and absence of superoxide dismutase (20 μg/ml) and catalase (100 μg/ml). They started by adding acetaldehyde to the reaction mixture and stopped by adding catalase (100 μg/ml). Hydroperoxides were quantified by determining the oxidation of ferrous iron in the presence of xylenol orange (FOX assay) (46, 47). Concentrations of reagents were modified so that 0.7 ml of sample in 50 mm sodium phosphate buffer could be added to 0.25 ml of FOX reagent. The composition of the FOX reagent was xylenol orange (30 mg), ferrous ammonium sulfate (39 mg), and sorbitol (7.3 g) in 100 ml of 0.2 m sulfuric acid. Samples were left at room temperature for at least 45 min before reading absorbances at 560 nm. Concentrations were determined from a standard curve for hydrogen peroxide and calibrated using ϵ240 nm = 43.6 m−1 cm−1 (39), and results are expressed as hydrogen peroxide equivalents.
Consumption of Nitric Oxide by MPO
The NO donor NOC-9 was added to 0.1 m phosphate buffer (pH 7.4, 22 °C, air-saturated) with rapid mixing to achieve a maximal steady-state concentration of 2 μm NO, which was measured continuously with a NO-specific electrode (ISO-NOP) interfaced to an Apollo 4000 free radical analyzer (World Precision Instruments). H2O2 (10 μm) and MPO (10 nm) were added sequentially in the presence and absence of urate or l-tyrosine. The rate of NO consumption was measured 10 s following the addition of MPO.
RESULTS
Oxidation of Urate by MPO and Identification of Reaction Products
The oxidation of urate by MPO and hydrogen peroxide was followed by monitoring the difference spectrum of urate, which showed distinct changes at 215, 240, 283, and 315 nm (Fig. 1A). No spectral changes occurred in the absence of either MPO or hydrogen peroxide (data not shown). Analysis of the reaction mixture by LC/MS using selected ion monitoring revealed the presence 5-hydroxyisourate (supplemental Fig. S1). When the reaction mixture was dried down and analyzed by HPLC, two products were detected (supplemental Fig. S2A), one of which co-eluted with authentic allantoin (data not shown). Identification of these products was confirmed using liquid chromatography with negative electrospray ionization mass spectrometry (LC-ESI-MS). The [M − H]− ion of one product had an m/z ratio of 157 (supplemental Fig. S2B), which is expected for allantoin. The [M − H]− ion of the other product had m/z ratio of 182, which is consistent with the deprotonated form of the imine amine of urate (supplemental Fig S2C). This most likely forms from reaction of ammonia in buffers with the diimine of oxidized urate (48). Urate was observed at the expected m/z ratio 167, which was the main compound that eluted in peak 3 (not shown). Formation of these products is consistent with results of a previous study on peroxidase-dependent oxidation of urate (48).
FIGURE 1.

Oxidation of urate by MPO. A, difference spectra against 100 μm urate after starting its oxidation by the addition of MPO (100 nm) and 50 μm hydrogen peroxide in 50 mm phosphate buffer, pH 7.4. Spectra were recorded at 0.2, 2, 4, 6, 10, and 14 min after starting the reaction. The result is a representative of five independent experiments. B, urate was oxidized by MPO under the conditions described in Fig. 1 except its concentration was varied. The initial rate of product formation was determined by measuring the increase in absorbance at 315 nm over the 1st min of the reaction. The results are expressed as means and ranges of two independent experiments. C, urate (200 μm) was oxidized by MPO (200 nm) and 50 μm hydrogen peroxide in 50 mm phosphate buffer, pH 7.4. The reaction was stopped with catalase (100 μg/ml) at different time points and assayed for the loss of urate (●) and formation of allantoin (○) using HPLC. The results are representative of four independent experiments.
Kinetics and Stoichiometry of Urate Oxidation
The initial rate of oxidation of urate by MPO was dependent on the concentration of urate over its normal physiological range (Fig. 1B). The kinetics and stoichiometry of urate oxidation were also assessed by measuring the loss of urate and formation of allantoin when hydrogen peroxide was initially present at 50 μm (Fig. 1C). There was an initial rapid linear phase of urate oxidation during the first 15 min of the reaction after which the rate declined as the loss of urate approached 50 μm. These kinetics were matched by the formation of allantoin. At the end of the reaction, 53 μm urate was consumed and 29 μm allantoin was produced. These results indicate that there is a 1:1 stoichiometry for the MPO-catalyzed oxidation of urate by hydrogen peroxide and that allantoin is the major stable product accounting for >50% of the urate oxidized.
Spectral Changes of MPO and Rate Constants for Reduction of Compounds I and II
To assess the mechanism by which MPO oxidizes urate, we monitored changes in the absorption spectrum of the enzyme in the presence of urate and hydrogen peroxide (supplemental Fig. S3A). Upon adding hydrogen peroxide to the enzyme, there was an immediate shift of the Soret peak of MPO from 430 to 456 nm, and a small increase in absorbance at 630 nm. These spectral changes are indicative of conversion of the ferric enzyme to compound II (49). In the presence of urate, formation of compound II was transitory such that the spectrum of the ferric enzyme was restored after 4 min. In the absence of urate, compound II was stable for at least 10 min (supplemental Fig. S3B). From this result we conclude MPO oxidizes urate by the classical peroxidation cycle involving sequential one-electron reactions with compounds I and II. During oxidation of urate, MPO would exist predominantly as compound II because this is normally the rate-determining step in enzyme turnover. Once all the hydrogen peroxide was consumed, urate would reduce compound II back to the native ferric enzyme.
To appreciate how likely urate will be oxidized in vivo in the presence of several competing substrates, the rate constants for its reactions with compounds I and II were measured by stopped flow kinetics. As shown previously (40), the maximum concentration of compound I was found to occur 40 ms after reaction of 1 μm ferric MPO with 10 μm H2O2. Compound I was then reacted with urate. The spectral changes indicated rapid conversion of compound I (Soret maximum of 430 nm) to compound II (Soret maximum 456 nm) over 250 ms (Fig. 2A). Urate was varied from 0 to 20 μm (final concentration) to produce pseudo first-order conditions, and kinetic traces were collected at 456 nm to follow the appearance of compound II (Fig. 2B). The observed first order rate constant for formation of compound II showed a linear dependence with respect to the concentration of urate and had a positive intercept on the y axis (Fig. 2C). The line of best fit revealed a slope of 4.6 ± 0.4 × 10⁵ m−1 s−1 and an intercept of 5.8 ± 0.5 s−1. This intercept corresponds to reduction of compound I by reactants other than urate.
FIGURE 2.
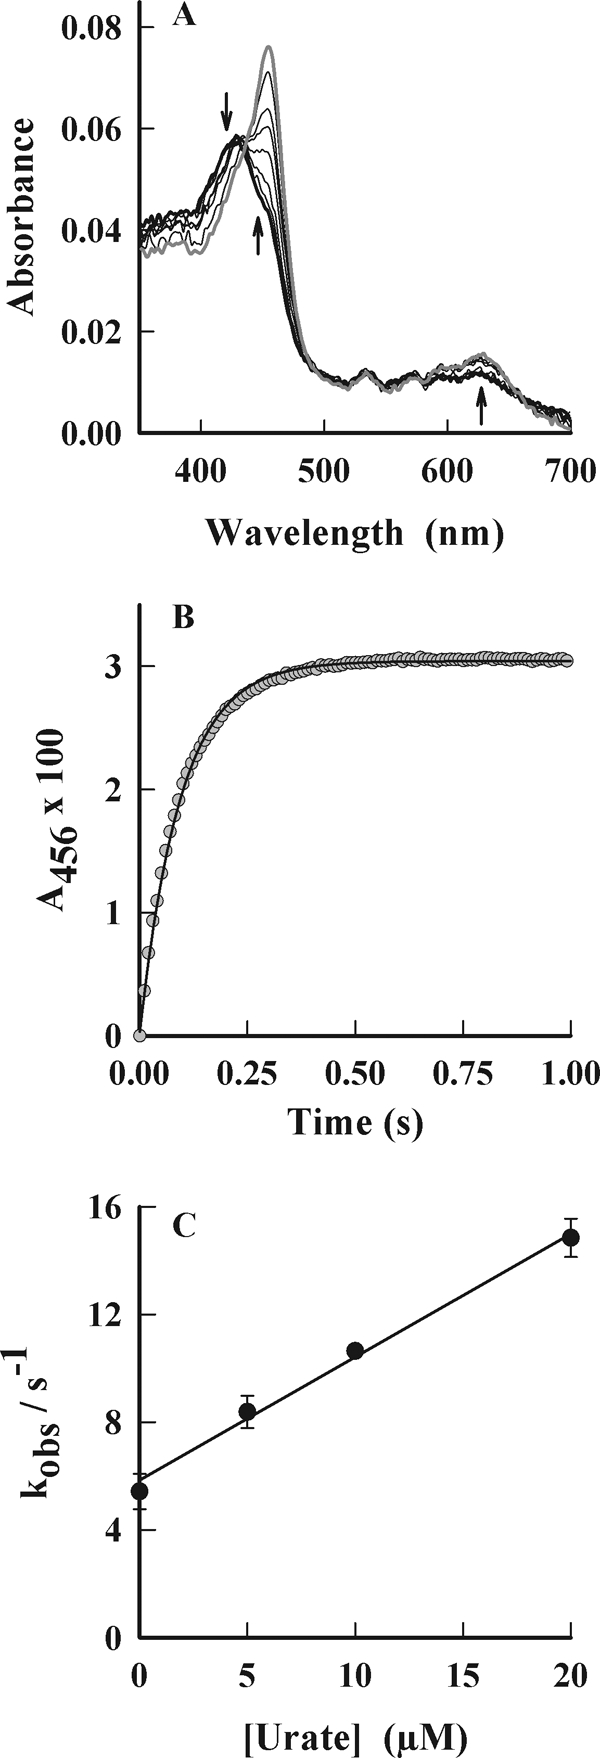
Reaction of urate with compound I of MPO. MPO (1 μm) was pre-mixed with 10 μm hydrogen peroxide in 50 mm phosphate buffer, pH 7.0, at 25 °C to form compound I, which was subsequently reacted with urate. Spectral changes were followed by stopped flow spectrophotometry. A, spectral changes of MPO were followed between 3 ms (thick black spectrum) and 240 ms (gray spectrum) after adding urate (10 μm). Arrows indicate direction of spectral changes. B, conversion of compound I to compound II was monitored at 456 nm, and exponential fits (solid line) were made to these data (gray circles). C, observed rate constants (kobs) obtained from these fits were plotted against the initial concentration of urate. The rate constants are the average of at least triplicate experiments, and the error bars represent standard errors.
The reaction of urate with compound II was studied using the same conditions for compound I but was measured over a longer time scale (20–200 s). Urate promoted the conversion of compound II to the ferric enzyme (Soret maximum 430 nm) (Fig. 3A). The clear isosbestic point at 441 nm suggests that no other intermediates of MPO were involved in this reaction. The decay in absorption of compound II at 456 nm was found to be sigmoidal in shape (Fig. 3B). The final section of the curve represents the reduction of compound II back to the ferric enzyme. It could be fitted by a single exponential decay as described previously (50). The first order rate constants obtained in this way were plotted against the initial concentration of urate (Fig. 3C). The slope of the line provides the second order rate constant for the reaction of urate with compound II to produce ferric MPO and has a value of 1.7 ± 0.1 × 10⁴ m−1 s−1. The intercept corresponds to the spontaneous decay of compound II and was found to have a value of 0.017 s−1.
FIGURE 3.

Reaction of urate with compound II of MPO. MPO (1 μm) was pre-mixed with 10 μm hydrogen peroxide in 50 mm phosphate buffer, pH 7.0, at 25 °C to form compound I, which was subsequently reacted with urate. Spectral changes were followed by stopped flow spectrophotometry. A, spectral changes of MPO were followed between 1 s (thick black spectrum) and 100 s (gray spectrum) after adding urate (10 μm). Arrows indicate direction of spectral changes. B, conversion of compound II to ferric MPO was monitored at 456 nm, and exponential fits (solid line) were made to these data (gray circles). C, observed rate constants (kobs) obtained from these fits were plotted against the initial concentration of urate. The rate constants are the average of at least triplicate experiments, and the error bars represent standard errors.
Chloride and Urate as Competing Substrates for MPO
Chloride is a major physiological substrate for MPO (22). Therefore, we determined how chloride and urate affected each other's oxidation by MPO. The effect of urate on the chlorination activity of MPO was determined by measuring the initial rate of hydrogen peroxide consumption by the enzyme in the presence of 100 mm chloride and varying concentrations of urate (Fig. 4A). Urate decreased the initial rate of hydrogen peroxide consumption markedly, inhibiting by 50% (IC50) at a concentration of only 9.3 μm. However, it inhibited by a maximum of only 75% over the physiological range of urate concentrations. We also measured production of allantoin by MPO and determined how it was affected by chloride. Methionine was included in the buffer to scavenge hypochlorous acid and prevent it from reacting with urate to produce allantoin (51). When 200 μm urate was oxidized by MPO and 50 μm hydrogen peroxide in the absence of chloride, 20 μm allantoin was produced over 1 h (Fig. 4B). Chloride inhibited formation of allantoin in a concentration-dependent manner, having an IC50 of 9.6 mm. In combination, these results establish chloride and urate as competing substrates of MPO. They also indicate that at normal physiological concentrations of chloride and urate, hypochlorous acid would be the major product formed by the enzyme, and urate would be expected to be a minor substrate.
FIGURE 4.

Urate and chloride as competing substrates for MPO. A, effect of urate on the chlorination activity of MPO was determined by monitoring the consumption of hydrogen peroxide with a hydrogen peroxide electrode. Reactions were started by adding MPO (15 nm) to 30 μm hydrogen peroxide in 50 mm phosphate buffer, pH 7.4, containing 150 mm chloride, 1 mm methionine, and varying concentrations of urate at 25 °C. The data are representative of two independent experiments. B, effect of chloride concentration on the production of allantoin when urate (200 μm) was oxidized by MPO (100 nm) and 50 μm hydrogen peroxide in 50 mm phosphate buffer, pH 7.4, containing 200 μm methionine to scavenge HOCl. Reactions were started by adding hydrogen peroxide and stopped after 1 h by adding catalase (100 μg/ml). The concentration of allantoin was determined by HPLC.
Effects of Glutathione on the Oxidation of Urate by MPO
To provide additional evidence that the urate is oxidized by the classical peroxidation cycle to produce radical intermediates, glutathione (GSH) was added to the reaction system. This cysteinyl tripeptide is known to reduce radicals generated by peroxidases and is converted to oxidized glutathione (GSSG) (52). GSH markedly slowed the oxidation of urate as assessed by monitoring the loss in absorbance at 283 nm (supplemental Fig. S4). We also determined whether the oxidation of urate by MPO could promote the consumption of GSH (Fig. 5). With 1 mm GSH, there was a small amount of oxidation of GSH by MPO or urate alone. In combination, urate and MPO promoted super-stoichiometric oxidation of GSH, i.e. with 50 μm hydrogen peroxide, MPO and urate promoted the oxidation of ∼150 μm GSH. Most of the GSH that was oxidized was accounted for by the formation of GSSG. Even greater loss of GSH occurred with tyrosine as the reducing substrate for MPO as found previously (52). This result demonstrates that, like tyrosyl radical, urate radical promotes a chain reaction with GSH, resulting in formation of hydrogen peroxide that fuels further oxidation of GSH.
FIGURE 5.

Oxidation glutathione by MPO. Oxidation of glutathione (1 mm) was determined in a system containing, as indicated, urate (200 μm), tyrosine (100 μm), and/or 200 nm MPO in 50 mm phosphate buffer, pH 7.4. Reactions were started by adding hydrogen peroxide (50 μm). Reactions were stopped after 1 h by adding catalase (20 μg/ml) followed by N-ethylmaleimide (10 mm) to alkylate glutathione and prevent its further oxidation. The samples were then analyzed by LC-ESI-MS/MS for the concentrations of GSH (black bars) that was lost and GSSG formed (gray bars). The data are expressed as mean ± S.E. of four experiments. Statistical analysis was performed by one-way analysis of variance with Duncan's post hoc analysis. Differences from the system containing MPO only were considered significant (asterisk) at p < 0.05.
Oxidation of Urate in the Presence of Superoxide
Urate radicals react with superoxide at diffusion-controlled rates (53). The product of this reaction is not known. Electron transfer from superoxide to urate radical would regenerate urate. Alternatively, addition of superoxide would produce urate hydroperoxide as occurs with tyrosine, serotonin, and melatonin (54–57). To determine whether urate is converted to a hydroperoxide by superoxide, we used MPO to oxidize urate, whereas superoxide and hydrogen peroxide were generated with xanthine oxidase. Hydroperoxides were detected using ferrous iron-catalyzed oxidation of xylenol orange (FOX assay) (46). The complete reaction system generated substantial levels of hydroperoxides (Fig. 6, A and B). Their formation was blocked by omitting one of MPO, urate, xanthine oxidase, or acetaldehyde from the reaction system (Fig. 6A). Superoxide dismutase decreased hydroperoxide formation to control levels, and catalase inhibited by ∼50%. Incomplete inhibition by catalase most likely reflects competition of MPO and catalase for hydrogen peroxide. Production of hydroperoxides increased with increasing concentrations of urate to a maximum at 200 μm urate (Fig. 6B). Superoxide dismutase inhibited hydroperoxide formation at all concentrations of urate indicating the essential role of superoxide in their formation. To confirm that the hydroperoxide detected by the FOX assay was urate hydroperoxide, we used LC/MS with selected ion monitoring to identify [M − H]− ions with an m/z value of 199, i.e. 32 mass units greater than for urate ([M − H]− m/z 167). Two products with the expected mass were detected in the reaction mixture, and their formation was completely blocked by superoxide dismutase (Fig. 6C). These are likely to be isomers of urate hydroperoxide. The hydroperoxide detected by the FOX assay was reactive because it was eliminated by glutathione. In contrast, hydrogen peroxide reacted slowly with glutathione (Fig. 6D).
FIGURE 6.

Formation of a hydroperoxide during oxidation of urate by MPO in the presence of superoxide. A, urate (200 μm) was incubated with MPO (150 nm) and xanthine oxidase (XO) in 50 mm phosphate buffer, pH 7.4. Reactions were started by adding 10 mm acetaldehyde (Acet) and were carried out in the presence or absence of superoxide dismutase (SOD; 20 μg/ml) and catalase (CAT; 100 μg/ml). The flux of superoxide was 6 μm/min. After 20 min, catalase was added (100 μg/ml) to consume hydrogen peroxide, and organic hydroperoxides were quantified by the FOX assay. The amount of hydroperoxide was estimated by comparison with a standard curve for hydrogen peroxide. Results are means and standard deviations of triplicate experiments, which were representative of four independent experiments. Data were analyzed using one-way analysis of variance on ranks, which revealed a significant difference between medians (p = 0.004). Post hoc analysis using the Student-Newman-Keuls method found that all treatments were significantly different from the complete system (*, p < 0.05). B, reactions were performed under similar conditions as described in A but using 300 nm MPO, a flux of 20 μm/min superoxide while varying the concentration of urate in the presence (♦) or absence of superoxide dismutase (●). C, as in A but reactions were run for an hour in the absence (black) or presence of superoxide dismutase (gray) after which they were assayed by LC/MS using selected ion monitoring for [M − H]− ions with m/z values of 199. D, urate hydroperoxide was generated under the conditions described in A and then it and hydrogen peroxide (5 μm) were reacted with 100 μm GSH for 10 min. Residual hydroperoxides were measured by the FOX assay. Data are means and standard deviations of triplicate experiments. Significance was determined by Student's t test.
Urate-dependent Consumption of Nitric Oxide by MPO
MPO can modulate vascular inflammatory responses by oxidizing NO directly or via generation of radical intermediates that react with NO (32, 33). Therefore, we also tested the possibility that urate radicals generated by MPO react with nitric oxide (NO) in a similar fashion to tyrosyl radicals (32, 33). NO was generated by the NO donor NOC-9. The combination of MPO and hydrogen peroxide alone promoted consumption of NO, but this was enhanced by the addition of urate (Fig. 7A). Urate alone and in combination with either MPO (data not shown) or hydrogen peroxide (Fig. 7A) did not promote consumption of NO (data not shown). The consumption of NO was dependent on the concentration of urate over its physiological range (Fig. 7B). Urate was comparable with tyrosine in promoting consumption of NO. From these results, we conclude that urate promotes the NO oxidase activity of MPO.
FIGURE 7.
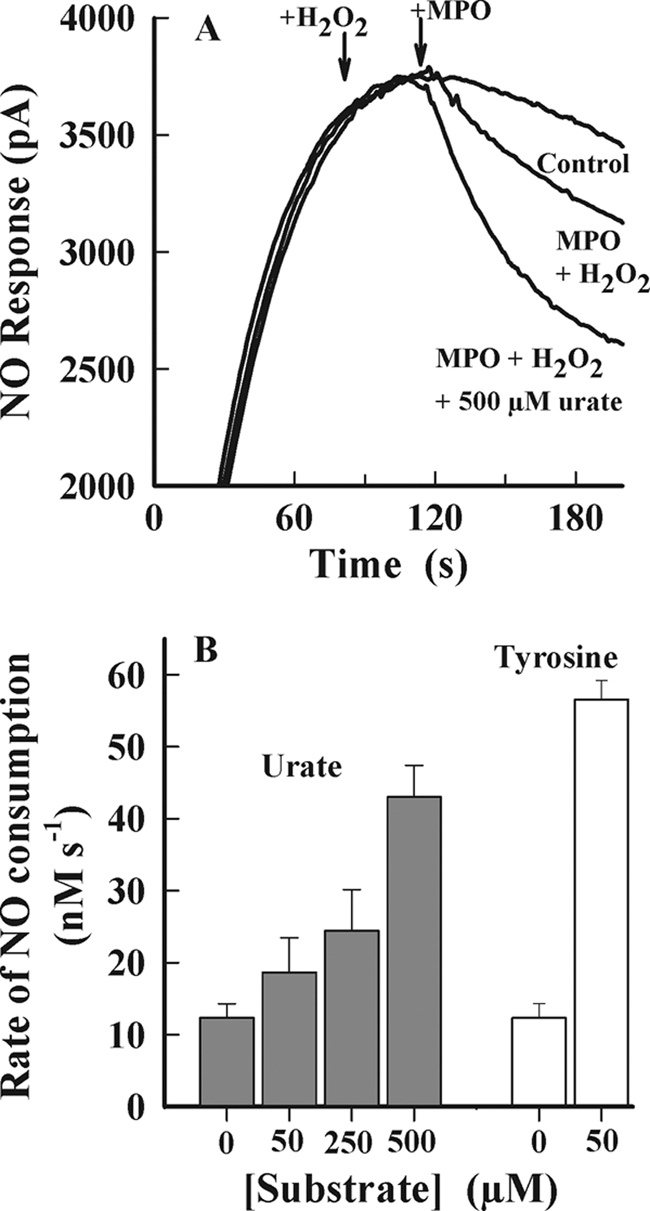
NO consumption by MPO. The NO donor NOC-9 was added to 0.1 m phosphate buffer (pH 7.4, 22 °C, air-saturated) with rapid mixing to achieve a maximal steady-state concentration of 2 μm NO. Hydrogen peroxide (10 μm) and MPO (10 nm) were added sequentially in the presence and absence of urate or l-tyrosine (Tyr). The rate of NO consumption was measured 10 s following the addition of MPO. A, typical NO electrode response traces. B, initial rates of NO consumption following addition of hydrogen peroxide and MPO. Results represent the mean ± S.E. of a minimum of n = 3 independent experiments for all experimental conditions.
Production of Allantoin by Neutrophils in Plasma
To assess the potential for MPO to oxidize urate in vivo, we added isolated neutrophils to plasma. The cells were then stimulated with phorbol myristate acetate in the presence of cytochalasin B to promote degranulation and release of MPO. The formation of allantoin was followed using LC/MS. After a lag of ∼10 min, the concentration of allantoin began to increase over the 1-h incubation period (Fig. 8A). Formation of allantoin required stimulation of the cells and was inhibited by diphenyliodonium, which blocks the activity of the NADPH oxidase (Fig. 8B). Allantoin formation was also retarded by the heme poison azide as well as catalase and thiocyanate, which is a substrate for MPO. Superoxide dismutase inhibited formation of allantoin, which indicates that superoxide was involved in the oxidation of urate. Collectively, these results demonstrate that activated neutrophils oxidize urate in plasma in reactions that involve the NADPH oxidase, MPO and superoxide.
FIGURE 8.

Production of allantoin by neutrophils in plasma. A, neutrophils (5 × 10⁶/ml) were suspended in a solution of 75% plasma and 25% PBS at 37 °C. Cells were stimulated with PMA (1 μg/ml) and cytochalasin B (10 μg/ml), and the production of allantoin was monitored over time using LC/MS/MS. Results are means and ranges of duplicates and representative of three independent experiments. B, effect of inhibitors on the production of allantoin after 30 min of stimulation in the presence 10 μm diphenylene iodonium, 1 mm azide, 100 μg/ml catalase, 20 μg/ml superoxide dismutase (SOD), or 1 mm thiocyanate (SCN). Data are means and standard deviations of four experiments for ±PMA and two for the inhibitors. Results are representative of data obtained on three separate occasions. All treatments were significantly different (p < 0.05) to the +PMA control using analysis of variance with Holm-Sidak post hoc analysis.
DISCUSSION
We have demonstrated that urate should be considered as a physiological substrate for MPO that competes with chloride for oxidation and is converted to urate radicals. The fate of these radicals has considerable potential to influence oxidative stress during inflammation. Reaction with superoxide will produce a hydroperoxide, which will propagate oxidative reactions of both the constituent radicals. Reaction with NO will decrease the availability of this vasodilator and increase hypertension and endothelial dysfunction (58). When scavenged by thiols, such as glutathione and cysteine, urate radicals will promote chain reactions and also exacerbate oxidative stress. Even their dismutation to dehydrourate may be harmful because this species hydrolyzes to 5-hydroxyisourate (Scheme 2). This metabolite, which was produced by MPO, has recently been shown to be associated with development of liver tumors in mice (59). Adverse reactions of urate radicals will be kept in check only when ascorbate is available at sufficient concentrations to reduce them back to urate (60, 61). Given the associations of both urate and MPO with numerous inflammatory diseases and their co-localization, our work indicates that interactions between the two should be considered when assessing the role of either in inflammation.
SCHEME 2.

Oxidation of urate to produce urate radical, 5-hydroxyisourate, urate hydroperoxide, nitrosourate, and allantoin. Straight arrows represent direct reactions, and dashed arrows represent indirect breakdown pathways. The structures for the hydroperoxide and NO adduct are proposals only and remain to be characterized.
Two previous studies have identified urate as a substrate for MPO. Originally, MPO was shown to oxidize urate to allantoin (19), and it was found that urate reacts favorably with compound II (62). Until our current work, however, the potential of urate to act as a physiological substrate for MPO had not been addressed. MPO is an unusual enzyme in that it oxidizes numerous substrates via a variety of mechanisms (22). In vivo, its dominant activity is the two-electron oxidation of chloride and thiocyanate (63). Bromide is also oxidized by this route in vivo (64). These substrates reduce compound I of MPO to produce the respective hypohalous acids and regenerate the native ferric enzyme (Scheme 1). MPO also acts as a classical peroxidase where the substrate reduces compound I to compound II, which is in turn reduced back to the native ferric enzyme (Scheme 1). Each step involves a one-electron reduction of the enzyme intermediates and is accompanied by the liberation of a substrate free radical. Peroxidation substrates include ascorbate, tyrosine, and serotonin as well as exogenous phenolics and aromatic amines (56, 65–67). Collectively, our results indicate that urate is also oxidized by the classical peroxidase cycle shown in Scheme 1, i.e. compound II was the redox intermediate of the enzyme present during oxidation of urate, and urate readily reduced compounds I and II. Also, oxidation of urate promoted super-stoichiometric oxidation of GSH in a similar fashion to tyrosine. The urate and tyrosyl radical would oxidize glutathione to a radical, which then undergoes a chain reaction in which oxygen is consumed and reduced to hydrogen peroxide via the intermediate formation of superoxide (52, 68). In support of our proposal, others have shown that peroxidases oxidize urate to a radical intermediate (69).
The pertinent question regarding the potential of urate to be a physiological substrate for MPO is how will it affect the chlorination activity of the enzyme? The rate constant we measured for reaction of urate with compound I (k = 4.6 × 10⁵ m−1 s−1) demonstrates that it will compete only moderately with chloride (k = 2.5 × 10⁴ m−1 s−1) (70) at physiological concentrations of both substrates. For example, at normal physiological concentrations of 200 μm urate and 140 mm chloride, ∼3% of compound I will oxidize urate at each enzyme cycle. This estimate is supported by our finding that MPO converted only a small proportion of urate to allantoin in the presence of chloride. As the concentration of urate in plasma rises, however, urate will compete more effectively with chloride. The maximum solubility of urate in plasma has been determined to be 940 ± 345 μm (n = 31) (71). At this level, around 10% of the hydrogen peroxide used by MPO would produce urate radicals. Thus, in hyperuricemia, hypochlorous acid will remain as the major product of MPO, but urate radicals will also be produced in substantial amounts.
Although urate competed modestly with chloride for oxidation by compound I, we found that it was very effective at slowing the rate at which MPO used hydrogen peroxide. This occurred because urate converted the enzyme to compound II. When the enzyme has good one- and two-electron substrates available, reduction of compound II determines the rate at which the enzyme uses hydrogen peroxide because this is the rate-determining step during turnover of the enzyme (Scheme 1). This situation will occur in vivo where the enzyme will encounter a plethora of one- and two-electron donors (22). The organic substrates plus superoxide will also be in competition for oxidation by compound II. Rate constants for reduction of compounds I and II by ascorbate (1.1 × 10⁶ and 1.1 × 10⁴ m−1 s−1) (72), tyrosine (7.7 × 10⁵ 1.6 × 10⁴ m−1 s−1) (66), tryptophan (2.0 × 10⁶ and 12 m−1 s−1) (73), serotonin (2.0 × 10⁷ and 1.1 × 10⁶ m−1 s−1) (74), and superoxide (5.0 × 10⁶ and 1.0 × 10⁶ m−1 s−1) (75) indicate that under most situations urate (4.6 × 10⁵ and 1.7 × 10⁴ m−1 s−1) will be a major organic substrate at physiological concentrations for both compounds I and II. In hyperuricemic individuals, urate will be the dominant organic substrate for MPO. Its reduction of compound II will determine the rate at which MPO turns over and produces both hypohalous acids and urate radicals.
The urate radical has several possible fates. It can be reduced back to urate by ascorbate or GSH, dismutate to form dehydrourate, or react with superoxide and nitric oxide (Scheme 2). Superoxide reacts rapidly with urate radical (k = 2 × 10⁸ m−1 s−1) (53). Our data indicate that this reaction involves addition of superoxide to produce a hydroperoxide. We showed that a hydroperoxide was detected by the FOX assay, and we identified products that were 32 mass units larger than urate. Both of these species formed only in the presence of superoxide. Our data do not exclude the possibility that electron transfer from superoxide also occurs to reform urate. Urate hydroperoxide is likely to exacerbate inflammatory tissue damage and is a possible culprit for the oxygen-dependent inactivation of alcohol dehydrogenase by urate radicals (9). Indeed, it was much more reactive with GSH than hydrogen peroxide. Hence, MPO can use relatively unreactive hydrogen peroxide and superoxide to convert an antioxidant into a pro-oxidant. This finding provides additional support for the proposal that superoxide toxicity results from its propensity to react with organic radicals to form hydroperoxides (76).
Previously, it was shown that stimulated neutrophils oxidize urate in plasma once ascorbate is depleted (60). Under essentially the same conditions, we found that neutrophils produced allantoin in plasma after an initial lag phase. Our results for production of allantoin are virtually a mirror image of those for loss of urate reported by Frei et al. (60). Formation of allantoin required MPO, superoxide, and hydrogen peroxide. These results confirm that MPO oxidizes urate in plasma to produce allantoin as a final stable product. The reliance of allantoin formation on superoxide suggests that urate radicals readily react with superoxide in plasma to form the hydroperoxide. In the absence of superoxide, they must be predominantly reduced back to urate. In the presence of adequate ascorbate, urate radicals are likely to be benign because they will be readily reduced. At sites of excess oxidative stress, however, this situation will change as ascorbate becomes depleted. Urate radicals will then promote detrimental oxidative reactions.
Our data unequivocally showed that urate enhances the consumption of NO by MPO. As proposed previously for tyrosine and ascorbate, this is likely to involve reaction of NO with urate radical (32, 33). Urate was as effective as tyrosine at promoting the consumption of NO. Hence, urate will be a major co-substrate for the MPO-dependent scavenging of NO in vivo that will promote hypertension by depleting NO levels (33). The concentration of these various substrates in the subendothelial space, where MPO accumulates during inflammatory vascular disease, is not known and warrants investigation.
In recent times, a flurry of studies and reviews have highlighted the association between hyperuricemia and cardiovascular disease (77–79). Explanations for this association include a concomitant increased production of oxidants along with urate by xanthine oxidase, activation of neutrophils by urate crystals, and more recently that urate activates the inflammasome (80) and is a danger signal that regulates inflammation (12). We propose that oxidation of urate by MPO to form radicals that intercept superoxide and NO provides an equally plausible mechanism for the adverse cardiovascular effects experienced by individuals with hyperuricemia. A corollary of our work is that the assumption that allantoin formation in humans arises principally from the antioxidant action of urate may require revision (81). Our results indicate that urate is a physiological peroxidase substrate, and it should not necessarily be considered the end product of purine metabolism in humans. Hence, elevated allantoin levels may reflect peroxidase activity rather than nonspecific scavenging of oxidants by urate.
Acknowledgments
We thank Dr. Anna Chapman and Dr. Peter Nagy for technical support.
This work was supported by Conselho Nacional de Desenvolvimento Cientifico e Tecnologico (CNPq-Brazil), the Health Research Council of New Zealand, and the New Zealand Centre of Excellence for Growth and Development and in part by National Health and Medical Research Council Project Grant 568721 (to S. R. T. and A. J. K.).

The on-line version of this article (available at http://www.jbc.org) contains supplemental Figs. S1–S4.
- MPO
- myeloperoxidase
- PMA
- phorbol 12-myristate 13-acetate.
REFERENCES
- 1. Simic M. G., Jovanovic S. V. (1989) J. Am. Chem. Soc. 111, 5778–5782 [Google Scholar]
- 2. Becker B. F. (1993) Free Radic. Biol. Med. 14, 615–631 [DOI] [PubMed] [Google Scholar]
- 3. Ames B. N., Cathcart R., Schwiers E., Hochstein P. (1981) Proc. Natl. Acad. Sci. U.S.A. 78, 6858–6862 [DOI] [PMC free article] [PubMed] [Google Scholar]
- 4. Kutzing M. K., Firestein B. L. (2008) J. Pharmacol. Exp. Ther. 324, 1–7 [DOI] [PubMed] [Google Scholar]
- 5. Bowry V. W., Stocker R. (1993) J. Am. Chem. Soc. 115, 6029–6044 [Google Scholar]
- 6. Santos C. X., Anjos E. I., Augusto O. (1999) Arch. Biochem. Biophys. 372, 285–294 [DOI] [PubMed] [Google Scholar]
- 7. Filipe P., Haigle J., Freitas J., Fernandes A., Mazière J. C., Mazière C., Santus R., Morlière P. (2002) Eur. J. Biochem. 269, 5474–5483 [DOI] [PubMed] [Google Scholar]
- 8. Aruoma O. I., Halliwell B. (1989) FEBS Lett. 244, 76–80 [DOI] [PubMed] [Google Scholar]
- 9. Kittridge K. J., Willson R. L. (1984) FEBS Lett. 170, 162–164 [DOI] [PubMed] [Google Scholar]
- 10. Martinon F., Pétrilli V., Mayor A., Tardivel A., Tschopp J. (2006) Nature 440, 237–241 [DOI] [PubMed] [Google Scholar]
- 11. Martinon F. (2010) Immunol. Rev. 233, 218–232 [DOI] [PubMed] [Google Scholar]
- 12. Kono H., Chen C. J., Ontiveros F., Rock K. L. (2010) J. Clin. Invest. 120, 1939–1949 [DOI] [PMC free article] [PubMed] [Google Scholar]
- 13. Shi Y. (2010) J. Clin. Invest. 120, 1809–1811 [DOI] [PMC free article] [PubMed] [Google Scholar]
- 14. Benzie I. F., Strain J. J. (1996) Redox Rep. 2, 231–234 [DOI] [PubMed] [Google Scholar]
- 15. Alderman M. H. (2007) Circulation 116, 880–883 [DOI] [PubMed] [Google Scholar]
- 16. Nakagawa T., Kang D. H., Feig D., Sanchez-Lozada L. G., Srinivas T. R., Sautin Y., Ejaz A. A., Segal M., Johnson R. J. (2006) Kidney Int. 69, 1722–1725 [DOI] [PubMed] [Google Scholar]
- 17. Viazzi F., Parodi D., Leoncini G., Parodi A., Falqui V., Ratto E., Vettoretti S., Bezante G. P., Del Sette M., Deferrari G., Pontremoli R. (2005) Hypertension 45, 991–996 [DOI] [PubMed] [Google Scholar]
- 18. So A., Thorens B. (2010) J. Clin. Invest. 120, 1791–1799 [DOI] [PMC free article] [PubMed] [Google Scholar]
- 19. Canellakis E. S., Tuttle A. L., Cohen P. P. (1955) J. Biol. Chem. 213, 397–404 [PubMed] [Google Scholar]
- 20. Klebanoff S. J. (2005) J. Leukocyte Biol. 77, 598–625 [DOI] [PubMed] [Google Scholar]
- 21. Klebanoff S. J. (1968) J. Bacteriol. 95, 2131–2138 [DOI] [PMC free article] [PubMed] [Google Scholar]
- 22. Kettle A. J., Winterbourn C. C. (1997) Redox Rep. 3, 3–15 [DOI] [PubMed] [Google Scholar]
- 23. Nicholls S. J., Hazen S. L. (2005) Arterioscler. Thromb. Vasc. Biol. 25, 1102–1111 [DOI] [PubMed] [Google Scholar]
- 24. Meuwese M. C., Stroes E. S., Hazen S. L., van Miert J. N., Kuivenhoven J. A., Schaub R. G., Wareham N. J., Luben R., Kastelein J. J., Khaw K. T., Boekholdt S. M. (2007) J. Am. Coll. Cardiol. 50, 159–165 [DOI] [PubMed] [Google Scholar]
- 25. Brennan M. L., Penn M. S., Van Lente F., Nambi V., Shishehbor M. H., Aviles R. J., Goormastic M., Pepoy M. L., McErlean E. S., Topol E. J., Nissen S. E., Hazen S. L. (2003) N. Engl. J. Med. 349, 1595–1604 [DOI] [PubMed] [Google Scholar]
- 26. Mocatta T. J., Pilbrow A. P., Cameron V. A., Senthilmohan R., Frampton C. M., Richards A. M., Winterbourn C. C. (2007) J. Am. Coll. Cardiol. 49, 1993–2000 [DOI] [PubMed] [Google Scholar]
- 27. Hazell L. J., Stocker R. (1993) Biochem. J. 290, 165–172 [DOI] [PMC free article] [PubMed] [Google Scholar]
- 28. Zheng L., Nukuna B., Brennan M. L., Sun M., Goormastic M., Settle M., Schmitt D., Fu X., Thomson L., Fox P. L., Ischiropoulos H., Smith J. D., Kinter M., Hazen S. L. (2004) J. Clin. Invest. 114, 529–541 [DOI] [PMC free article] [PubMed] [Google Scholar]
- 29. Shao B., Oda M. N., Bergt C., Fu X., Green P. S., Brot N., Oram J. F., Heinecke J. W. (2006) J. Biol. Chem. 281, 9001–9004 [DOI] [PubMed] [Google Scholar]
- 30. Zhang C., Patel R., Eiserich J. P., Zhou F., Kelpke S., Ma W., Parks D. A., Darley-Usmar V., White C. R. (2001) Am. J. Physiol. Heart Circ. Physiol. 281, H1469–H1475 [DOI] [PubMed] [Google Scholar]
- 31. Vita J. A., Brennan M. L., Gokce N., Mann S. A., Goormastic M., Shishehbor M. H., Penn M. S., Keaney J. F., Jr., Hazen S. L. (2004) Circulation 110, 1134–1139 [DOI] [PMC free article] [PubMed] [Google Scholar]
- 32. Abu-Soud H. M., Hazen S. L. (2000) J. Biol. Chem. 275, 37524–37532 [DOI] [PubMed] [Google Scholar]
- 33. Eiserich J. P., Baldus S., Brennan M. L., Ma W., Zhang C., Tousson A., Castro L., Lusis A. J., Nauseef W. M., White C. R., Freeman B. A. (2002) Science 296, 2391–2394 [DOI] [PubMed] [Google Scholar]
- 34. Sugiyama S., Okada Y., Sukhova G. K., Virmani R., Heinecke J. W., Libby P. (2001) Am. J. Pathol. 158, 879–891 [DOI] [PMC free article] [PubMed] [Google Scholar]
- 35. Baldus S., Rudolph V., Roiss M., Ito W. D., Rudolph T. K., Eiserich J. P., Sydow K., Lau D., Szöcs K., Klinke A., Kubala L., Berglund L., Schrepfer S., Deuse T., Haddad M., Risius T., Klemm H., Reichenspurner H. C., Meinertz T., Heitzer T. (2006) Circulation 113, 1871–1878 [DOI] [PubMed] [Google Scholar]
- 36. Marshall C. J., Nallaratnam M., Mocatta T., Smyth D., Richards M., Elliott J. M., Blake J., Winterbourn C. C., Kettle A. J., McClean D. R. (2010) Am. J. Cardiol. 106, 316–322 [DOI] [PubMed] [Google Scholar]
- 37. Stocker R., Keaney J. F., Jr. (2004) Physiol. Rev. 84, 1381–1478 [DOI] [PubMed] [Google Scholar]
- 38. Agner K. (1941) Acta Physiol. Scand. 2, Suppl. 8, 1–64 [Google Scholar]
- 39. Beers R. J., Jr., Sizer I. W. (1952) J. Biol. Chem. 195, 133–140 [PubMed] [Google Scholar]
- 40. Allegra M., Furtmüller P. G., Regelsberger G., Turco-Liveri M. L., Tesoriere L., Perretti M., Livrea M. A., Obinger C. (2001) Biochem. Biophys. Res. Commun. 282, 380–386 [DOI] [PubMed] [Google Scholar]
- 41. Marquez L. A., Dunford H. B. (1994) J. Biol. Chem. 269, 7950–7956 [PubMed] [Google Scholar]
- 42. Kettle A. J., Winterbourn C. C. (1989) Biochem. J. 263, 823–828 [DOI] [PMC free article] [PubMed] [Google Scholar]
- 43. Harwood D. T., Kettle A. J., Winterbourn C. C. (2006) Biochem. J. 399, 161–168 [DOI] [PMC free article] [PubMed] [Google Scholar]
- 44. Kettle A. J. (1999) Methods Enzymol. 300, 111–120 [DOI] [PubMed] [Google Scholar]
- 45. Fridovich I. (1985) in Handbook of Methods for Oxygen Radical Research (Greenwald R. A. ed) pp. 51–53, CRC Press Inc., Boca Raton, FL [Google Scholar]
- 46. Wolff S. P. (1994) Methods Enzymol. 233, 182–189 [DOI] [PubMed] [Google Scholar]
- 47. Winterbourn C. C., Parsons-Mair H. N., Gebicki S., Gebicki J. M., Davies M. J. (2004) Biochem. J. 381, 241–248 [DOI] [PMC free article] [PubMed] [Google Scholar]
- 48. Volk K. J., Yost R. A., Brajter-Toth A. (1990) J. Pharm. Biomed. Anal. 8, 205–215 [DOI] [PubMed] [Google Scholar]
- 49. Hoogland H., van Kuilenburg A., van Riel C., Muijsers A. O., Wever R. (1987) Biochim. Biophys. Acta 916, 76–82 [DOI] [PubMed] [Google Scholar]
- 50. Marquez L. A., Dunford H. B. (1990) J. Biol. Chem. 265, 6074–6078 [PubMed] [Google Scholar]
- 51. Kaur H., Halliwell B. (1990) Chem. Biol. Interact. 73, 235–247 [DOI] [PubMed] [Google Scholar]
- 52. Pichorner H., Metodiewa D., Winterbourn C. C. (1995) Arch. Biochem. Biophys. 323, 429–437 [DOI] [PubMed] [Google Scholar]
- 53. Santus R., Patterson L. K., Filipe P., Morlière P., Hug G. L., Fernandes A., Mazière J. C. (2001) Free Radic. Res. 35, 129–136 [DOI] [PubMed] [Google Scholar]
- 54. Nagy P., Kettle A. J., Winterbourn C. C. (2009) J. Biol. Chem. 284, 14723–14733 [DOI] [PMC free article] [PubMed] [Google Scholar]
- 55. Das A. B., Nagy P., Abbott H. F., Winterbourn C. C., Kettle A. J. (2010) Free Radic. Biol. Med. 48, 1540–1547 [DOI] [PubMed] [Google Scholar]
- 56. Ximenes V. F., Maghzal G. J., Turner R., Kato Y., Winterbourn C. C., Kettle A. J. (2010) Biochem. J. 425, 285–293 [DOI] [PubMed] [Google Scholar]
- 57. Ximenes V. F., Silva S. O., Rodrigues M. R., Catalani L. H., Maghzal G. J., Kettle A. J., Campa A. (2005) J. Biol. Chem. 280, 38160–38169 [DOI] [PubMed] [Google Scholar]
- 58. Hare J. M., Stamler J. S. (2005) J. Clin. Invest. 115, 509–517 [DOI] [PMC free article] [PubMed] [Google Scholar]
- 59. Stevenson W. S., Hyland C. D., Zhang J. G., Morgan P. O., Willson T. A., Gill A., Hilton A. A., Viney E. M., Bahlo M., Masters S. L., Hennebry S., Richardson S. J., Nicola N. A., Metcalf D., Hilton D. J., Roberts A. W., Alexander W. S. (2010) Proc. Natl. Acad. Sci. U.S.A. 107, 16625–16630 [DOI] [PMC free article] [PubMed] [Google Scholar]
- 60. Frei B., Stocker R., Ames B. N. (1988) Proc. Natl. Acad. Sci. U.S.A. 85, 9748–9752 [DOI] [PMC free article] [PubMed] [Google Scholar]
- 61. Buettner G. R. (1993) Arch. Biochem. Biophys. 300, 535–543 [DOI] [PubMed] [Google Scholar]
- 62. Kettle A. J., Winterbourn C. C. (1988) Biochem. J. 252, 529–536 [DOI] [PMC free article] [PubMed] [Google Scholar]
- 63. van Dalen C. J., Whitehouse M. W., Winterbourn C. C., Kettle A. J. (1997) Biochem. J. 327, 487–492 [DOI] [PMC free article] [PubMed] [Google Scholar]
- 64. Chapman A. L., Skaff O., Senthilmohan R., Kettle A. J., Davies M. J. (2009) Biochem. J. 417, 773–781 [DOI] [PubMed] [Google Scholar]
- 65. Marquez L. A., Dunford H. B., Van Wart H. (1990) J. Biol. Chem. 265, 5666–5670 [PubMed] [Google Scholar]
- 66. Marquez L. A., Dunford H. B. (1995) J. Biol. Chem. 270, 30434–30440 [DOI] [PubMed] [Google Scholar]
- 67. Meotti F. C., Senthilmohan R., Harwood D. T., Missau F. C., Pizzolatti M. G., Kettle A. J. (2008) Free Radic. Biol. Med. 44, 109–120 [DOI] [PubMed] [Google Scholar]
- 68. Munday R., Winterbourn C. C. (1989) Biochem. Pharmacol. 38, 4349–4352 [DOI] [PubMed] [Google Scholar]
- 69. Maples K. R., Mason R. P. (1988) J. Biol. Chem. 263, 1709–1712 [PubMed] [Google Scholar]
- 70. Furtmüller P. G., Burner U., Obinger C. (1998) Biochemistry 37, 17923–17930 [DOI] [PubMed] [Google Scholar]
- 71. Dorner R. W., Weiss T. D., Baldassare A. R., Moore T. L., Zuckner J. (1981) Ann. Rheum. Dis. 40, 70–74 [DOI] [PMC free article] [PubMed] [Google Scholar]
- 72. Hsuanyu Y., Dunford H. B. (1999) Arch. Biochem. Biophys. 368, 413–420 [DOI] [PubMed] [Google Scholar]
- 73. Kettle A. J., Candaeis L. P. (2000) Redox Rep. 5, 179–184 [DOI] [PubMed] [Google Scholar]
- 74. Dunford H. B., Hsuanyu Y. (1999) Biochem. Cell Biol. 77, 449–457 [PubMed] [Google Scholar]
- 75. Kettle A. J., Anderson R. F., Hampton M. B., Winterbourn C. C. (2007) Biochemistry 46, 4888–4897 [DOI] [PubMed] [Google Scholar]
- 76. Winterbourn C. C., Kettle A. J. (2003) Biochem. Biophys. Res. Commun. 305, 729–736 [DOI] [PubMed] [Google Scholar]
- 77. Kim S. Y., Guevara J. P., Kim K. M., Choi H. K., Heitjan D. F., Albert D. A. (2010) Arthritis Care Res. 62, 170–180 [DOI] [PMC free article] [PubMed] [Google Scholar]
- 78. Gaffo A. L., Edwards N. L., Saag K. G. (2009) Arthritis Res. Ther. 11, 240. [DOI] [PMC free article] [PubMed] [Google Scholar]
- 79. Feig D. I., Kang D. H., Johnson R. J. (2008) N. Engl. J. Med. 359, 1811–1821 [DOI] [PMC free article] [PubMed] [Google Scholar]
- 80. Ogura Y., Sutterwala F. S., Flavell R. A. (2006) Cell 126, 659–662 [DOI] [PubMed] [Google Scholar]
- 81. Grootveld M., Halliwell B. (1987) Biochem. J. 243, 803–808 [DOI] [PMC free article] [PubMed] [Google Scholar]