Abstract
Nephrin, the key molecule of the glomerular slit diaphragm, is expressed on the surface of podocytes and is critical in preventing albuminuria. In diabetes, hyperglycemia leads to the loss of surface expression of nephrin and causes albuminuria. Here, we report a mechanism that can explain this phenomenon: hyperglycemia directly enhances the rate of nephrin endocytosis via regulation of the β-arrestin2-nephrin interaction by PKCα. We identified PKCα and protein interacting with c kinase-1 (PICK1) as nephrin-binding proteins. Hyperglycemia induced up-regulation of PKCα and led to the formation of a complex of nephrin, PKCα, PICK1, and β-arrestin2 in vitro and in vivo. Binding of β-arrestin2 to the nephrin intracellular domain depended on phosphorylation of nephrin threonine residues 1120 and 1125 by PKCα. Further, cellular knockdown of PKCα and/or PICK1 attenuated the nephrin–β-arrestin2 interaction and abrogated the amplifying effect of high blood glucose on nephrin endocytosis. In C57BL/6 mice, hyperglycemia over 24 h caused a significant increase in urinary albumin excretion, supporting the concept of the rapid impact of hyperglycemia on glomerular permselectivity. In summary, we have provided a molecular model of hyperglycemia-induced nephrin endocytosis and subsequent proteinuria and highlighted PKCα and PICK1 as promising therapeutic targets for diabetic nephropathy.
Keywords: Diabetes, Endocytosis, Kidney, Protein Kinase C (PKC), Protein Phosphorylation, Arrestin, Nephrin, Podocyte, Proteinuria, Slit Diaphragm
Introduction
Diabetes mellitus is a major health problem in Western countries. Despite therapeutic advances, diabetic nephropathy remains the leading cause of end stage renal disease (1). Chronic hyperglycemia causes glomerular damages such as endothelial dysfunction, loss of negative charges in the basement membrane, and podocyte damage (2). Microalbuminuria is an early symptom of a “leaky” glomerular barrier and is associated with a markedly increased cardiovascular risk (3).
Podocytes are visceral epithelial cells wrapped around glomerular capillaries and are connected by the slit diaphragm. This specialized cell junction is a dynamic multiprotein complex that functions as a size-selective sieve to prevent the loss of plasma proteins through urine (4, 5). Nephrin serves as the backbone of this diaphragm by functioning as a regulator of podocyte signaling and mediator of actin dynamics (6–8). Several podocyte signaling abnormalities have been noted in diabetes. For example, mice and humans with diabetes show altered distribution and expression of nephrin (9–11), and hyperglycemia increases diacylglycerol generation, causing PKC activation (2). However, it is not fully understood how “hyperglycemic” signaling in diabetes affects the expression and distribution of nephrin.
Menne et al. (12) reported a major step elucidating podocyte signaling in diabetes: they showed that albuminuria does not develop in diabetic PKCα-deficient mice and concluded that decreased nephrin expression in diabetes is a result of altered transcriptional regulation. All of the studies until now were conducted in chronic models of diabetes (13). Therefore, their conclusions were based on the changes occurring in long term hyperglycemia. However, considering the highly dynamic structure of the slit diaphragm, we hypothesized that elevated blood glucose levels have an immediate impact on the molecular composition of the slit diaphragm. Our hypothesis is supported by the recent study of Axelsson et al. (14), who demonstrated that acute hyperglycemia impairs glomerular permselectivity in previously normoglycemic rats. Therefore, nephrin might be involved in the changes in glomerular permeability induced by high blood glucose levels.
We have recently demonstrated that nephrin endocytosis occurs in a β-arrestin2-dependent manner (15). Regulation of highly dynamic protein complexes such as the slit diaphragm typically involves changes in their phosphorylation pattern (16). However, the kinase mediating the binding of β-arrestin2 to nephrin has not yet been identified. Studies have evidenced that β-arrestin2 binding is regulated by serine/threonine phosphorylation of its target proteins (17, 18). In our efforts to identify candidate kinases, sequence analysis of the nephrin C terminus revealed a PKC consensus site within the β-arrestin2 interaction motif. The available evidence on PKC signaling in diabetes and the presence of the PKC consensus site in close proximity to the β-arrestin2 interaction motif support our hypothesis that hyperglycemia influences nephrin endocytosis via PKC signaling. In the present study, we examined the role of PKC in β-arrestin2-mediated nephrin endocytosis and its effect on the slit diaphragm integrity in vitro and in vivo to elucidate the mechanism underlying the loss of surface nephrin and subsequent albuminuria upon hyperglycemia in diabetes mellitus.
EXPERIMENTAL PROCEDURES
Reagents
All of the reagents were purchased from Sigma-Aldrich unless stated otherwise. PKC inhibitors (safingol and calphostin C) were obtained from Calbiochem (Merck). siRNA and transfection reagents (Dharmacon) were purchased from Thermo Scientific (Bonn, Germany).
Plasmids
Human nephrin cDNA, as described previously (19), was kindly gifted by Dr. Gerd Walz (University of Freiburg, Freiburg, Germany). C-terminal FLAG-tagged β-arrestin2 was a generous gift from Dr. Robert Lefkowitz (Duke University, Durham, NC). Membrane-bound fusion proteins of the C-terminal cytoplasmic domains of nephrin were generated by using a pCDM8 cassette that contained the leader sequence of CD5 fused to the CH2 and CH3 domains of human IgG1 followed by the transmembrane region of CD7 (20). Dr. Jae-Won Soh (Inha University, Incheon, Korea) provided the expression plasmid of PKCα, and Dr. Lindsay Hinck (Western Washington University, San Francisco, CA) provided the expression constructs of protein interacting with c kinase-1 (PICK1),3 which have been described previously (21). Dynamin and epsin constructs were a generous gift from Dr. Alexandre Benmerah (Institut Cochin, Paris, France) and have been described elsewhere (22). Nephrin mutants T1120A and T1125A were generated by gene synthesis (Eurofins MWG, Ebersberg, Germany).
Cell Culture
Immortalized murine podocytes were generously provided by Dr. Peter Mundel (Massachusetts General Hospital, Boston, MA). The generation of PKCα(+/+) and PKCα(−/−) podocytes has been described earlier (23). The podocytes were grown on type I collagen under permissive temperature (33 °C) in the presence of 10 units/ml IFN-γ. To induce differentiation, the cells were maintained at 37 °C without IFN-γ for 10–14 days (24). HEK293T cells were grown in DMEM/F-12 medium supplemented with 10% FCS.
Antibodies
The following antibodies were used: mouse β-arrestin2, rabbit anti-pan-PKC, rabbit anti-PKCα, rabbit anti-phospho-PKCα, rabbit anti-PICK1, goat anti-PICK1, and rabbit anti-GAPDH (Santa Cruz Biotechnology, Santa Cruz, CA); rabbit anti-β-arrestin2 (Cell Signaling Technology, Frankfurt, Germany); mouse anti-M2 and anti-actin (Sigma-Aldrich); protein G-Sepharose and mouse anti-human IgG (Amersham Biosciences); and guinea pig anti-nephrin (Progen Biotechnik, Heidelberg, Germany). Rabbit polyclonal anti-phospho-nephrin antibody was generated by Eurogentec (Seraing, Belgium).
Coimmunoprecipitation
Coimmunoprecipitations were performed as described previously (20). In brief, HEK293T cells were transiently transfected by using the calcium phosphate method. After incubation for 24 h, the cells were washed twice and lysed in 1% Triton X-100 lysis buffer. After centrifugation (15,000 × g for 15 min at 4 °C), cell lysates containing equal amounts of total protein were incubated for 1 h at 4 °C with the appropriate antibody, followed by incubation with 30 μl of protein G-Sepharose for 3 h. Sepharose was washed extensively with lysis buffer, and the bound proteins were resolved by 10% SDS-PAGE and visualized by Western blotting.
Recombinant Proteins
GST-nephrin fusion proteins were generated by cloning the nephrin gene or gene fragments into the pGEX-4T-1 vector. The constructs were transformed into Escherichia coli BL21 (Novagen, Merck, Nottingham, UK), and expression of the recombinant proteins was induced by isopropyl-β-d-thiogalactoside. The GST-nephrin fusion proteins were subsequently purified from bacterial extracts by affinity chromatography using glutathione-Sepharose (ÄKTAprime; GE Healthcare, Freiburg, Germany) according to the manufacturer's protocol. Recombinant GST-tagged β-arrestin2 was purchased from Abnova (Heidelberg, Germany), and histone H1 was obtained from Biozol (Eching, Germany).
Kinase Assay
Recombinant PKCα containing an N-terminal His6 tag was purchased from Upstate Millipore (Biomol, Hamburg, Germany). The kinase reaction was performed in reaction buffer (20 mm HEPES, pH 7.4, 0.03% Triton X-100, 100 μg/ml phosphatidylserine, 10 μg/ml diacylglycerol, 10 mm MgCl2, 0.1 mm CaCl2, 50 μm ATP, and 5 μCi of [γ-32P]ATP) for 30 min at 30 °C and stopped by adding 4× sample buffer and heating for 5 min at 90 °C. Following separation on SDS-polyacrylamide gels, the gels were fixed in 50% methanol and 10% acetic acid, dried, and exposed to x-ray film.
Protein Pulldown Experiment
The GST-nephrin fusion proteins or GST alone (3 μg) were incubated with 4 ng of PKCα in 25 μl of kinase reaction buffer without [γ-32P]ATP for 30 min at 30 °C. After dilution of the samples in immunoprecipitation buffer (20 mm Tris, pH 7.5, 1% Triton X-100, 1 mm EDTA, 150 mm KCl, 0.2 mm Na3VO4, and protease inhibitors) to a final volume of 500 μl and addition of 250 ng recombinant β-arrestin2, the proteins were incubated for 30 min at 4 °C. The different nephrin proteins were immunoprecipitated via an antibody directed against nephrin and protein A-Sepharose. After extensive washing in immunoprecipitation buffer, the proteins were released from the Sepharose beads by incubation in SDS sample buffer for 5 min at 95 °C and analyzed for coimmunoprecipitation of β-arrestin2 on Western blot.
Biotinylation Assay
HEK293T cells were cultured in 10-cm dishes and transiently cotransfected with a fixed amount (2 μg) of nephrin cDNA and increasing amounts of β-arrestin2 (0–10 μg). In all cases, the total DNA per transfection was maintained constant at 10 μg/dish by using empty parental vector pCDM8. After transfection (24 h), the cells were placed on ice and washed thrice with ice-cold PBS buffer containing 0.1 mm CaCl2 and 1 mm MgCl2, pH 8.0 (PBSCM). Plasma membrane proteins were isolated by using a cell surface biotinylation assay. In brief, plasmalemmal proteins were indiscriminately labeled with membrane-impermeable N-hydroxysulfosuccinimydyl-SS-biotin (0.5 mg/ml; Pierce) for 30 min at 4 °C. The solution was then discarded, and unbound biotin was quenched thrice with ice-cold PBSCM containing 100 mm glycine. The cells were lysed in PBS buffer containing 0.2% deoxycholic acid, 1% Triton X-100, and proteinase inhibitor mixture (Roche Applied Science) for 30 min on ice and centrifuged at 12,000 × g for 30 min at 4 °C to remove insoluble cellular debris. A portion of the resulting supernatant was removed to represent the total fraction. The remaining supernatant was incubated with rabbit anti-nephrin antiserum followed by protein A-Sepharose to extract biotinylated surface proteins according to the manufacturer's instructions. The proteins were resolved by SDS-PAGE followed by Western blotting. The intensities of the bands were quantified by densitometry (Alphaease Software 6.0; Alpha Innotech, San Leandro, CA).
siRNA and Plasmid Cotransfection
Cotransfection of HEK293T cells with specific siRNA and plasmid constructs was performed according to the manufacturer's protocol. In brief, the cells were seeded in 6-cm dishes in low glucose DMEM (5.5 mm). The next day they were transfected with 2 μg of plasmid DNA and 0.4 nmol of (control or specific) siRNA in 4 ml of transfection medium. After 24 h transfection, the cells were equally divided to several dishes and treated with varying glucose levels in DMEM after an additional 48–72 h (25 or 40 mm) for the indicated time points. The cells were harvested subsequently and analyzed for interaction by immunoprecipitation and Western blotting.
Isolation of Glomeruli
The mice were anesthetized by intraperitoneal injection of ketamine (0.168 mg/g of body weight) and xylazine (8 mg/g of body weight). Their kidneys were perfused with ice-cold PBS via the abdominal aorta as described previously (25). The distal aorta was cannulated with polyethylene tubing (Portex, Hythe, UK; inner diameter, 0.28 mm) and perfused in situ at a constant rate of 2 ml/min. The proximal aorta was ligated. To ensure venous drainage, a hole was cut into the inferior caval vein. Initially, the kidneys were perfused with ice-cold PBS to remove any remaining blood. After preparation, the kidneys were perfused with Dynabeads (diameter, 4.5 μm; Invitrogen) at a concentration of ∼1.2 × 10⁷ beads/ml in PBS. The kidneys were removed, minced, and digested with collagenase A (Roche Applied Science) for 30 min at 37 °C. The digested kidney tissue was sieved through a 100-μm cell mesh with intermittent PBS flushing (∼50 ml of ice-cold sterile PBS). After centrifugation (40,000 × g at 4 °C for 5 min), the cell pellet was dissolved in 2 ml of cooled PBS and transferred to a 2-ml tube. By using a magnet catcher and a subsequent washing procedure, the Dynabeads containing glomeruli were washed until an approximate purity of 95% was achieved.
Endogenous Immunoprecipitation
Isolated glomeruli were lysed in CHAPS buffer by using a TissueRuptor (Qiagen) on ice. Insoluble cellular material was removed by centrifugation (15,000 × g for 30 min at 4 °C), and the resulting cell lysates were adjusted to ensure equal total protein content. After addition of the appropriate antibodies, the lysates were incubated overnight at 4 °C followed by incubation with 30 μl of protein A-Sepharose for 3 h. The immunoprecipitates were washed extensively with lysis buffer, and the bound proteins were resolved by 10% SDS-PAGE under nonreducing conditions and visualized by Western blotting.
In Vivo Diabetic Model
Mice (aged 6 weeks) were treated intraperitoneally with a high dose of streptozotocin (200 mg/kg of body weight) on two consecutive days. For sustained hyperglycemia, the mice were administered glucose (6 μg/g of body weight) intraperitoneally. Blood glucose was measured by using a blood glucose meter (Bayer, Darmstadt, Germany). For urinalysis, the mice were kept in metabolic cages (Tecniplast, Buggugiate, Italy) for 12 h. They were sacrificed 48 h after the last injection of streptozotocin.
RESULTS
High Glucose Milieu Increased β-Arrestin2-Nephrin Interaction
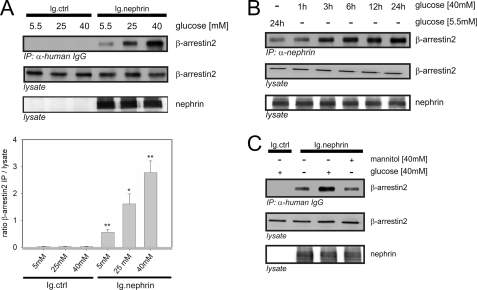
We hypothesized that a high glucose milieu exerts a direct effect on the β-arrestin2-nephrin interaction. Therefore, we expected an increase in nephrin endocytosis upon a disturbance in the slit diaphragm integrity. First, we exposed HEK293T cells transiently overexpressing β-arrestin2 and the nephrin C terminus to increasing concentrations of d-glucose for 24 h. The glucose concentrations were chosen to resemble normoglycemia (5.5 mm), moderate hyperglycemia (25 mm), and severe hyperglycemia (40 mm). The increasing glucose levels induced a significant dose-dependent increase in β-arrestin2 binding to nephrin (Fig. 1A). The increase in β-arrestin2 binding was detected beginning at 3 h after the medium change to a higher glucose concentration and lasted until 24 h (Fig. 1B). Mannitol was used in isosmotic doses to exclude any effect of the cell swelling on the protein interaction. Even the maximum concentration of 40 mm mannitol did not affect the interaction strength (Fig. 1C).
FIGURE 1.
High glucose concentrations increase the binding of β-arrestin2 to nephrin. Coimmunoprecipitation experiments were conducted in HEK293T cells and analyzed by Western blotting. FLAG-tagged β-arrestin2 (β-arrestin2), Ig-tagged nephrin C terminus (Ig.nephrin), and Ig tag as the negative control (Ig.ctrl) were overexpressed as indicated. Staining of β-arrestin2 and nephrin in the lysate served as the internal loading control. A, impact of rising glucose concentration. HEK293T cells were incubated in the medium with increasing concentrations of glucose (5.5, 25, or 40 mm) for 24 h. After the indicated time points, coimmunoprecipitation with Ig.nephrin or Ig.ctrl was performed. Interaction was determined by staining of β-arrestin2. The results of three independent experiments were quantified by densitometry and graphed as the ratio of the β-arrestin2 immunoprecipitation (IP) signal intensity to the lysate signal intensity (ratio β-arrestin2 IP/lysate). The data are the means ± S.E. *, p < 0.05; **, p < 0.01 (Student's t test). B, time course. The cells were incubated with 5.5 mm glucose for 24 h or 40 mm glucose for 1–24 h. Then coimmunoprecipitation with Ig.nephrin or Ig.ctrl was performed. The degree of interaction was determined by staining of β-arrestin2. C, osmotic control. The cells were incubated with 5.5 or 40 mm glucose or 40 mm mannitol for 24 h. Then coimmunoprecipitation with Ig.nephrin or Ig.ctrl was performed. The degree of interaction was determined by staining of β-arrestin2.
The Effect of High Glucose on β-Arrestin2-Nephrin Interaction Was Mediated by PKCα
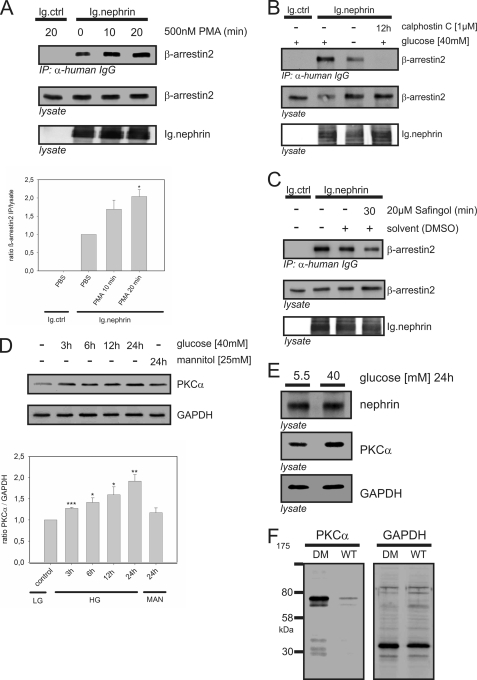
Sequence analysis predicted a PKC recognition motif ((S/T)XX(K/R)) within the presumed β-arrestin2 binding motif ((S/T)X4–5(S/T); nephrin amino acids 1120–1125; TGERDT). To test the impact of PKC activity on β-arrestin2 binding, we used phorbol 12-myristate 13-acetate, a potent activator of PKC. HEK293T cells transiently overexpressing β-arrestin2 and the nephrin C terminus were treated with phorbol 12-myristate 13-acetate. This induced a marked significant increase in β-arrestin2-nephrin interaction after 20 min (Fig. 2A). Calphostin C, a general PKC inhibitor, attenuated the interaction. Because these results indicated a regulatory role of PKC in the β-arrestin2-nephrin interaction, we examined whether PKC mediates the influence of high glucose (40 mm) on β-arrestin2 binding to nephrin. Indeed, calphostin C abrogated β-arrestin2 binding even under high glucose conditions (Fig. 2B). Because the PKC family comprises at least 12 different isoforms, we used more specific PKC inhibitors or pseudosubstrates to identify the critical isoform. The PKCα inhibitor safingol (20 μm) reduced β-arrestin2 binding after 30 min of treatment, suggesting that PKCα was the critical isoform (Fig. 2C).
FIGURE 2.
PKCα mediates the high glucose effect on the nephrin-β-arrestin2 interaction. A–C, Western blots showing coimmunoprecipitation in HEK293T cells. FLAG-tagged β-arrestin2 (β-arrestin2), Ig-tagged nephrin C terminus (Ig.nephrin), and Ig tag as the negative control (Ig.ctrl) were transiently overexpressed as indicated. Staining of β-arrestin2 and nephrin in the lysate served as the internal loading control. A, impact of PKC activation on the β-arrestin2-nephrin interaction. HEK293T cells were pretreated with solvent or the general PKC activator phorbol 12-myristate 13-acetate (500 nm) for 10 or 20 min. Then coimmunoprecipitation with Ig.nephrin or Ig.ctrl was performed. The strength of interaction was determined by staining of β-arrestin2. The results of three independent experiments were quantified by densitometry and graphed as the ratio of the β-arrestin2 immunoprecipitation (IP) signal intensity to the lysate signal intensity (ratio β-arrestin2 immunoprecipitation/lysate). The data are the means ± S.E. *, p < 0.05 (Student's t test). B, impact of PKC inhibition on the β-arrestin2-nephrin interaction. HEK293T cells were maintained in 5 or 40 mm glucose and then treated with solvent or the general PKC inhibitor calphostin (1 μm) for 12 h. Coimmunoprecipitation with Ig.nephrin or Ig.ctrl was performed. The degree of interaction was measured by staining of β-arrestin2. C, isolation of the critical PKC isoform for the β-arrestin2-nephrin interaction. HEK293T cells were pretreated with solvent or the PKCα inhibitor safingol (20 μm) for 30 min. Then coimmunoprecipitation with Ig.nephrin or Ig.ctrl was performed. The degree of interaction was determined by staining of β-arrestin2. D, level of PKCα expression in immortalized podocytes under high glucose conditions. Murine podocytes were incubated in 40 mm glucose, and the PKCα protein levels were measured at indicated time points. GAPDH levels served as the internal loading control, and 40 mm mannitol (24 h) was used as the isosmotic control. The results of three independent experiments were quantified by densitometry and graphed as the ratio of the PKCα signal intensity to the GAPDH immunostaining signal intensity (ratio PKCα/GAPDH). The data are the means ± S.E. *, p < 0.05; **, p < 0.01; ***, p < 0.001 (Student's t test). E, level of PKCα expression in murine glomeruli under high glucose conditions. Isolated murine glomeruli (C57BL/6 mice) were incubated in 5.5 or 40 mm glucose for 24 h. The level of PKCα expression was determined by staining with a specific antibody. Staining of nephrin and GAPDH served as the internal loading controls. F, level of PKCα expression in the kidneys of diabetic mice. Diabetes was induced in C57BL/6 mice by injection of streptozotocin. After 24 h of glucose levels >33 mmol/liter, the kidneys were harvested and lysed, and the PKCα levels were measured. Staining of GAPDH served as the internal loading control. DM, diabetic mice.
Pathologic Glucose Levels Led to Up-regulation of PKCα Expression in Murine Podocytes, Glomeruli, and Kidneys
Our experiments suggested that PKCα mediated the high glucose effect on the β-arrestin2-nephrin interaction. Therefore, we investigated whether high glucose levels alter PKCα expression in vivo. For these experiments, we screened murine immortalized podocytes, glomeruli, and kidneys before and after treatment with high glucose concentrations. A high glucose concentration (40 mm) significantly enhanced the protein expression of PKCα in podocytes 3 h after the medium change. Mannitol (40 mm), used as an osmotic control, did not alter the PKCα level (Fig. 2D). Treatment of isolated murine glomeruli with a high glucose concentration (40 mm) for 24 h also induced up-regulation of PKCα expression (Fig. 2E). To investigate PKCα expression in an established model of type 1 diabetes, we induced diabetes in C57BL/6 mice with streptozotocin. Their kidneys were harvested 24 h after the onset of hyperglycemia, and glomeruli were isolated. Western blot analysis demonstrated markedly increased PKCα protein expression in the diabetic kidneys compared with the normoglycemic control kidneys (Fig. 2F).
Nephrin Precipitated PKCα
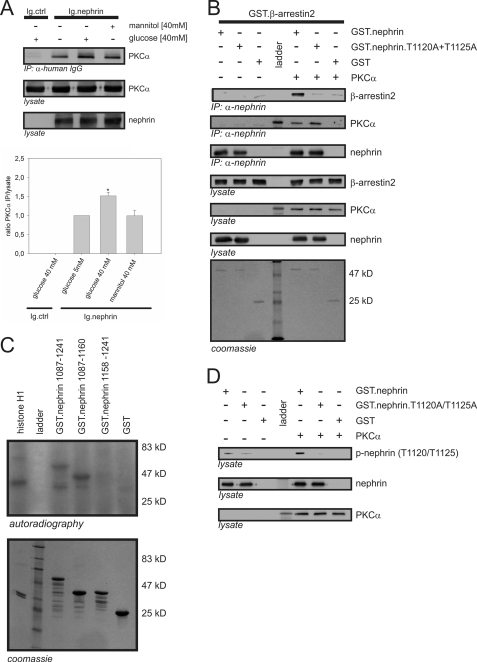
On the basis of our previous observations, we focused on PKCα. As shown in Fig. 3A, nephrin interacted with PKCα in the HEK293T system. The interaction was significantly stronger under high glucose (40 mm) conditions. No increase in the interaction was seen after treatment with 40 mm mannitol, used to exclude an osmotic effect. To determine the mode of interaction, we performed pull-down experiments. Recombinant nephrin and PKCα interacted in vitro. Further, the interaction of nephrin and β-arrestin2 was dependent on the presence of PKCα (Fig. 3B). When the T1120A/T1125A double mutant was used instead of wild-type nephrin, the β-arrestin2-nephrin interaction was nearly abrogated, but PKCα was still precipitated by the mutated nephrin (Fig. 3B).
FIGURE 3.
Interaction of β-arrestin2 with nephrin in vitro depends on PKCα phosphorylation of nephrin threonine residues 1120 and 1125. A, Western blots showing coimmunoprecipitation in HEK293T cells overexpressing untagged PKCα (PKCα), Ig-tagged nephrin C terminus (Ig.nephrin), or Ig tag as the negative control (Ig.ctrl). The cells were maintained in 5.5 or 40 mm glucose or 40 mm mannitol (osmotic control) for 24 h. Then coimmunoprecipitation with Ig.ctrl or Ig.nephrin was performed. The level of interaction was determined by staining of PKCα. The results of three independent experiments were quantified by densitometry and graphed as the ratio of the PKCα (immunoprecipitation, IP) signal intensity to the lysate signal intensity (ratio PKCα immunoprecipitation/lysate). The data are the means ± S.E. *, p < 0.05 (Student's t test. B, in vitro pull-down assay. Aliquots of recombinant nonmutated nephrin cytoplasmic domain (GST.nephrin), double-mutant cytoplasmic domain (GST.nephrin.T1120A+T1125A), and control protein (GST) expressed in E. coli were immobilized by anti-nephrin antibody in the presence or absence of PKCα. In the Western blots, the interaction of nephrin with β-arrestin2 and PKCα was determined by staining with specific antibodies. Lysate controls show protein input of β-arrestin2, PKCα, and nephrin. Coomassie staining of SDS-PAGE gel showed equal protein input of Ig.nephrin (51 kDa) and GST (25 kDa). The molecular mass markers are indicated in kDa. C, in vitro phosphorylation assay. Aliquots of recombinant wild-type nephrin cytoplasmic domain (amino acids 1087–1241) and truncated nephrin cytoplasmic domain with (amino acids 1087–1169) and without the predicted β-arrestin2 interaction site (amino acids 1158–1241) were expressed in E. coli. Then recombinant PKCα and γ-32P were added. Histone H1 was used as the positive control. Phosphorylation was visualized by autoradiography. Coomassie staining of an SDS-PAGE gel showed equal protein input. Molecular mass markers are indicated in kDa. D, in vitro phosphorylation assay with phospho-nephrin antibody. Aliquots of recombinant nonmutated nephrin cytoplasmic domain (GST.nephrin), double-mutant cytoplasmic domain (GST.neprin.T1120A+T1125A), and control protein (GST) expressed in E. coli were immobilized by anti-nephrin antibody in the presence or absence of PKCα. In the Western blots, phosphorylation of nephrin, the mutant, and the control was visualized by staining with phospho-nephrin antibody to recognize phosphorylated nephrin threonine residues 1120 or 1125. Staining of total nephrin and PKCα served as the internal loading control.
PKCα Phosphorylated Nephrin
Because the mutation of threonine residues 1120 and 1125 to alanine attenuated the binding of β-arrestin2 to nephrin, we hypothesized that this interaction is dependent on phosphorylation. In the kinase assays, PKCα phosphorylated only truncated nephrin proteins carrying the presumed β-arrestin2 interaction motif (TGERDT; amino acids 1120–1125) (Fig. 3C). To verify that threonine 1120 and 1125 are indeed the residues targeted by PKCα, we generated a specific phospho-nephrin antibody. A stable increase in the phosphorylation of nephrin threonine residues 1120 and 1125 was observed only in the presence of PKCα (Fig. 3D).
PICK1 Was Part of the Complex of Nephrin, PKCα, and β-Arrestin2
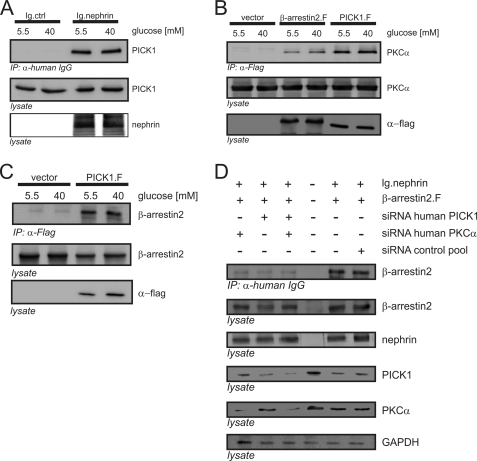
Cumulative evidence indicates that PICK1 functions as a scaffolding molecule for PKCα (26, 27). Coimmunoprecipitation in the HEK293T system demonstrated the binding of PICK1 to nephrin (Fig. 4A), PKCα (Fig. 4B), and β-arrestin2 (Fig. 4C). All of the experiments were conducted under low glucose (5 mm) and high glucose (40 mm) conditions. Shifting of the cells to the high glucose condition did not induce a noticeable difference in the binding strength of PICK1 to nephrin, PKCα, or β-arrestin2.
FIGURE 4.
Nephrin, PICK1, PKCα, and β-arrestin2 form a protein complex. A–D, Western blots showing coimmunoprecipitation (IP) in HEK293T cells overexpressing FLAG-tagged PICK1 (PICK1.F), untagged PKCα (PKCα), FLAG-tagged β-arrestin2 (β-arrestin2.F), Ig-tagged nephrin C terminus (Ig.nephrin), or Ig tag as the negative control (Ig.ctrl). A, interaction of nephrin and PICK1. HEK293T cells were incubated with 5.5 or 40 mm glucose for 24 h. Then coimmunoprecipitation with Ig.ctrl or Ig.nephrin was performed, and the interaction was determined by staining of PICK1. Staining of nephrin and PICK1 in the lysates served as the internal loading control. B, interactions of β-arrestin2 with PKCα and PICK with PKCα. HEK293T cells were incubated with 5.5 or 40 mm glucose for 24 h. Then coimmunoprecipitation with vector control, β-arrestin2, or PICK1 was performed, and the interaction was determined by staining of PKCα. Staining of PKCα and nephrin in the lysates served as the internal loading control. C, interaction of PICK1 and β-arrestin2. HEK293T cells were incubated with 5.5 or 40 mm glucose for 24 h. Then coimmunoprecipitation with vector control or PICK1 was performed, and the interaction was determined by staining of β-arrestin2. Staining of β-arrestin2 and nephrin in the lysates served as the internal loading control. D, impact of cellular knockdown of PICK1 and PKCα on β-arrestin2. HEK293T cells were transfected with Ig.nephrin and β-arrestin2. Specific siRNA was used to deplete HEK293T cells of endogenous PKCα and/or PICK1. Nephrin and β-arrestin2 were overexpressed, and nephrin was immunoprecipitated under high glucose conditions (40 mm). The β-arrestin2-nephrin interaction was determined by staining of β-arrestin2 (first row). Expression levels of β-arrestin2 (second row), nephrin (third row), PICK1 (fourth row), PKCα (fifth row), and GAPDH (sixth row) were determined by staining with specific antibodies. siRNA was transfected as follows: first column, PKCα siRNA; second column, PICK1 siRNA; third column, PKCα and PICK1 siRNA. For the controls: fourth column, endogenous protein levels, no nephrin transfected; fifth column, no siRNA, transfection lipid only; sixth column, scrambled siRNA. GAPDH was used as the internal loading control.
The Impact of High Glucose on Nephrin-β-Arrestin2 Interaction Was Dependent on PKCα and PICK1
To confirm our findings obtained with the pharmacologic PKC inhibitors, we used a siRNA approach to specifically deplete HEK293T cells of endogenous PKCα and/or PICK1. After the knockdown of the target gene expression, coimmunoprecipitation studies were performed. Knockdown of either PKCα or PICK1 was sufficient to attenuate the glucose-dependent increase in the binding of β-arrestin2 to nephrin markedly. The same effect was achieved by simultaneous knockdown of PKCα and PICK1. No change in the degree of interaction was found in the control experiments with scrambled siRNA or with transfection lipid only (Fig. 4D).
Role of Nephrin Threonine Residues 1120 and 1125 in the Protein Complex
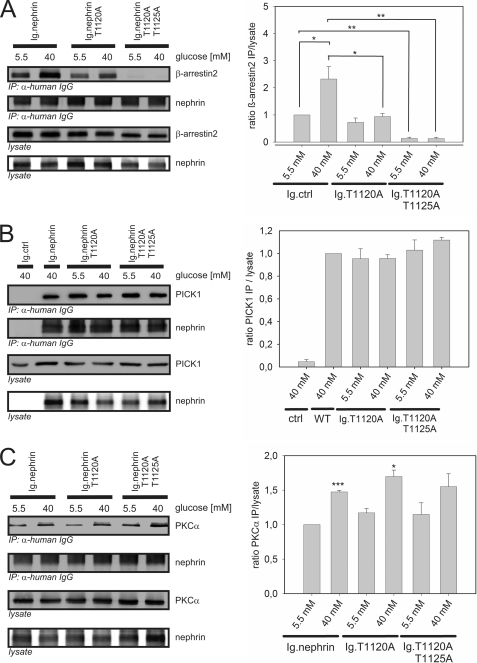
Our in vitro experiments suggested that the β-arrestin2-nephrin interaction is dependent on phosphorylation of threonine residues 1120 and 1125 by β-arrestin2. Therefore, we sought to verify the functional relevance of the threonine residues for the assembly of the protein complex. The β-arrestin2 binding to nephrin single mutant T1120A was markedly decreased in comparison with the binding to nonmutated nephrin. The binding of β-arrestin2 to T1120A could still be increased by raising the glucose concentration. The double mutant (T1120A/T1125A) significantly decreased the binding of β-arrestin2. Further, the binding was not restored under the high glucose (40 mm) condition (Fig. 5A). The binding of PICK1 and PKCα was preserved with all three nephrin proteins, namely nonmutated nephrin, the T1120A mutant, and the T1120A/T1125A mutant. The recruitment of PICK1 remained unchanged irrespective of the glucose level (Fig. 5B). Under the high glucose (40 mm) condition, a significantly stronger binding of PKCα was observed in nonmutated nephrin and the T1120A mutant, whereas the difference in the T1120A/T1125A mutant did not reach significance (Fig. 5C).
FIGURE 5.
The role of nephrin threonine residues 1120 and 1125 in the protein complex. A–C, Western blots showing coimmunoprecipitation in HEK293T cells transfected with nephrin C terminus (Ig.nephrin) or Ig tag as the negative control (Ig.ctrl); single-mutant nephrin T1120A (Ig.nephrinT1120A) or double-mutant nephrin T1120A+T1125A (Ig.nephrin T1120A T1125A); and FLAG-tagged β-arrestin2 (β-arrestin2), PICK1 (PICK), or PKCα in the indicated combinations. A, β-arrestin2 binding to mutated nephrin. HEK293T cells were incubated with 5.5 or 40 mm glucose for 24 h. Then coimmunoprecipitation with Ig.nephrin, Ig.nephrinT1120A, or Ig.nephrinT1120A+T1125A was performed, and the interaction was determined by staining of β-arrestin2. Staining of β-arrestin2 and nephrin served as the internal loading control. The results of three independent experiments were quantified by densitometry and graphed as the ratio of the β-arrestin2 immunoprecipitation (IP) signal intensity to the lysate signal intensity (ratio β-arrestin2 immunoprecipitation/lysate). The data are the means ± S.E. *, p < 0.05; **, p < 0.01; ***, p < 0.001 (Student's t test). B, PICK1 binding to mutated nephrin. HEK293T cells were incubated with 5.5 or 40 mm glucose for 24 h. Then coimmunoprecipitation with Ig.nephrin, Ig.nephrinT1120A, or Ig.nephrinT1120A+T1125A was performed, and the interaction was determined by staining of PICK1. Staining of PICK1 and nephrin served as the internal loading control. The results of three independent experiments were quantified by densitometry and graphed as the ratio of the PICK1 IP signal intensity to the lysate signal intensity (ratio PICK1 IP/lysate). The data are the means ± S.E. (no significance was reached: p > 0.05). C, PKCα binding to mutated nephrin. HEK293T cells were incubated with 5.5 or 40 mm glucose for 24 h. Then coimmunoprecipitation with Ig.nephrin, Ig.nephrinT1120A, or Ig.nephrinT1120A+T1125A was performed, and the interaction was determined by staining of PKCα. Staining of PKCα and nephrin served as the internal loading control. The results of three independent experiments were quantified by densitometry and graphed as the ratio of the PKCα IP signal intensity to the lysate signal intensity (ratio PKCα IP/lysate). The data are the means ± S.E. *, p < 0.05; ***, p < 0.001 (Student's t test).
Nephrin, PICK1, PKCα, and β-Arrestin2 Formed a Complex in Vivo
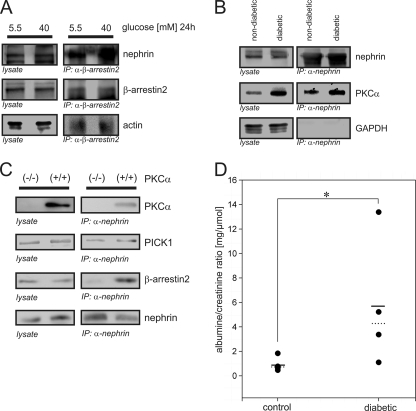
To translate our findings in vivo, we applied three different approaches. First, immunoprecipitation in isolated murine glomeruli incubated in low glucose (5.5 mm) or high glucose (40 mm) medium for 24 h was performed. Endogenous β-arrestin2 precipitated endogenous nephrin, indicating that these proteins formed a complex in vivo. Exposure of glomeruli to a high glucose milieu profoundly enhanced the intensity of the β-arrestin2-nephrin interaction (Fig. 6A). Second, we examined diabetic C57BL/6 mice and their nondiabetic littermates. After the glucose level was stably elevated (>33 mmol/liter) over 24 h, the glomeruli were isolated, and immunoprecipitation was performed. Endogenous nephrin precipitated endogenous PKCα in both the diabetic and the nondiabetic animals (Fig. 6B). To clarify the in vivo relevance, we used PKCα-deficient murine podocytes (PKCα(−/−)) and the corresponding wild-type controls (PKCα(+/+)) for immunoprecipitation of endogenous proteins. Recruitment of β-arrestin2 to nephrin was clearly detectable in the PKCα(+/+) podocytes, whereas in the PKCα(−/−) podocytes, binding of β-arrestin2 was abrogated. In contrast, the binding of PICK1 to nephrin was detected in both types of podocytes in equal concentrations (Fig. 6C).
FIGURE 6.
High glucose concentrations increase the β-arrestin2-nephrin interaction in vivo and cause albuminuria in mice. A–C, Western blots showing endogenous coimmunoprecipitations. A, endogenous interaction of β-arrestin2 and nephrin. Murine glomeruli (C57BL/6 mice) were incubated for 24 h after isolation in 5.5 or 40 mm glucose. β-Arrestin2 was immunoprecipitated, and the interaction was determined by staining of nephrin. Staining of actin served as the internal control. B, endogenous interaction of nephrin and PKCα. Diabetes was induced in C57BL/6 mice by injection of streptozotocin. After 24 h of glucose levels > 33 mmol/liter, glomeruli were isolated and lysed. Nephrin was immunoprecipitated, and the interaction was determined by staining of PKCα. Staining of immunoprecipitation and lysates of GAPDH served as the internal control. C, endogenous immunoprecipitation in murine PKCα-deficient podocytes (PKCα−/−) and wild-type control cells (PKCα+/+). Endogenous nephrin was immunoprecipitated, and the interaction of PKCα, PICK1, and β-arrestin2 was determined by staining with specific antibodies. Staining of lysates served as the internal control. D, albuminuria in diabetic versus nondiabetic C57BL/6 mice. Diabetes was induced in C57BL/6 mice by injection of streptozotocin. After 24 h of glucose levels of >33 mmol/liter, albuminuria was quantified as the albumin/creatinine ratio. Left column, nondiabetic control animals (n = 5); right column, diabetic animals (n = 4). The solid line represents the mean albumin/creatinine ratio, and the dashed line represents the median albumin/creatinine ratio values. *, p < 0.05 (Wilcoxon signed-rank test).
Diabetic Mice Developed Microalbuminuria after 24 h of Acute Hyperglycemia
Our results so far suggested an immediate effect of pathologic blood glucose levels on the β-arrestin2-nephrin interaction and nephrin endocytosis within a few hours of exposure to such glucose levels. Therefore, we hypothesized that this early impact of hyperglycemia impairs the slit diaphragm integrity, resulting in an increase in urinary albumin excretion. The diabetic animals showed a significant increase in albuminuria compared with the normoglycemic control group (0.88 ± 0.55 versus 5.77 ± 5.35 μg of albumin/μmol of creatinine; p < 0.05 by Wilcoxon signed rank test; Fig. 6D).
PKCα and PICK1 Were Pivotal for Nephrin Endocytosis
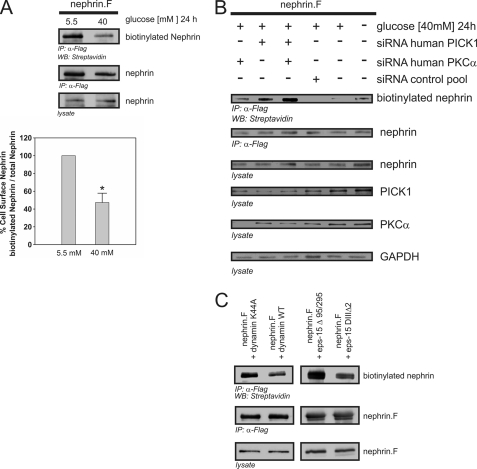
According to our hypothesis, albuminuria occurs because of less nephrin available at the slit diaphragm. Therefore, we examined the role of PKCα in β-arrestin2-dependent nephrin endocytosis. HEK293T cells transiently overexpressing full-length nephrin were exposed to a low glucose (5.5 mm) or high glucose (40 mm) condition for 24 h. A biotinylation assay was used to quantify the surface expression of nephrin. The high glucose condition induced a significant decrease in nephrin surface expression, indicating a higher degree of nephrin endocytosis (Fig. 7A). To investigate the relevance of PKCα and PICK1 for nephrin endocytosis, we used siRNA to achieve either single or simultaneous knockdown of PKCα and PICK1 expression. Then biotinylation assays to measure the surface expression of nephrin were performed. The high glucose condition caused a significant decrease in nephrin surface expression compared with the low glucose condition. Deficiency of PKCα or PICK1 abrogated the high glucose effect and restored nephrin surface expression. Combined knockdown of PKCα and PICK1 also led to a marked enhancement of nephrin surface expression. In the control experiments (scrambled siRNA or transfection lipid only), the surface expression of nephrin was not altered (Fig. 7B).
FIGURE 7.
High glucose-induced nephrin endocytosis depends on PKCα and PICK1. A–C, surface abundance of nephrin measured in biotinylation assays. FLAG-tagged full-length nephrin (nephrin.F), functional dynamin (dynamin WT), and epsin (eps-15Δ95/295), and the according dominant negative mutants (dynamin K44A and eps-15 DIIIΔ2) were transiently overexpressed in HEK293T cells. A, impact of high glucose concentrations on nephrin surface abundance. After immunoprecipitation, surface nephrin was determined by detecting the biotinylated fraction. Staining of nephrin in the lysate and immunoprecipitation served as the internal control. The results were quantified by densitometry and graphed as the ratio of the PKCα immunoprecipitation (IP) signal intensity to the lysate signal intensity (ratio PKCα IP/lysate). The data are the means ± S.E. (n = 4). *, p < 0.001 (Student's t test). B, impact of cellular knockdown of PICK1 and PKCα on nephrin surface abundance. Specific siRNA was used to deplete HEK293T cells of endogenous PKCα and/or PICK1. The cells were maintained in 5.5 or 40 mm glucose medium for 24 h. GAPDH was used as the internal loading control. First column, PKCα siRNA; second column, PICK1 siRNA; third column, PKCα and PICK1 siRNA. For the controls: fourth column, scrambled control siRNA; fifth column, no siRNA (40 mm glucose); sixth column, no siRNA, transfection lipid only (5.5 mm glucose). Biotinylated surface nephrin was stained with streptavidin (first row). Total expression levels of nephrin are shown in the second row (immunoprecipitation, IP) and the third row (lysate). The expression levels of PICK1, PKCα, and GAPDH are shown in the fourth, fifth, and sixth rows, respectively. C, nephrin endocytosis depends on dynamin and clathrin. FLAG-tagged full-length nephrin (nephrin.F), dynamin (wild-type and dominant negative mutant K44A), and epsin (eps-15Δ95/295 and dominant negative mutant eps-15 DIIIΔ2) were transiently overexpressed in HEK293T cells. After immunoprecipitation, surface nephrin was determined by detecting the biotinylated fraction. Staining of nephrin in the immunoprecipitation and lysate served as the internal loading control.
β-Arrestin2-mediated Nephrin Endocytosis Was Dependent on Dynamin and Clathrin
Recent studies have provided substantial evidence that proteins bound by β-arrestin2 are connected to the endocytotic machinery via adaptor protein 2 (28). Dynamin is needed for both clathrin-dependent and clathrin-independent endocytosis. Epsin is crucial for the clathrin-dependent internalization processes. We used well studied dominant negative mutants of dynamin and epsin to unravel the mechanism of nephrin endocytosis further. Both mutants profoundly diminished the surface expression of nephrin compared with coexpression of dynamin or epsin wild type, suggesting that clathrin-dependent endocytosis played an important role in the regulation of nephrin surface expression in this study (Fig. 7C).
DISCUSSION
This study shows that a short duration of hyperglycemia is sufficient to induce proteinuria, a finding supporting our hypothesis that a high blood glucose level induces leakiness of the glomerular filter by increased nephrin endocytosis. This result is also in line with earlier findings that diabetic podocytes show a change in their nephrin staining pattern from surface expression to cytoplasmic distribution, suggesting increased internalization of nephrin (29). As we have previously demonstrated, nephrin endocytosis is mediated by the interaction of β-arrestin2 and nephrin (15). By our present study, we have shown for the first time that a high glucose milieu rapidly enhances the interaction of β-arrestin2 and nephrin in a dose-dependent manner.
The interaction of β-arrestin2 is usually regulated by the phosphorylation of serine or threonine residues of its targets (30). A sequence scan of the nephrin intracellular domain has revealed a PKC consensus site within the predicted β-arrestin2 binding domain (31). However, the PKC family comprises 12 isozymes, and at least three contribute to diabetic kidney damage (13). Several lines of evidence support PKCα as the candidate kinase involved in nephrin endocytosis in hyperglycemia. First, PKCα mediates β-arrestin2 binding to other single transmembrane receptors such as the TGFβ receptor (23). Second, PKCα deficiency prevents albuminuria in diabetic mice (12). Third, hyperglycemia increases the formation of diacylglycerol, which activates PKC (32). Indeed, suppression of PKCα activity or knockdown with siRNA abrogated the effect of a high glucose concentration, because no further increase in the β-arrestin2-nephrin interaction could be measured in our experimental setup. In line with these results, no β-arrestin2 binding was observed in PKCα-deficient podocytes.
Sequence analysis of the nephrin intracellular domain predicted a PKC recognition motif ((S/T)XX(K/R)) and a putative β-arrestin2 binding motif ((S/T)X4–5(S/T); nephrin amino acids 1120–1125; TGERDT) in close proximity. This indicated that PKCα regulates the binding of β-arrestin2 by the phosphorylation of threonine residues within the β-arrestin2 binding motif in the nephrin intracellular domain. Indeed, the in vitro and in vivo experiments showed that PKCα was recruited to the nephrin intracellular domain and phosphorylated threonine residues 1120 and 1125. Simultaneous mutation of threonine residues 1120 and 1125 abrogated the binding of β-arrestin2 to nephrin completely, confirming the relevance of the nephrin TGERDT motif as the binding motif of β-arrestin2. In other transmembrane receptor systems phosphorylated by PKCα, PICK1 serves as an adaptor molecule for PKCα (26). Indeed, we observed recruitment of PICK1 to the complex of nephrin, PKCα, and β-arrestin2. Because our results suggested that high glucose concentrations markedly enhance the interaction of nephrin and β-arrestin2, we examined whether stronger binding of β-arrestin2 leads to increased endocytosis of nephrin. An increase in the glucose concentration enhanced nephrin endocytosis significantly. Depletion of PICK1 or PKCα attenuated the endocytosis and prevented the loss of nephrin surface expression nearly completely. In accordance with our results, the role of PKCα in diabetic nephrin endocytosis was confirmed very recently by Tossidou et al. (33). It has been recently reported that nephrin traffics via raft- or clathrin-mediated endocytosis (34). From other receptors, it is known that β-arrestin2-dependent endocytosis mainly utilizes the clathrin pathway. As presumed, we noted markedly decreased endocytosis of nephrin after inhibition of the clathrin-dependent pathway.
According to our results, acute hyperglycemia causes albuminuria. De facto, we demonstrated that mice with an episode of severe hyperglycemia over 24 h develop a significant increase in urinary albumin excretion. Our observations are backed by the very recent finding that hyperglycemia induced by glucose infusion increases glomerular permeability in nondiabetic rats; the change in glomerular size selectivity was not related to hyperosmolarity and was reversed after the glucose infusion was ceased (14).
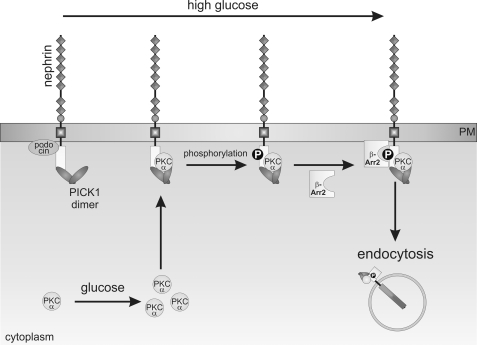
In summary, the present study shows that acute hyperglycemia in diabetes increases nephrin endocytosis in a PKCα- and PICK-dependent manner and thus causes albuminuria (Fig. 8). Conceivably, acute events such as increased nephrin endocytosis serve as an ignition spark for chronically altered slit diaphragm signaling in long standing hyperglycemia. We are convinced that PKCα and PICK1 are promising therapeutic targets for diabetic nephropathy.
FIGURE 8.
Molecular mechanism of high glucose-induced nephrin endocytosis: hyperglycemia induces up-regulation of PKCα expression. PKCα and PICK1 are recruited to the nephrin C terminus. PKCα-mediated phosphorylation facilitates the interaction of β-arrestin2 with nephrin. β-Arrestin2 then connects nephrin to the endocytotic machinery and triggers internalization of the protein complex. Increased endocytosis leads to less surface abundance of nephrin.
Acknowledgments
We thank B. Duvnjak for expert technical assistance and Dr. C. Papewalis for the help with the diabetes mouse models.
The work was supported by Deutsche Forschungsgemeinschaft Grant QU280/3-1 (to I. Q.).
- PICK1
- protein interacting with PRKCA 1
- CHAPS
- 3-[(3-cholamidopropyl)dimethylammonio]-1-propanesulfonic acid.
REFERENCES
- 1. Rossing P. (2006) Curr. Diab. Rep. 6, 479–483 [DOI] [PubMed] [Google Scholar]
- 2. Ziyadeh F. N., Wolf G. (2008) Curr. Diabetes Rev. 4, 39–45 [DOI] [PubMed] [Google Scholar]
- 3. Kalaitzidis R., Bakris G. (2009) J. Clin. Hypertens. 11, 636–643 [DOI] [PMC free article] [PubMed] [Google Scholar]
- 4. Huber T. B., Benzing T. (2005) Curr. Opin. Nephrol. Hypertens. 14, 211–216 [DOI] [PubMed] [Google Scholar]
- 5. Tryggvason K., Patrakka J., Wartiovaara J. (2006) N. Engl. J. Med. 354, 1387–1401 [DOI] [PubMed] [Google Scholar]
- 6. Jones N., Blasutig I. M., Eremina V., Ruston J. M., Bladt F., Li H., Huang H., Larose L., Li S. S., Takano T., Quaggin S. E., Pawson T. (2006) Nature 440, 818–823 [DOI] [PubMed] [Google Scholar]
- 7. Welsh G. I., Saleem M. A. (2010) Pathology 220, 328–337 [DOI] [PubMed] [Google Scholar]
- 8. Gerke P., Huber T. B., Sellin L., Benzing T., Walz G. (2003) J. Am. Soc. Nephrol. 14, 918–926 [DOI] [PubMed] [Google Scholar]
- 9. Kim J. J., Li J. J., Jung D. S., Kwak S. J., Ryu D. R., Yoo T. H., Han S. H., Choi H. Y., Kim H. J., Han D. S., Kang S. W. (2007) J. Am. Soc. Nephrol. 18, 2303–2310 [DOI] [PubMed] [Google Scholar]
- 10. Koop K., Eikmans M., Baelde H. J., Kawachi H., De Heer E., Paul L. C., Bruijn J. A. (2003) J. Am. Soc. Nephrol. 14, 2063–2071 [DOI] [PubMed] [Google Scholar]
- 11. Doublier S., Salvidio G., Lupia E., Ruotsalainen V., Verzola D., Deferrari G., Camussi G. (2003) Diabetes 52, 1023–1030 [DOI] [PubMed] [Google Scholar]
- 12. Menne J., Meier M., Park J. K., Boehne M., Kirsch T., Lindschau C., Ociepka R., Leitges M., Rinta-Valkama J., Holthofer H., Haller H. (2006) Kidney Int. 70, 1456–1462 [DOI] [PubMed] [Google Scholar]
- 13. Meier M., Menne J., Haller H. (2009) Diabetologia 52, 765–775 [DOI] [PubMed] [Google Scholar]
- 14. Axelsson J., Rippe A., Rippe B. (2010) Am. J. Physiol. Renal Physiol. 298, F1306–F1312 [DOI] [PubMed] [Google Scholar]
- 15. Quack I., Rump L. C., Gerke P., Walther I., Vinke T., Vonend O., Grunwald T., Sellin L. (2006) Proc. Natl. Acad. Sci. U.S.A. 103, 14110–14115 [DOI] [PMC free article] [PubMed] [Google Scholar]
- 16. Garg P., Verma R., Nihalani D., Johnstone D. B., Holzman L. B. (2007) Mol. Cell Biol. 27, 8698–8712 [DOI] [PMC free article] [PubMed] [Google Scholar]
- 17. Xiang B., Yu G. H., Guo J., Chen L., Hu W., Pei G., Ma L. (2001) J. Biol. Chem. 276, 4709–4716 [DOI] [PubMed] [Google Scholar]
- 18. Lorenz S., Frenzel R., Paschke R., Breitwieser G. E., Miedlich S. U. (2007) Endocrinology 148, 2398–2404 [DOI] [PubMed] [Google Scholar]
- 19. Huber T. B., Kottgen M., Schilling B., Walz G., Benzing T. (2001) J. Biol. Chem. 276, 41543–41546 [DOI] [PubMed] [Google Scholar]
- 20. Sellin L., Huber T. B., Gerke P., Quack I., Pavenstädt H., Walz G. (2003) FASEB J. 17, 115–117 [DOI] [PubMed] [Google Scholar]
- 21. Williams M. E., Wu S. C., McKenna W. L., Hinck L. (2003) J. Neurosci. 23, 11279–11288 [DOI] [PMC free article] [PubMed] [Google Scholar]
- 22. Boleti H., Benmerah A., Ojcius D. M., Cerf-Bensussan N., Dautry-Varsat A. (1999) J. Cell Sci. 112, 1487–1496 [DOI] [PubMed] [Google Scholar]
- 23. Tossidou I., Starker G., Kruger J., Meier M., Leitges M., Haller H., Schiffer M. (2009) Cell Physiol. Biochem. 24, 627–634 [DOI] [PubMed] [Google Scholar]
- 24. Shankland S. J., Pippin J. W., Reiser J., Mundel P. (2007) Kidney Int. 72, 26–36 [DOI] [PubMed] [Google Scholar]
- 25. Sitek B., Potthoff S., Schulenborg T., Stegbauer J., Vinke T., Rump L. C., Meyer H. E., Vonend O., Stühler K. (2006) Proteomics 6, 4337–4345 [DOI] [PubMed] [Google Scholar]
- 26. Hanley J. G. (2008) Pharmacol. Ther. 118, 152–160 [DOI] [PubMed] [Google Scholar]
- 27. Xu J., Xia J. (2006) Neurosignals 15, 190–20117215589 [Google Scholar]
- 28. Wolfe B. L., Trejo J. (2007) Traffic 8, 462–470 [DOI] [PubMed] [Google Scholar]
- 29. Aaltonen P., Luimula P., Aström E., Palmen T., Grönholm T., Palojoki E., Jaakkola I., Ahola H., Tikkanen I., Holthöfer H. (2001) Lab. Invest. 81, 1185–1190 [DOI] [PubMed] [Google Scholar]
- 30. DeWire S. M., Ahn S., Lefkowitz R. J., Shenoy S. K. (2007) Annu. Rev. Physiol. 69, 483–510 [DOI] [PubMed] [Google Scholar]
- 31. Pearson R. B., Kemp B. E. (1991) Methods Enzymol. 200, 62–81 [DOI] [PubMed] [Google Scholar]
- 32. Noh H., King G. L. (2007) Kidney Int. Suppl. 106, S49–S53 [DOI] [PubMed] [Google Scholar]
- 33. Tossidou I., Teng B., Menne J., Shushakova N., Park J. K., Becker J. U., Modde F., Leitges M., Haller H., Schiffer M. (2010) PLoS One 5, e10185. [DOI] [PMC free article] [PubMed] [Google Scholar]
- 34. Qin X. S., Tsukaguchi H., Shono A., Yamamoto A., Kurihara H., Doi T. (2009) J. Am. Soc. Nephrol. 20, 2534–2545 [DOI] [PMC free article] [PubMed] [Google Scholar]


