Abstract
FGF21 is a novel metabolic regulator involved in the control of glucose homeostasis, insulin sensitivity, and ketogenesis. The liver has been considered the main site of production and release of FGF21 into the blood. Here, we show that, after thermogenic activation, brown adipose tissue becomes a source of systemic FGF21. This is due to a powerful cAMP-mediated pathway of regulation of FGF21 gene transcription. Norepinephrine, acting via β-adrenergic, cAMP-mediated, mechanisms and subsequent activation of protein kinase A and p38 MAPK, induces FGF21 gene transcription and also FGF21 release in brown adipocytes. ATF2 binding to the FGF21 gene promoter mediates cAMP-dependent induction of FGF21 gene transcription. FGF21 release by brown fat in vivo was assessed directly by analyzing arteriovenous differences in FGF21 concentration across interscapular brown fat, in combination with blood flow to brown adipose tissue and assessment of FGF21 half-life. This analysis demonstrates that exposure of rats to cold induced a marked release of FGF21 by brown fat in vivo, in association with a reduction in systemic FGF21 half-life. The present findings lead to the recognition of a novel pathway of regulation the FGF21 gene and an endocrine role of brown fat, as a source of FGF21 that may be especially relevant in conditions of activation of thermogenic activity.
Introduction
Fibroblast growth factor 21 (FGF21) is a metabolic regulator involved in the control of glucose homeostasis, insulin sensitivity, and ketogenesis (1–4). Treatment with FGF21 corrects metabolic disturbances such as hyperglycemia and insulin resistance in rodent models of obesity and diabetes (1, 5–7). It also has been reported that FGF21 exerts autocrine and paracrine actions on livers that promote ketogenesis (2–4). Two recent studies in FGF21 gene-ablated mice have demonstrated that FGF21 is required for the physiological response of mice to fasting and to ketogenic diets (8, 9), although a third study did not confirm these observations (10). Moreover, FGF21 favors glucose utilization in white adipose tissue (WAT),2 and there are conflicting data on to whether FGF21 activates or does not activate lipolysis in white fat (3, 10, 11). Recently, FGF21 has been reported to promote thermogenic activity in neonatal brown adipose tissue (BAT) and in isolated brown adipocytes (12); there are indications that FGF21 may also promote BAT thermogenic activation in adult mice (1, 6, 7).
The liver is considered the main site of production and release of FGF21 into the blood. Expression of the FGF21 gene in the liver is under the control of PPARα, and fatty acid availability, acting via PPARα, seems to be the main determinant of hepatic FGF21 gene expression and release (2, 3, 12, 13). Extra-hepatic tissues, including white and brown adipose tissues and skeletal muscle, also express the FGF21 gene (14), and PPARγ activation has been reported to induce FGF21 gene expression in white adipocytes (14, 15). On the basis of cell culture studies, muscle cells have been proposed to be capable of releasing FGF21 (16).
BAT is the main site of nonshivering thermogenesis in rodents and human neonates, and recent data indicate a role for BAT in adult humans (17). BAT is an active site of glucose and lipid consumption, especially when thermogenic activation requires high metabolic fuel oxidation to sustain heat production.
In the present study, we have shown that BAT, in addition to being an FGF21 target, responds to thermogenic activation by producing FGF21 and is thus a major source of FGF21. This response is mediated by a powerful cAMP-mediated pathway, which regulates FGF21 gene transcription in response to noradrenergic stimulation.
EXPERIMENTAL PROCEDURES
Animals, Determination of FGF21 Output by BAT, and FGF21 Half-life
Mice and rats were cared for and used in accordance with European Community Council Directive 86/609/EEC. Swiss adult male mice, as well as adult male PPARα-null mice (129S4/SvJae-Pparatm1Gonz/J) and their wild-type adult littermates (controls), were used for cold-exposure experiments. Where indicated, mice were exposed to a 4 °C environment temperature for 6 h, 24 h, or 30 days or kept at 29 °C (thermoneutral control). Mice were killed by decapitation. Interscapular BAT, epididymal WAT, and liver were dissected and frozen in liquid nitrogen. Plasma was obtained after the centrifugation of heparinized blood. FGF21 output was directly assessed by measuring arteriovenous differences across the interscapular BAT of rats, following methods described previously (18). Briefly, male Wistar rats that had been kept for 3 weeks at 29 °C (thermoneutral control) environment temperature or were exposed to 4 °C for 24 h or 30 days were anesthetized with sodium barbital (50 mg/kg body weight, intraperitoneally). For each rat, 150–200 μl of blood was obtained from the Sulzer's vein, which drains blood flowing through interscapular BAT, and from the abdominal aorta. Blood samples were centrifuged to obtain plasma and hematocrit was determined. BAT subsequently was frozen in liquid nitrogen. Blood flow to interscapular BAT was measured using 46Sc-labeled microspheres (mean diameter of 15 μm, PerkinElmer Life Sciences) essentially as described previously (19, 20). Blood flow rates was used to calculate the total FGF21 output, defined as the product of the individual arteriovenous differences for blood flow for each experimental group, corrected for the percentage of plasma in total blood established from the hematocrit data. FGF21 half-life was determined from the curves of decay of mouse 125I-FGF21 in plasma from rats in the three conditions of temperature environment using the WinNonlin software tool (Pharsight). Male Wistar rats (50–60 days old) were injected intraperitoneally with 1 μCi of 125I-FGF21 (Phoenix Pharmaceuticals)/rat dissolved in 500 μl of saline. Blood samples (40 μl) were obtained via direct puncture of the saphenous vein at 30 min, 1 h, 2 h, 3 h, 6 h, 9 h, and 12 h after injection. Plasma was prepared, and protein was precipitated by addition of tricholoroacetic acid (one-tenth of the plasma volume of 1:1 (w/v) trichloroacetic acid). Radioactivity in the precipitate was counted using a γ-counter (Packard Cobra II). FGF21 protein levels in mouse and rat plasma, as well as in brown adipocyte and HIB-1B cell culture medium, were determined by ELISA (Phoenix Secretomics).
Cell Culture and Treatments
Brown adipocytes were differentiated in primary culture as reported previously (21). On the eighth day of cell culture, when brown adipocytes had maximally differentiated, cells were treated, when indicated, with 0.5 μm norepinephrine, 1 mm dibutyryl cAMP, 1 μm isoproterenol, 20 μm H89, 10 μm SB202190, 10 μm propanolol, 10 μm prazosin, 1 μm GW7647, 10 μm rosiglitazone, 30 μm GW9662, or 10 μm GW6471, as indicated. For knockdown of gene expression of ATF2, siRNA duplex specific for mouse ATF2 (catalog no. sc-29756, Santa Cruz Biotechnology) were transfected to mouse brown adipocytes using transfection reagent (catalog no. sc-29528, Santa Cruz Biotechnology) and following the procedures indicated by the supplier.
RNA Isolation and Real-time Quantitative PCR
RNA from tissues and cells was extracted using the RNeasy kit (Qiagen), and the levels of FGF21 mRNA were determined by quantitative RT-PCR using the corresponding TaqMan Assay-on-demand probes for the mouse (Mm00840165) and rat (Rn00590706) FGF21 transcripts and the ABI/Prism 7500 Sequence Detector System (Applied Biosystems). Each sample was run in duplicate, and the mean value of the duplicate was normalized to that of the 18 S rRNA gene using the comparative (2−ΔCT) method.
Plasmid Constructs and Transient Transfection
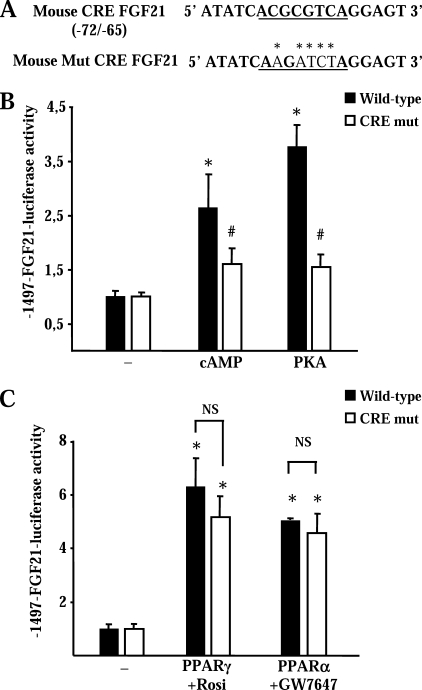
The plasmid −1497-FGF21-Luc, containing a DNA fragment corresponding to −1497 to +5 in the 5′ region of the mouse FGF21 gene linked to the luciferase reporter gene, was a kind gift from D. Mangelsdorf and S. Kliewer (3). The −1497-CREmut-FGF21-Luc point mutant construct was generated using a QuikChange site-directed mutagenesis kit (Stratagene). The complementary oligonucleotide harboring the desired mutation contained the sequence AGA instead of CGC at site −69 to −72 and TCT instead of GTC at site −66 to −68 in the FGF21 gene 5′ region (Fig. 5A). Transfection experiments were carried out in the HIB-1B, BAT-derived cell line and using the FuGENE transfection reagent (Roche Diagnostics). Transfections contained 0.3 μg/well of luciferase plasmid, and each transfection condition was assayed in triplicate in a 24-well plate. Where indicated, expression plasmids for a constitutively active form of protein kinase A (PKA; 22), a constitutively active form of MMK6 (MKK6-Glu, Addgene plasmid 13518), and a dominant-negative form of MKK6 (MKK6-K82A, Addgene plasmid 13519) (23) were co-transfected (0.06 μg/well). The pRL-CMV expression plasmid for the sea pansy (Renilla reniformis) luciferase (1.2 ng/well) was used as an internal transfection control (Promega). Cells were incubated for 48 h after transfection, and where indicated, they were treated with 1 mm dibutyryl cAMP for 24 h before harvesting. Firefly luciferase and Renilla luciferase activities were measured in a Turner Designs luminometer (TD 20/20) using the Dual-Luciferase Reporter Assay system (Promega, Madison, WI). Luciferase activity elicited by FGF21 promoter constructs was normalized for variation in transfection efficiency using Renilla luciferase as an internal standard.
FIGURE 5.
Identification of a CRE in the FGF21 gene promoter. A, sequence of the CRE region and mutated sequence (asterisks) in the CRE-mut construct. B and C, HIB-1B cells were transfected with a wild-type FGF21 promoter construct (−1497-FGF21-Luc) or the CRE-mutated version (−1497-CRE mut FGF21-Luc), and relative luciferase activity was measured. B, effects of treatment with 1 mm dibutyryl cAMP (cAMP) or co-transfection of the constitutively active forms of PKA. C, effects of co-transfected PPARγ expression vector plus rosiglitazone (Rosi) and of co-transfected PPARα expression vector plus GW7647. Data are means ± S.E. of five to six independent experiments, each performed in triplicate. Statistically significant differences between promoter activity in the presence or absence of cAMP, PKA, PPARγ, or PPARα for each construct are denoted by an asterisk (p < 0.05), and those between the wild-type and the CRE-mutated construct for each condition are denoted by # (p < 0.05). NS indicates nonsignificant differences between the bars indicated by brackets.
Chromatin Immunoprecipitation Assays
Chromatin immunoprecipitation in brown adipocytes and HIB-1B cells was performed using the Magna Chip kit (Millipore). HIB-1B cells were transfected with −1497-FGF21-Luc or −1497-CRE mut FGF21-Luc. ChIP assay in BAT was performed as described (24). Chromatin samples were immunoprecipitated with an anti-ATF2 antibody (20F1), an anti-cAMP response element binding protein (CREB) antibody (48H2) (Cell Signaling), or unrelated immunoglobulin (Santa Cruz Biotechnology). Input DNA and immunoprecipitated DNA were analyzed by quantitative PCR using SYBR Green fluorescent dye. The protein-bound DNA was calculated as a ratio to input DNA. Bound fragments were amplified by PCR (35 cycles of 30 s at 95 °C, 30 s at 60 °C, and 30 s at 72 °C) and visualized electrophoresing on a 2% agarose gel with ethidium bromide staining. Primers sequences used for amplifying a 126-bp fragment encompassing the putative cAMP-responsive elements (CRE) in the FGF21 gene were 5′-CATTGCATCATCCGTCCA-3′ (forward) and 5′-CCCAGAATTTATACCCAGACAGG-3′ (reverse).
Statistical Analysis
A Student's t test was used to test the level of significance of the differences between means and to test whether arteriovenous differences were significantly different from zero. Pearson's correlation data were determined where indicated.
RESULTS
Thermogenic Activation Increases Plasma FGF21 Levels and Induces FGF21 Gene Expression in BAT through PPARα-independent Mechanisms
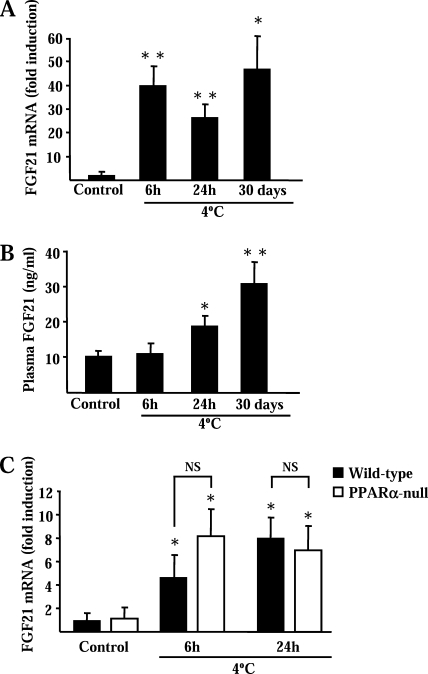
Exposure of Swiss mice to a 4 °C environment for 6 or 24 h caused a marked increase (∼40-fold) in FGF21 mRNA levels in BAT (Fig. 1A). Chronic acclimation to 4 °C over 30 days also resulted in a significantly induction of FGF21 mRNA. In contrast, FGF21 mRNA levels were not increased significantly in the livers of mice acutely exposed to cold and were even reduced in mice acclimated to cold during a 30-day exposure (Table 1). In WAT, cold exposure caused a modest increase in FGF21 mRNA levels only in 24-h cold-exposed mice (see Table 1). Thus, whereas FGF21 mRNA levels in BAT with suppressed thermogenic activity (thermoneutral) were lower than in liver and WAT, after thermogenic activation, BAT shows the highest levels of FGF21 mRNA expression. Plasma levels of FGF21 in mice were not modified significantly after a 6-h cold exposure but were increased after a 24-h cold exposure and more markedly increased after a 30-day cold-acclimation period (Fig. 1B). To determine whether cold-dependent induction of the FGF21 gene expression in BAT requires PPARα, a major controller of FGF21 gene expression that is highly expressed in BAT (25), we performed parallel experiments in PPARα-null mice and wild-type littermates (Fig. 1C). FGF21 mRNA was significantly induced in wild-type mice although to a lower extent respect to Swiss mice. The induction of FGF21 mRNA levels by cold exposure was similar in the presence and absence of PPARα.
FIGURE 1.
Cold exposure induces FGF21 mRNA expression in BAT and increases plasma FGF21 levels in mice and effects of PPARα gene invalidation. Effects of exposure of Swiss mice (A and B), or PPARα-null mice and wild-type littermates (C), to 4 °C. Results are means ± S.E. of five to nine mice/group. Statistically significant differences between mice at a thermoneutral temperature (control) and cold-exposed mice for each genotype are shown as *, p < 0.05 and **, p < 0.01. NS, indicates nonsignificant differences between the bars indicated by brackets.
TABLE 1.
FGF21 mRNA levels in BAT, liver, and WAT from Swiss mice exposed to a 4 °C environment temperature during the indicated time
Results are expressed as FGF21 mRNA levels relative to 18 S rRNA × 10−6 (see “Experimental Procedures”). The effects due to cold exposure are also shown as the fold-change respect to FGF21 mRNA levels in control mice at thermoneutral temperature. Data are means ± S.E. from five to nine mice/group. Statistically significant differences respect to controls in each tissue are indicated as *, p < 0.05 and **, p < 0.01, and those between tissues in the same environment temperature condition are indicated as #, p < 0.05.
| BAT | Liver | WAT | |
|---|---|---|---|
| Thermoneutral (29 °C) | 0.4 ± 0.1 | 8.6 ± 3.0# | 3.9 ± 0.9# |
| 4 °C for 6 h | 16.8 ± 3.3 (× 40-fold)** | 9.5 ± 4.3 (× 1.1-fold) | 11.7 ± 3.1 (× 3-fold) |
| 4 °C for 24 h | 10.4 ± 2.0 (× 26-fold)** | 23.3 ± 11.2 (× 2.7-fold) | 31.9 ± 8.6 (× 8.2-fold)* |
| 4 °C for 30 days | 18.8 ± 5.2 (× 47-fold)* | 2.6 ± 0.17 (× 0.3-fold)*,# | 1.5 ± 0.2 (× 0.4-fold)# |
Norepinephrine and cAMP Increase FGF21 Gene expression and FGF21 Release by Brown Adipocytes
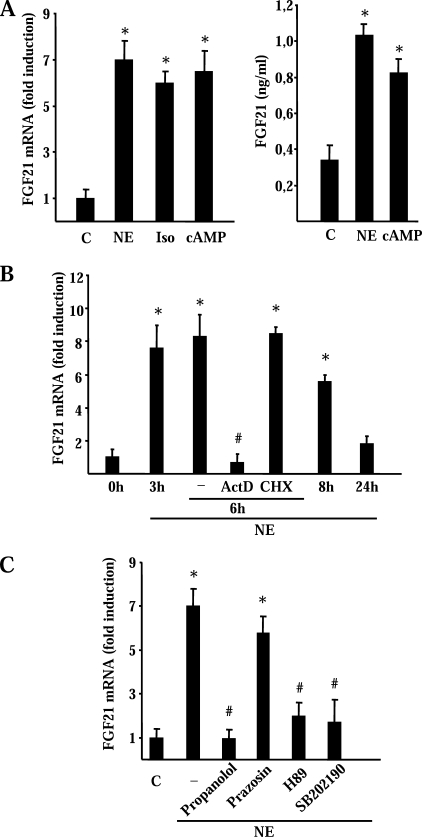
To gain insight into the mechanisms that mediate the induction of FGF21 gene expression in response to cold, we studied differentiated brown adipocytes in culture. Norepinephrine, the main mediator of cold-induced thermogenic activation of BAT (25), caused a marked increase in FGF21 mRNA levels (Fig. 2A, left). The β-adrenergic activator isoproterenol caused a similar induction, and the same response was observed in brown adipocytes treated with dibutyryl cAMP (Fig. 2A, left). The induction of FGF21 gene expression by norepinephrine or cAMP in brown adipocytes led to a significant increase in the release of FGF21 protein into the cell culture medium (Fig. 2A, right).
FIGURE 2.
Effects of a noradrenergic stimulus on FGF21 mRNA expression and FGF21 release by brown adipocytes. A, differentiated brown adipocytes in culture were treated with norepinephrine (NE), isoproterenol (Iso), or dibutyryl cAMP (cAMP). Cells were harvested 6 h later (A, left). Cell culture medium was collected 24 h after treatments (A, right). Data are means ± S.E. of relative FGF21 mRNA levels or FGF21 protein in the cell culture medium. Statistically significant differences between the effects of drugs and vehicle control (C, control) are denoted by an asterisk (p < 0.05). B, differentiated brown adipocytes in culture were treated with norepinephrine, and cells were harvested at the indicated times thereafter. Where indicated, 50 μm cycloheximide (CHX) or 1 μm actinomycin D (ActD) were added to the cell cultures. Cells were harvested 6 h later. Data are means ± S.E. of relative FGF21 mRNA levels. Statistically significant differences (p < 0.05) between norepinephrine-treated and untreated cells at each time after addition of NE (0 h) are denoted by an asterisk (p < 0.05), and those between actinomycin D + norepinephrine or cycloheximide + norepinephrine and norepinephrine treatment alone are denoted by # (p < 0.05). C, effects of the adrenergic inhibitors (propanolol and prazosin), the PKA inhibitor (H89), and the p38 MAPK inhibitor (SB202190) on the induction of FGF21 mRNA by norepinephrine. Differentiated brown adipocytes in culture were treated with norepinephrine and the indicated inhibitors for 6 h (see “Experimental Procedures” for concentration data). Data are means ± S.E. of relative FGF21 mRNA levels. Statistically significant differences between the effects of drugs and vehicle control (C, control) are denoted by an asterisk (p < 0.05) and those between drugs + norepinephrine and norepinephrine alone are denoted by # (p < 0.05). Data are means ± S.E. of four to five independent experiments done in duplicate.
The time course of the norepinephrine effects revealed a rapid and powerful induction after a few hours of treatment (Fig. 2B). Norepinephrine-induced FGF21 gene expression was dependent on active transcription, as there were no effects of norepinephrine on FGF21 mRNA levels when brown adipocytes were treated with actinomycin D (Fig. 2B). However, the effect of norepinephrine did not require protein synthesis because norepinephrine caused a significant induction of FGF21 mRNA levels in the presence of the protein synthesis inhibitor cycloheximide (Fig. 2B).
Treatment of cells with propanolol, a β-adrenergic antagonist, suppressed the effects of norepinephrine on FGF21 gene expression whereas prazosin, an α-adrenergic inhibitor, had no effect (Fig. 2C). H89, a specific inhibitor of PKA, suppressed the induction of FGF21 gene expression by norepinephrine. SB202190, an inhibitor of p38 MAPK, also blocked the action of norepinephrine on FGF21 gene expression.
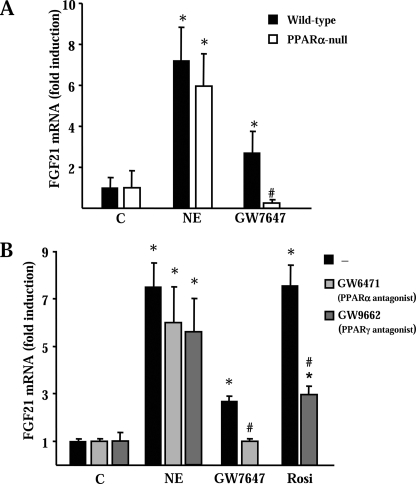
To further investigate the potential role of PPARα in the action of norepinephrine, we performed parallel experiments using primary cultures of brown adipocytes derived from PPARα-null mice. Acquisition of a differentiated brown adipocyte morphology was unaltered in PPARα-null brown adipocytes, and expression of brown adipocyte differentiation marker genes was also unchanged, in accordance with previous reports (26) (data not shown). Norepinephrine induced a similar increase in FGF21 mRNA levels in wild-type and PPARα-null brown adipocytes. Predictably, FGF21 gene expression was induced by the specific PPARα activator GW7647 in wild-type brown adipocytes but not in PPARα-null brown adipocytes (Fig. 3A).
FIGURE 3.
Effects of PPARα and PPARγ on noradrenergic activation of FGF21 mRNA expression in brown adipocytes. A, differentiated brown adipocytes from either wild-type or PPARα-null mice were treated for 6 h with norepinephrine (NE) or with PPARα agonist GW7647 for 24 h. Error bars indicate the means ± S.E. of relative FGF21 mRNA levels. Significant differences between nontreated cells for each genetic background respect each treatment condition are denoted by an asterisk (p < 0.05), and those between wild-type and PPARα-null cells for each treatment condition are indicated with # (p < 0.05). B, differentiated brown adipocytes in culture were treated with norepinephrine for 6 h and rosiglitazone (Rosi) or the indicated agonists/antagonist for 24 h (see “Experimental Procedures” for concentration data). Data are means ± S.E. of relative FGF21 mRNA levels. Statistically significant differences between the effects of NE and vehicle control (C, control) are denoted by an asterisk (p < 0.05). Significant differences due to the addition of antagonists to norepinephrine, GW7647, or rosiglitazone are denoted by # (p < 0.05). Data are means ± S.E. of four to five independent experiments done in duplicate.
A parallel approach using specific antagonists was used to investigate a potential role for PPARα and PPARγ in norepinephrine effects. Neither the PPARα antagonist GW6471 nor the PPARγ antagonist GW9662 significantly attenuated the effect of norepinephrine on FGF21 gene expression (Fig. 3B). However, activation of PPARα or PPARγ with GW7647 or rosiglitazone, respectively, increased FGF21 mRNA levels. As expected, specific PPARα and PPARγ inhibitors suppressed the induction in FGF21 mRNA levels elicited by PPARα and PPARγ specific activators.
Collectively, these results indicate that norepinephrine acts through β-adrenergic receptors to increase cAMP levels, causing cAMP-mediated activation of PKA and p38 MAP kinase pathways and inducing FGF21 gene expression. Although the FGF21 gene is sensitive to PPARα- and PPARγ-dependent activation in brown adipocytes, these nuclear receptors are not required for the action of norepinephrine.
FGF21 Gene Transcription Is Activated through a cAMP-responsive, ATF2-binding Element in FGF21 Gene Promoter
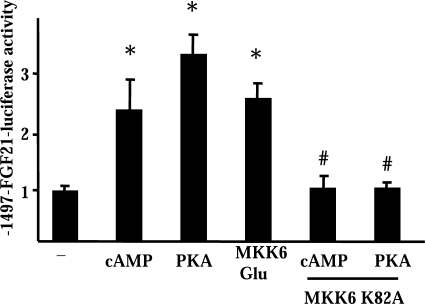
To investigate the mechanisms that regulate FGF21 gene transcription, we used cells of the brown adipocyte-derived cell line HIB-1B. In these cells, treatment with dibutyryl cAMP increased significantly the levels of FGF21 mRNA (see Fig. 6B) and caused a significant (2.4 + 0.3-fold, p < 0.01) induction of FGF21 protein release to the medium. These cells were transfected with a luciferase reporter construct driven by a 1497-bp fragment of the 5′-noncoding region of the FGF21 gene promoter. Treatment with dibutyryl cAMP caused a significant increase in FGF21 promoter activity, as did co-transfection with an expression plasmid for a constitutively active form of PKA (Fig. 4). Considering the important role of p38 MAPK in PKA-dependent gene expression in brown adipocytes (27), we co-transfected cells with a constitutively active form of MKK6 (MKK6-Glu), the upstream inducer of p38 MAPK (23), and we observed a significant induction of the FGF21 promoter activity (Fig. 4). Moreover, co-transfection with a dominant-negative form of MKK6, MKK6-K82A, completely blocked the capacity of cAMP or PKA to activate the FGF21 gene promoter (Fig. 4). From these results, we conclude that the p38 MAPK pathway is essential for the PKA-mediated activation of FGF21 gene transcription.
FIGURE 6.
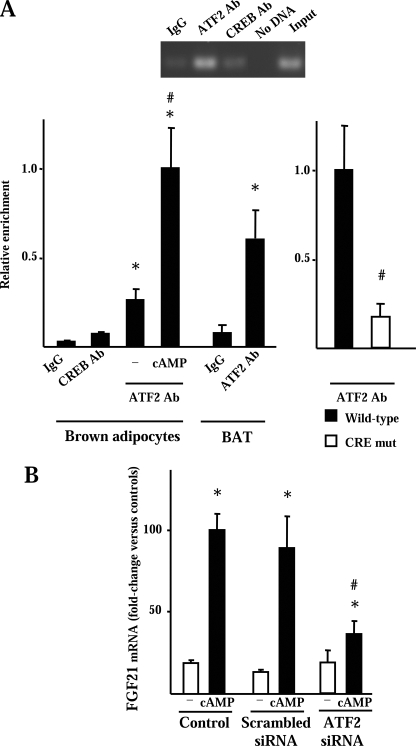
ATF2 mediates cAMP-dependent induction of FGF21 gene transcription. A, chromatin immunoprecipitation of the proximal CRE-containing region of the FGF21 gene using the indicated antibodies. Top, representative example of PCR amplification. Bottom, quantification of relative enrichment in brown adipocyte primary cultures and BAT by the indicated antibodies (left) and quantitative assessment of the relative enrichment of the proximal FGF21 promoter region after chromatin immunoprecipitation of HIB-1B cells transfected with the wild-type or the CRE-mutated versions of the FGF21 promoter-luciferase reporter constructs (right). Data are means ± S.E. of three independent experiments. Statistical significant differences is denoted by an asterisk (p < 0.05), and those between the presence or absence of cAMP (left) or between the wild-type and the CRE-mutated construct (right) are denoted by # (p < 0.05). B, FGF21 mRNA expression in response to dibutyryl cAMP (cAMP) in brown adipocytes previously treated with siRNA for ATF2, scrambled siRNA, or without treatment (control). Data are means ± S.E. of three independent experiments performed in duplicate. Statistically significant differences between presence or absence of cAMP are denoted by an asterisk (p < 0.05), and those between control and ATF2 siRNA cells are denoted by # (p < 0.05).
FIGURE 4.
Transcriptional regulation of the FGF21 gene promoter by cAMP-mediated signaling. Relative luciferase activity of the FGF21 promoter construct (−1497-FGF21-Luc) in HIB-1B cells following treatment with dibutyryl cAMP (cAMP), co-transfection of the constitutively active forms of PKA or MKK6 (MKK6-Glu), or co-transfection of the dominant-negative form of MKK6 (K82A). Data are means ± S.E. of at least five to six independent experiments done in triplicate. Statistically significant differences between the presence or absence of cAMP, PKA, or MKK6-Glu are denoted by an asterisk (p < 0.05), and those due to the effect of the dominant-negative MKK6-K82A are denoted by # (p < 0.05).
Computer-assisted analysis of the 5′-noncoding region of the FGF21 gene (MathInspector) led to the identification of a proximal site (−72/−65) with a sequence similar to CRE (Fig. 5A). In HIB-1B cells transfected with a version of the FGF21 gene promoter construct in which this sequence was mutated, cAMP and PKA failed to induce an increase in FGF21 promoter activity (Fig. 5B). Parallel experiments were performed in which a PPARα or PPARγ expression vector was co-transfected with the wild-type or CRE-mutated versions of the FGF21 promoter construct. In the presence of their ligands, both PPARα and PPARγ stimulated the activity of the wild-type and CRE-mutated promoter constructs to a similar extent (Fig. 5C).
The binding of ATF2, a transcription factor known to act via CREs to mediate the response of gene transcription to cAMP in brown adipocytes (27), was analyzed using chromatin immunoprecipitation assays. In primary cultures of brown adipocytes as well as in BAT, chromatin immunoprecipitation revealed strong binding of ATF2 to the FGF21 gene promoter region (Fig. 6A, left). Exposure of brown adipocytes to cAMP caused an increase in the extent of ATF2 binding to the FGF21 promoter (Fig. 6A, left). CREB, another potential mediator of cAMP-dependent transcriptional regulation in BAT, showed negligible binding to the FGF21 endogenous gene promoter. In HIB-1B cells, chromatin immunoprecipitation of a transfected FGF21 promoter construct revealed specific enrichment in the ATF2 binding to the promoter. This binding was reduced significantly in cells transfected with the cAMP-insensitive mutated version of the FGF21 promoter (Fig. 6A, right). Finally, to establish the role of ATF2 in the regulation of the FGF21 gene expression, ATF2 expression was lowered using siRNA-mediated interference in brown adipocytes. It resulted in a remaining expression of ATF2 after interference of 32% of control values and led to a strong impairment in the extent of FGF21 mRNA induction by cAMP (Fig. 6B).
In Vivo Assessment of FGF21 Production by BAT Using Arteriovenous Differences in Plasma FGF21 Levels across Interscapular BAT
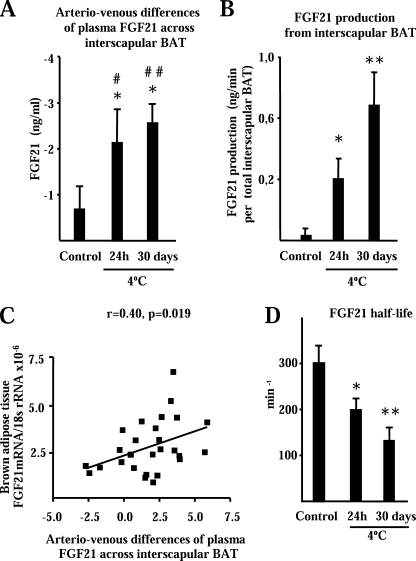
To assess the physiological consequences of FGF21 gene induction by thermogenic activation of BAT, we determined arteriovenous differences in FGF21 plasma levels across interscapular BAT from rats under distinct cold-exposure conditions. In rats maintained at a thermoneutral temperature (controls), arteriovenous differences in FGF21 plasma levels across interscapular BAT were not significantly different from zero (Fig. 7A). In contrast, both acute cold exposure (24 h) and long term acclimation to cold for 30 days led to significant negative values for arteriovenous differences in FGF21 concentration, indicating significant FGF21 output from interscapular BAT.
FIGURE 7.
In vivo assessment of FGF21 production by BAT using determination of arteriovenous differences in plasma FGF21 concentrations across interscapular BAT, and FGF21 half-life. Effects of distinct themogenic activation conditions. A, arteriovenous differences in FGF21 across interscapular BAT. Arteriovenous differences that are statistically different from zero are denoted by an asterisk (p < 0.05). Statistically significant differences between control and cold-exposed groups are denoted by # (p < 0.05) and # # (p < 0.01). B, total FGF21 production by interscapular BAT. Statistically significant differences respect to controls are shown as *, p < 0.05 and **, p < 0.05. C, correlation of arteriovenous FGF21 concentration differences and FGF21 mRNA levels in interscapular BAT in rats under the distinct environment temperature conditions shown in A. D, effects of environment conditions on FGF21 half-life. Statistically significant differences respect to controls are shown as *, p < 0.05 and **, p < 0.05. Results are means ± S.E. of 9–12 rats/group in A–C and 4 rats/group in D.
In this experimental setting, blood flow across interscapular BAT was 0.11 + 0.04 ml/min in control rats maintained at a thermoneutral temperature, 0.29 + 0.01 ml/min in rats exposed to 4 °C for 24 h, and 0.77 ml/min + 0.13 ml/min in rats kept at 4 °C for 30 days. The blood flow rate was significantly higher in acute cold-exposed and long term cold-acclimated rats (p = 0.005 and p = 0.003, respectively) compared with control rats at a thermoneutral temperature. Using blood flow data to calculate total FGF21 production, we found that FGF21 output by interscapular BAT was significant in 24 h cold-exposed rats and even stronger in rats that had been acclimated to a cold environment for 30 days; in this latter group, FGF21 output by interscapular BAT reached 0.7 ng/min (Fig. 7B). As in mice, FGF21 mRNA were induced strongly in the BAT of rats after acute (24 h) cold exposure and chronic acclimation to cold (30 days). Fig. 7C shows the significant correlation between the extent of FGF21 output and FGF21 mRNA expression levels in BAT in the overall population of rats under distinct thermogenic activation conditions (controls, acute cold exposure, and long term cold acclimation). FGF21 half-life was assessed in thermoneutral and thermogenic activated conditions. Mouse FGF21 half-life in thermoneutral conditions was somewhat higher than human FGF21 half-life determined in rodents kept at room temperature (28). Both acute and chronic cold exposure caused a marked reduction in FGF21 half-life (Fig. 7D).
DISCUSSION
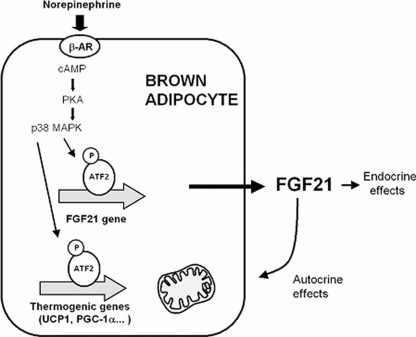
The present study identifies brown adipose tissue as a site of systemic FGF21 production after thermogenic activation. We observed that cold exposure causes a rise in plasma FGF21 levels, a dramatic induction of FGF21 gene expression in BAT and a marked release of FGF21 by BAT in vivo. This occurs through noradrenergic control of FGF21 gene transcription, a novel regulatory pathway of regulation of FGF21 gene expression (Fig. 8).
FIGURE 8.
Schematic representation of the role of BAT as a source of FGF21 after thermogenic activation and potential endocrine and autocrine effects. The schema summarizes present findings and previous data from Refs. 12 and 27.
Norepinephrine, via β-adrenergic receptors, induces the transcription of the FGF21 gene via a cAMP-dependent, PKA- and p38 MAPK-mediated mechanism that involves an ATF2 binding site in the proximal region of the FGF21 gene promoter. This noradrenergic, cAMP-mediated pathway, for controlling FGF21 gene expression does not require PPARs, although PPARα- and PPARγ-dependent regulation of the FGF21 gene remains intact in BAT. The involvement of PKA and subsequent activation of p38 MAPK in the noradrenergic regulation of FGF21 gene transcription, and the role of ATF2 as a major mediator, are similar to previously established pathways for the noradrenergic regulation of thermogenic genes (i.e. UCP1) in brown adipocytes (27).
An important finding is that thermogenic activation not only induces FGF21 gene expression in BAT and FGF21 release by brown adipocytes in vitro, but it also leads to an increase in plasma FGF21 levels and a dramatic increase in the level of FGF21 release by BAT in vivo, as demonstrated by arteriovenous difference experiments. Whereas WAT is recognized as a site of release of multiple regulatory proteins (e.g. adipokines and cytokines), BAT is often thought to play a minor endocrine role, as exemplified by its low expression and release of leptin and adiponectin (25). A notable exception is triiodothyronine, which is released into the circulation by BAT, but not by WAT, under conditions of thermogenic stimulus through activation of the BAT-specific type II 5′-deiodinase (18, 29). Our present findings identify BAT as an active site of release of FGF21 under thermogenic activation conditions. The reduction in FGF21 half-life in rats in conditions of cold stress highlights the relevance of BAT as a site of enhanced FGF21 production, especially when considering the strong down-regulation of FGF21 expression in liver in conditions of long term cold exposure.
Cold exposure improves glucose tolerance and stimulates glucose uptake in peripheral tissues, primarily by increasing glucose oxidation via insulin-independent pathways (30). Moreover, cold exposure causes increased lipolysis in WAT and enhanced lipid uptake and ketogenesis in the liver (31). These metabolic processes are known targets of FGF21 action (1, 8, 10). Recently, FGF21 has been reported to act directly in brain and to increase by this means hepatic insulin sensitivity and energy expenditure in obese rats (32). It is tempting to propose that the high levels of FGF21 released by BAT under conditions of thermogenic activation act upon target peripheral tissues and/or brain to ensure increased glucose uptake and appropriate mobilization of metabolic substrates to fulfill the increased energy requirements in a cold environment. Further research will be necessary to demonstrate this hypothesis.
The extent of BAT activity usually is associated with a healthy metabolic profile in rodent models and correlates negatively with obesity and insulin resistance (33). The intrinsic energy expenditure processes that occur in thermogenically active BAT usually are claimed to account for this effect, but a regulatory role for active BAT as a source of the anti-diabetic FGF21 protein cannot be excluded. This may be especially relevant if present studies in rodents are confirmed in adult humans, in which the small amounts of active BAT may hardly account for a large fraction of the overall energy expenditure (17). If the limited amounts of existing BAT in adult humans have an endocrine-like, FGF21-producing role, even moderate amounts of active BAT could affect overall metabolic regulation through the systemic release and systemic glucose utilization-promoting action of FGF21.
On the other hand, an autocrine effect of the FGF21 released by BAT after thermogenic activation is also likely, similarly to what is known to occur in the liver in other physiological situations. FGF21 induces glucose uptake and oxidation as well as thermogenic activation in brown adipocytes (12). It is likely that, when brown fat thermogenesis is activated and FGF21 release is increased, the autocrine action of FGF21 contributes to increase the thermogenic activity of BAT. In the neonatal period, when BAT thermogenesis is activated strongly and BAT is responsive to FGF21 of hepatic origin (12), FGF21 expression also is strongly activated in BAT3 consistent with the notion that autocrine action supports the enhancement of BAT thermogenesis.
In summary, we report for the first time that BAT is an active site of FGF21 production and that this process is enhanced in response to the thermogenic stimuli through noradrenergic induction of FGF21 gene transcription. Collectively, the present findings lead to the proposal of a novel endocrine role of BAT, as a source of the hormone factor FGF21.
Acknowledgments
We gratefully acknowledge R. Davis for providing the MKK6(glu) and MKK6(K82A), S. A. Kliewer and D. J. Mangelsdorf for the FGF21 promoter plasmid, and H. Colom (Unit of Phamacokinetics, Faculty of Pharmacy, University of Barcelona) for advice in FGF21 half-life analysis.
This work was supported by grants from Ministerio de Ciencia e Innovación (SAF2008-01896), the Instituto de Salud Carlos III (PI081715), and the Generalitat de Catalunya (Spain) (2009SGR284).
E. Hondares and F. Villarroya, unpublished observations.
- WAT
- white adipose tissue
- BAT
- brown adipose tissue
- PPAR
- peroxisome proliferator-activated receptor
- Luc
- luciferase
- PKA
- protein kinase A
- CRE
- cAMP-responsive element(s).
REFERENCES
- 1. Kharitonenkov A., Shiyanova T. L., Koester A., Ford A. M., Micanovic R., Galbreath E. J., Sandusky G. E., Hammond L. J., Moyers J. S., Owens R. A., Gromada J., Brozinick J. T., Hawkins E. D., Wroblewski V. J., Li D. S., Mehrbod F., Jaskunas S. R., Shanafelt A. B. (2005) J. Clin. Invest. 115, 1627–1635 [DOI] [PMC free article] [PubMed] [Google Scholar]
- 2. Inagaki T., Dutchak P., Zhao G., Ding X., Gautron L., Parameswara V., Li Y., Goetz R., Mohammadi M., Esser V., Elmquist J. K., Gerard R. D., Burgess S. C., Hammer R. E., Mangelsdorf D. J., Kliewer S. A. (2007) Cell Metab. 5, 415–425 [DOI] [PubMed] [Google Scholar]
- 3. Badman M. K., Pissios P., Kennedy A. R., Koukos G., Flier J. S., Maratos-Flier E. (2007) Cell Metab. 5, 426–437 [DOI] [PubMed] [Google Scholar]
- 4. Gälman C., Lundåsen T., Kharitonenkov A., Bina H. A., Eriksson M., Hafström I., Dahlin M., Amark P., Angelin B., Rudling M. (2008) Cell Metab. 8, 169–174 [DOI] [PubMed] [Google Scholar]
- 5. Berglund E. D., Li C. Y., Bina H. A., Lynes S. E., Michael M. D., Shanafelt A. B., Kharitonenkov A., Wasserman D. H. (2009) Endocrinology 150, 4084–4093 [DOI] [PMC free article] [PubMed] [Google Scholar]
- 6. Coskun T., Bina H. A., Schneider M. A., Dunbar J. D., Hu C. C., Chen Y., Moller D. E., Kharitonenkov A. (2008) Endocrinology 149, 6018–6027 [DOI] [PubMed] [Google Scholar]
- 7. Xu J., Lloyd D. J., Hale C., Stanislaus S., Chen M., Sivits G., Vonderfecht S., Hecht R., Li Y. S., Lindberg R. A., Chen J. L., Jung D. Y., Zhang Z., Ko H. J., Kim J. K., Véniant M. M. (2009) Diabetes 58, 250–259 [DOI] [PMC free article] [PubMed] [Google Scholar]
- 8. Badman M. K., Koester A., Flier J. S., Kharitonenkov A., Maratos-Flier E. (2009) Endocrinology 150, 4931–4940 [DOI] [PMC free article] [PubMed] [Google Scholar]
- 9. Potthoff M. J., Inagaki T., Satapati S., Ding X., He T., Goetz R., Mohammadi M., Finck B. N., Mangelsdorf D. J., Kliewer S. A., Burgess S. C. (2009) Proc. Natl. Acad. Sci. U.S.A. 106, 10853–10858 [DOI] [PMC free article] [PubMed] [Google Scholar]
- 10. Hotta Y., Nakamura H., Konishi M., Murata Y., Takagi H., Matsumura S., Inoue K., Fushiki T., Itoh N. (2009) Endocrinology 150, 4625–4633 [DOI] [PubMed] [Google Scholar]
- 11. Arner P., Pettersson A., Mitchell P. J., Dunbar J. D., Kharitonenkov A., Rydén M. (2008) FEBS Lett. 582, 1725–1730 [DOI] [PubMed] [Google Scholar]
- 12. Hondares E., Rosell M., Gonzalez F. J., Giralt M., Iglesias R., Villarroya F. (2010) Cell Metab. 11, 206–212 [DOI] [PMC free article] [PubMed] [Google Scholar]
- 13. Mai K., Andres J., Biedasek K., Weicht J., Bobbert T., Sabath M., Meinus S., Reinecke F., Möhlig M., Weickert M. O., Clemenz M., Pfeiffer A. F., Kintscher U., Spuler S., Spranger J. (2009) Diabetes 58, 1532–1538 [DOI] [PMC free article] [PubMed] [Google Scholar]
- 14. Muise E. S., Azzolina B., Kuo D. W., El-Sherbeini M., Tan Y., Yuan X., Mu J., Thompson J. R., Berger J. P., Wong K. K. (2008) Mol. Pharmacol. 74, 403–412 [DOI] [PubMed] [Google Scholar]
- 15. Moyers J. S., Shiyanova T. L., Mehrbod F., Dunbar J. D., Noblitt T. W., Otto K. A., Reifel-Miller A., Kharitonenkov A. (2007) J. Cell Physiol. 210, 1–6 [DOI] [PubMed] [Google Scholar]
- 16. Izumiya Y., Bina H. A., Ouchi N., Akasaki Y., Kharitonenkov A., Walsh K. (2008) FEBS Lett. 582, 3805–3810 [DOI] [PMC free article] [PubMed] [Google Scholar]
- 17. Enerbäck S. (2010) Cell Metab. 11, 248–252 [DOI] [PubMed] [Google Scholar]
- 18. Fernandez J. A., Mampel T., Villarroya F., Iglesias R. (1987) Biochem. J. 243, 281–284 [DOI] [PMC free article] [PubMed] [Google Scholar]
- 19. Foster D. O., Frydman M. L. (1979) Can J. Physiol. Pharmacol. 57, 257–270 [DOI] [PubMed] [Google Scholar]
- 20. Jones R. G., Williamson D. H. (1984) Biosci. Rep. 4, 421–426 [DOI] [PubMed] [Google Scholar]
- 21. Carmona M. C., Hondares E., Rodríguez de la Concepción M. L., Rodríguez-Sureda V., Peinado-Onsurbe J., Poli V., Iglesias R., Villarroya F., Giralt M. (2005) Biochem. J. 389, 47–56 [DOI] [PMC free article] [PubMed] [Google Scholar]
- 22. Muramatsu M., Kaibuchi K., Arai K. (1989) Mol. Cell Biol. 9, 831–836 [DOI] [PMC free article] [PubMed] [Google Scholar]
- 23. Raingeaud J., Whitmarsh A. J., Barrett T., Dérijard B., Davis R. J. (1996) Mol. Cell Biol. 16, 1247–1255 [DOI] [PMC free article] [PubMed] [Google Scholar]
- 24. Villena J. A., Hock M. B., Chang W. Y., Barcas J. E., Giguère V., Kralli A. (2007) Proc. Natl. Acad. Sci. U.S.A. 104, 1418–1423 [DOI] [PMC free article] [PubMed] [Google Scholar]
- 25. Cannon B., Nedergaard J. (2004) Physiol. Rev. 84, 277–359 [DOI] [PubMed] [Google Scholar]
- 26. Petrovic N., Shabalina I. G., Timmons J. A., Cannon B., Nedergaard J. (2008) Am. J. Physiol. Endocrinol. Metab. 295, E287–296 [DOI] [PubMed] [Google Scholar]
- 27. Collins S., Cao W., Robidoux J. (2004) Mol. Endocrinol. 18, 2123–2131 [DOI] [PubMed] [Google Scholar]
- 28. Xu J., Stanislaus S., Chinookoswong N., Lau Y. Y., Hager T., Patel J., Ge H., Weiszmann J., Lu S. C., Graham M., Busby J., Hecht R., Li Y. S., Li Y., Lindberg R. A., Véniant M. M. (2009) Am. J. Physiol. Endocrinol. Metab. 297, E1105–1114 [DOI] [PubMed] [Google Scholar]
- 29. Silva J. E., Larsen P. R. (1985) J. Clin. Invest. 76, 2296–2305 [DOI] [PMC free article] [PubMed] [Google Scholar]
- 30. Bukowiecki L. J. (1989) Can J. Physiol. Pharmacol. 67, 382–393 [DOI] [PubMed] [Google Scholar]
- 31. Lansberg L., Young J. B. (1983) in Autonomic Regulation of Thermogenesis: Mammalian Thermogenesis (Girardier L., Stock M. J. eds) pp. 99–140, Champan and Hall, New York [Google Scholar]
- 32. Sarruf D. A., Thaler J. P., Morton G. J., German J., Fischer J. D., Ogimoto K., Schwartz M. W. (2010) Diabetes 59, 1817–1824 [DOI] [PMC free article] [PubMed] [Google Scholar]
- 33. Seale P., Kajimura S., Spiegelman B. M. (2009) Genes Dev. 23, 788–797 [DOI] [PMC free article] [PubMed] [Google Scholar]


