

Abstract
Parkinson disease is characterized cytopathologically by the deposition in the midbrain of aggregates composed primarily of the presynaptic neuronal protein α-synuclein (AS). Neurotoxicity is currently attributed to oligomeric microaggregates subjected to oxidative modification and promoting mitochondrial and proteasomal dysfunction. Unphysiological binding to membranes of these and other organelles is presumably involved. In this study, we performed a systematic determination of the influence of charge, phase, curvature, defects, and lipid unsaturation on AS binding to model membranes using a new sensitive solvatochromic fluorescent probe. The interaction of AS with vesicular membranes is fast and reversible. The protein dissociates from neutral membranes upon thermal transition to the liquid disordered phase and transfers to vesicles with higher affinity. The binding of AS to neutral and negatively charged membranes occurs by apparently different mechanisms. Interaction with neutral bilayers requires the presence of membrane defects; binding increases with membrane curvature and rigidity and decreases in the presence of cholesterol. The association with negatively charged membranes is much stronger and much less sensitive to membrane curvature, phase, and cholesterol content. The presence of unsaturated lipids increases binding in all cases. These findings provide insight into the relation between membrane physical properties and AS binding affinity and dynamics that presumably define protein localization in vivo and, thereby, the role of AS in the physiopathology of Parkinson disease.
Keywords: Amyloid, Neurological Diseases, Parkinson Disease, Phospholipid Vesicle, Protein Structure, Dual-emission probes, ESIPT, Environment-sensitive Probes, Stopped-flow Kinetics
Introduction
Parkinson disease (1) is the second most common neurodegenerative disease, characterized primarily by the functional loss of dopaminergic neurons in the substantia nigra of the midbrain. Although the precise causes of cell death are unknown, the misfolding and aggregation of the abundant neuronal protein, α-synuclein (AS),4 in Parkinson disease pathogenesis is almost certainly involved (2–4).
This protein forms amyloid-like fibrils, which constitute the major component of pathological intraneuronal protein deposits denoted Lewy bodies. The physiological functions of AS are unclear, but it has been associated with vesicle trafficking (5–7) and fatty acid metabolism (8).
AS is a small (140 amino acids, 15 kDa) negatively charged, natively disordered protein lacking a distinct secondary structure in solution (9). However, the N-terminal two-thirds of the sequence adopts a helical conformation (α11/3) upon interaction with artificial membranes (10–12) whereas the cross-β-sheet conformation is characteristic of the amyloid fibrillar forms of the protein (Fig. 1). The α-helix-forming region spans seven imperfect 11-residue repeats, six of which contain a highly conserved motif, XKTK(E/Q)GVXXXX (Fig. 1). The membrane-binding domain overlaps with the hydrophobic NAC region (residues 61–95), which serves to initiate aggregation (13). The C terminus, in contrast to the positively charged N terminal and the NAC regions, is rich in acidic residues and prevents protein aggregation (14, 15).
FIGURE 1.

Design of labeled AS mutants. A, schematic representation of AS sequence and secondary structure. Labeling positions (Ala-to-Cys mutations) are marked by triangles. R denotes imperfect repeats, XKTK(E/Q)GVXXXX. Familiar mutations are indicated by arrows. B, structure of the MFE label.
Membrane interactions are believed to be essential to the function(s) of AS in the cell (16), because the protein is localized in close proximity to synaptic vesicles and binds to the inner mitochondrial membrane (17). Furthermore, AS-membrane interactions have been reported to play a role in Parkinson disease pathology (16, 18, 19). For example, there is compelling evidence suggesting that low molecular AS aggregates or oligomers disrupt membranes and/or induce the formation of ion channels (20, 21), possibly leading to cellular and mitochondrial membrane depolarization (22). Due to their high affinity for AS, membranes are important factors in protein localization and rate of aggregation. Experiments in vitro show that depending on membrane composition (charge, acyl chain saturation), lipids either accelerate (23–25) or inhibit (26) AS fibrillation.
Early studies showed that the binding of AS to extracts of brain tissue lipid membranes did not require the presence of other proteins (27), and therefore AS also binds readily to artificial membranes (4, 27–30). Because the lipophilic N-terminal part of AS is positively charged, the protein has a preference for anionic membranes (28). Microscopy of DOPC giant unilamellar vesicles (29) and circular dichroism (CD) measurements in the presence of POPC vesicles (30) have not detected AS interaction with neutral membranes, whereas calorimetry (DPPC) (31, 32) and Fluorescence Correlation Spectroscopy (FCS) (POPC) (28, 33) have shown moderate degrees of binding. The effects of the membrane phase and curvature on AS binding are still a subject of discussion (4). It has been reported that AS interacts preferentially with membranes in the liquid disordered (Ld) phase (29, 34–36). However, there are instances in which AS demonstrates a higher affinity for rigid and raftlike domains (27, 37). Microcalorimetry (isothermal titration calorimetry) indicates that binding of AS to neutral small unilamellar vesicles (SUVs) in the gel phase is stronger than to membranes in the liquid disordered phase (31). High membrane curvature was reported to be essential for AS binding to DPPC vesicles (31), but this effect was not observed in the POPC/POPS system (28). Such disagreement is probably due to the use of lipids with different polar headgroups that influence the charge and curvature of membranes. AS binds preferentially to membranes composed of lipids with smaller polar headgroups (e.g. phosphatidic acids) (38), probably due to higher surface energy (more defects).
High resolution NMR reveals that AS bound to small (∼5 nm) SDS detergent micelles forms two antiparallel α-helices (residues 3–37 and 45–92) (39). However, the conformation of AS on lipid membranes is still a subject of discussion. Some EPR reports suggest a broken-helix conformation (40, 41) similar to that of the micelle-bound protein (42), whereas others show an extended α-helix for residues 9–90 (43, 44), a finding that is also supported by single molecule FRET measurements (45, 46).
Most studies devoted to AS interaction with membranes have been focused on particular lipidic systems without taking membrane diversity into account. Thus, the discrepant results and interpretations may reflect compositional issues as well as differences in key experimental parameters, such as lipid/protein ratio (47) and membrane charge (35).
In this study, we addressed systematically the effects of different membrane properties on the thermodynamics and kinetics of AS-membrane interaction by employing environment-sensitive dyes that by virtue of their inherent sensitivity, allowed operation under close-to-native conditions (concentration and temperature). Fluorophores of 3-hydroxyflavone family undergo an excited state intramolecular proton transfer (ESIPT) that leads to the appearance of a second tautomeric (T*) emission band (48, 49). The intensity ratio of the normal (N*) and tautomeric bands is highly sensitive to the environment properties (50, 51). Diethylamino-3-hydroxyflavone (FE) discriminates between protic and aprotic environments as well as different membrane types (48, 51–53) and thus constitutes a promising tool for monitoring protein-membrane association (54). We have previously reported that FE reveals differences in the supramolecular organization of amyloid fibrils (55) and the utility of a related ESIPT probe (FC) as a reporter of AS aggregation (56).
In this investigation, we constructed a new Cys-reactive probe based on FE, which we introduced into the AS molecule in each of three alternative positions (positions 18, 90, and 140) spanning the protein sequence (Fig. 1). These constructs were used in a series of equilibrium and kinetic studies to establish the key membrane parameters that determine the binding of AS.
EXPERIMENTAL PROCEDURES
Protein Expression and Purification
α-Synuclein and its cysteine variants (A18C, A90C, and A140C) were expressed and purified from Escherichia coli as described elsewhere (56) (for preparation details, see supplemental material). The protein was ultracentrifuged each time before use, and its concentration was estimated from the absorbance at 275 nm using a molar extinction coefficient of 5600 m−1 cm−1.
Synthesis of N-(2-[4-(Diethylamino)phenyl]-3-hydroxy-4-oxo-4H-chromen-6-yl)-4-(2,5-dioxo-2,5-dihydro-1H-pyrrol-1-yl)propanamide (MFE) Label
MFE dye was obtained as the product of the reaction of N-β-maleimidopropionic acid with 4′-diethylamino-3-hydroxy-6-aminoflavone. The precursor 4′-diethylamino-3-hydroxy-6-aminoflavone was obtained by oxidative cyclization of the 5′-acetamido-2′-hydroxyacetophenone and 4-diethylaminobenzaldehyde followed by hydrolysis as described elsewhere (54). See supplemental material for details.
Protein Labeling
To 1 ml of a 0.2 mm solution of A18C mutant of WT AS in 25 mm Na-PO4 buffer, pH 7.2, 1 mg (15-fold excess) of MFE in 0.5 ml of DMSO was added. The reaction was left for 48 h at 4 °C with mixing. The excess of the dye and DMSO were removed by dilution of the reaction mixture with buffer (to 12 ml) and filtration of the solution through an Amicon Ultracel filter (10 kDa) to obtain 1 ml of crude labeled protein. The derivatized protein was purified by size exclusion chromatography (Pharmacia Smart, Superdex 200HR 10/30 SEC column, 25 mm Na-PO4, pH 6.2) and concentrated with an Amicon Ultracel filter to 0.8 ml. The final labeled protein solution was 0.16 mm and had a labeling efficiency of >90%, as determined from the absorbance of the FE dye (ϵ430 = 32,000 m−1 cm−1). The overall recovery was ∼70%. The MFE derivatives of the A90C and A140C mutants were prepared by the same procedure.
Preparation of LUVs and SUVs
All lipidic components were purchased in lyophilized form or in CHCl3 solution from Avanti Polar Lipids (Birmingham, AL). Stock solutions of 2–5 mm were prepared in CHCl3 and stored in glass vials at −20 °C. Aliquots of the appropriate amounts of the stock solutions were mixed in clean glass vials, and the CHCl3 was removed under a gentle stream of nitrogen. The lipids were placed under vacuum for at least 1 h to ensure complete removal of residual CHCl3 and then rehydrated in 25 mm Na-PO4, pH 6.5, 150 mm NaCl, to a final concentration of 1–2 mm lipid in the form of MLVs. Large unilamellar vesicles (LUVs) were prepared by extrusion through polycarbonate films (Nucleopore) in a hand-held extruder (Avanti Polar Lipids). The MLV suspension was first reduced in size by seven passages through a large (1-μm) pore size filter. The suspension was then passed 10 times through a filter with a 0.1-μm pore size. For preparation of SUVs, the hydrated lipid solution was sonicated (Kontes Micro cell disrupter, 70–80% power) for 1 h. The resulting colloidal solution was centrifuged 15 min at 15,000 × g to remove traces of metallic particles arising from the tip. The preparations of SUVs and LUVs were performed at temperatures 5–15 °C above the transition points. The size of all vesicles was determined by DLS using a Zetasizer Nano ZS equipped with a 633-nm laser (Malvern Instruments). The measured diameter of all LUVs was 110 ± 10 nm, whereas the mean size of SUVs varied in the range 35–60 nm, depending on composition. The vesicles were used within 2 days of preparation but were found to be structurally stable for at least 2 weeks (LUVs) or 5 days (SUVs) when stored at 4 °C. For vesicles composed of more than one type of lipid, all given percentages are based on relative molar composition.
Spectroscopy
Unless otherwise indicated, all measurements were performed at 37 °C in 25 mm Na-PO4 buffer, pH 6.5, 150 mm NaCl.
Circular Dichroism Measurements
CD spectra were obtained with a Jasco J-720 spectropolarimeter. The protein concentration was 2–10 μm for WT and 2 μm for the labeled mutants. Spectra were recorded using a 2-mm path length cuvette, scanning from 200 to 250 nm with a step size of 0.2 nm and a scanning speed of 20 nm/min. The spectra represent averages of three scans and were corrected for the background from buffer and protein-free vesicles. For the determination of α-helical conformation, the 222 ± 0.2 nm signal was averaged and corrected for dilution.
Fluorescence
Emission and excitation spectra were recorded with a Cary Eclipse spectrofluorimeter (Varian), equipped with a thermally controlled cuvette holder. The protein concentration was 100 nm. The spectra were corrected for wavelength-dependent sensitivity and background light scattering. The fluorescence quantum yields were determined using a reference solution of 4′-diethylamino-3-hydroxyflavone in ethanol (quantum yield 0.51) (49).
Determination of Affinity Constants
The affinities of AS for different artificial membranes were determined by titration of 100 nm protein solutions with 0.1–2 mm solutions of vesicles (depending on the affinity). We avoided lipid/protein ratios less than 10 to prevent vesicle disruption (see supplemental material). The proteins with the fluorescent label at the three positions were compared. The binding curves were fitted to the equation,
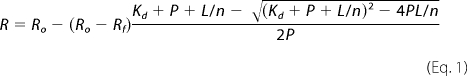 |
where R is the measured signal (emission intensity, corrected for dilution) at a given lipid concentration, L is the total lipid concentration, P is the total concentration of the protein, Kd is the apparent macroscopic dissociation equilibrium constant, and n is the binding stoichiometry (lipids/protein). Rf and Ro are the final (corrected for dilution) and initial signals, respectively. This equation assumes that all binding sites are equivalent and that Kd does not depend on the lipid/protein ratio. The tight binding to anionic lipids (Kd < P ≈ 100 nm) could not be satisfactorily described by this model. In this case, the binding stoichiometry was evaluated as 2L50/P, where L50 is the concentration of lipids corresponding to 50% binding of AS. For comparison of the binding to different membranes, we used L50, which approximates Kd for low affinity systems.
Competition Experiment
The emission spectrum of AS in membranes depends on the lipid composition and therefore could be used as a signature of the protein bound to known types of membrane in competitive assays. The affinity of AS for membranes of two different compositions was compared directly by the addition of the protein to a solution containing an excess of vesicles of both types and comparing the resulting emission spectrum with that of AS bound to each component separately. In a typical experiment, 100 nm AS was added to a solution containing 200 μm DPPC and DOPG SUVs (2000 lipids/protein). The observed spectrum is a weighted sum of the individual spectra of protein bound to DOPG and DPPC,
where FDPPC,λ and FDOPG,λ are reference spectra of the protein in DPPC and DOPG SUVs, respectively, and a is the molar fraction of AS bound to DPPC SUVs (supplemental Fig. S1). Because both lipids were present in the solution in the same concentration, the ratio a/(1 − a) is equal to the ratio of the corresponding dissociation equilibrium constants for AS, KDOPG/KDPPC. This method works well for comparison of protein binding to two types of membranes with high and comparable affinities. If the preference of the protein for one of the membranes is much higher than for the other (a < 0.1 or a > 0.9), the method provides only a qualitative assessment of which system has the higher affinity.
Binding Kinetics
All kinetic measurements were performed on an SX.18MV stopped-flow system (Applied Photophysics). For measurements of the kinetics of AS binding to membranes, equal volumes of a 0.5 μm solution of the protein and 100 μm SUVs were mixed to give a final protein concentration of 250 nm and a lipid-to-protein ratio of 200. The buffer (25 mm Na-PO4, pH 6.5, 150 mm NaCl) and temperature (37 °C) were the same as for the spectroscopic measurements. Reactions were monitored by fluorescence using 420 ± 4 nm excitation. Emission was collected with a 525 ± 25 nm band pass filter. Fluorescence was sampled in a 0.02–1-ms interval (logarithmic scale); the dead time of device was 2 ms. 6–10 kinetic curves were recorded for each sample and fitted after averaging by Origin software to the monoexponential model,
where F(t) is the fluorescence intensity as a function of time (t); Fo and Ff are the fluorescence of free and membrane-bound AS, respectively; k is the apparent reaction rate constant; and s is an apparent shift between the mixing/initiation time and the start of the recording (typically, s ≈ 0.1 ms). Most of the curves were satisfactory fitted to this model (R2 > 0.98). In a few cases (see Table 1), the presence of an additional slower (k < 0.2 s−1) component corresponding to <20% of the fluorescence changes was detected, and biexponential fitting was employed.
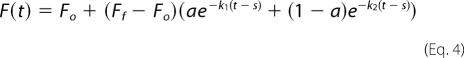 |
TABLE 1.
Binding parameters of AS to SUVs
All measurements were performed at 37 °C in 25 mm Na-PO4, pH 6.2, 150 m NaCl, and 0.1 μm AS. SUV diameter was 40 ± 5 nm. Mt is a phase transition temperature of the membranes composed of corresponding lipids. Kd is the apparent dissociation constant expressed in total lipid concentration, n is the binding stoichiometry. kapp is the apparent reaction rate constant measured at 0.25 μm AS and 50 μm lipid. ND, not determined.
| Name | Acyl chains | Mt | Kd (or L50) | n | kapp |
|---|---|---|---|---|---|
| °C | μm | lipids/AS | s−1 | ||
| Neutral (zwitterionic) | |||||
| DSPC | 18:0 | 55 | 14 ± 3 | 300 ± 30 | ND |
| DPPC | 16:0 | 41 | 16 ± 3 | 300 ± 30 | 1.1 ± 0.1a |
| DMPC | 14:0 | 23 | >600b | ND | ND |
| DOPC | 18:1 | <0 | 74 ± 15 | 500 ± 100 | 1.4 ± 0.2 |
| POPC | 16:0, 18:1 | <0 | 300 ± 70b | <6000 | ND |
| Negatively charged | |||||
| DPPG | 16:0 | 41 | 7 ± 1 | 100 ± 10 | 47 ± 10 |
| DOPG | 18:1 | <0 | 1.5b | 30 ± 10c | >700a |
| POPG | 16:0, 18:1 | <0 | 6 ± 1b | 120 ± 30c | ND |
| Mixtures of lipids | |||||
| DOPC/DOPG (3:1) | 18:1 | <0 | 20 ± 5 | 200 ± 50 | 150 ± 5 |
| DOPC/DOPG (1:1) | 18:1 | <0 | 2.0 ± 0.6 | 140 ± 40 | 330 ± 30 |
| DOPC/DOPG (1:3) | 18:1 | <0 | 2.0 ± 0.3b | 40 ± 10c | 500 ± 70 |
a Also observed a slower process with relatively small changes of fluorescence intensity.
b L50 values, concentration of lipids for 50% binding of 0.1 μm AS.
c Binding could not be described by equivalent binding site model; thus, a saturating lipid/protein ratio was estimated as 2 × L50/[AS].
Protein Migration between Membranes
Experiments and data analyses were performed as in the binding kinetic measurements. A typical protocol was as follows. 0.2 μm AS-18MFE was preincubated with an excess of DPPC SUVs (240 μm, 1200 lipid/protein) and mixed in the stopped-flow device with a solution of DOPG lipids of the same concentration. For recording of the initial fluorescence level (Fo), the solution of DOPG was substituted by buffer.
RESULTS
AS Labeling and Label Characterization
We characterized the new reactive ESIPT label (MFE) and determined that it preserved the spectral properties of the parent fluorophore (50). In aprotic media, the label shows a two-band emission spectra with a shape highly dependent on polarity. In contrast, only a single low intensity emission band from the hydrated form of the dye is observed in water (Fig. 2A).
FIGURE 2.

Fluorescence spectra of MFE. A, spectra in buffer and some aprotic solvents (dioxane and acetonitrile). Dye concentration was 1 μm. B, emission spectra of AS with MFE label at positions 18, 90, and 140 in the absence (thin lines) and in the presence (thick lines) of an excess of DOPG vesicles. Experiments were performed at 37 °C in 25 mm Na-PO4, pH 6.5, 150 mm NaCl. Excitation was at 420 nm. a.u., arbitrary units.
Attachment of the MFE label to the three AS cysteine mutants (18C, 90C, and 140C) led to the increase of the fluorescence quantum yield compared with the free probe in water. The single-band emission profile indicated high water accessibility in all cases (Fig. 2B). Upon membrane binding, the fluorescence intensity increased, and the label exhibited two emission bands (Fig. 2B). These changes can be attributed to a decrease in environmental hydration and polarity (51). The amplitude of the spectral changes was greatest for AS-18MFE, and this mutant was used in most of the quantitative studies.
Comparison of the Affinity of Labeled and WT AS
AS adopts an α-helical conformation upon membrane binding (10). Titration of wild type and labeled Cys mutants with DOPG and DOPG/DOPC (1:1) SUVs and monitoring conformational changes by CD allowed an estimate of α-helical content from the characteristic band at 222 nm. All four proteins showed almost identical binding profiles and very similar final CD spectra (Fig. 3), indicating that the introduced label did not significantly perturb membrane binding affinity or protein conformation. As observed previously for the MFC label (56), the flexible linker and the relatively small size of the probe help to minimize the effect of the labeling on the protein properties.
FIGURE 3.

Titration of AS by DOPG SUVs. Conformation changes of WT AS (□) and AS-18MFE (○) monitored by mean residue ellipticity. No significant difference was observed between spectra of labeled and unlabeled protein. The inset shows representative CD spectra of initial (dashed line, free protein) and final (line of open squares, protein in the presence of 100 eq of lipids) conditions. Experiments were performed at 37 °C for 2 μm protein in 25 mm Na-PO4, pH 6.5, 150 mm NaCl. CD data <205 nm were discarded because of excessive noise.
Role of Membrane Charge
The addition of vesicles composed of negatively charged DOPG to the solution of AS-18MFE led to a dramatic increase of fluorescence intensity and the appearance of the two bands characteristic for the label in an aprotic environment (Fig. 4). Titration of the labeled protein by neutral SUVs led to similar results, but saturation occurred at higher lipid concentration, in accordance with previous FCS measurements (28). The influence of membrane surface charge was assessed with SUVs composed of mixtures of neutral (DOPC) and negatively charged (DOPG) lipids in different ratios (Fig. 4B). The affinity of AS for neutral membranes was ∼3% of that observed for SUVs consisting of an equimolar mixture of DOPC and DOPG (mean charge = −0.5). Binding stoichiometry of AS to neutral DOPC was ∼500 lipids/protein, as opposed to ∼30 in the case of the negatively charged DOPG (Fig. 4B). The binding isotherm for anionic vesicles was complex, prompting the introduction of the parameter L50, the concentration of lipids at which 50% of the protein was bound, for comparative purposes (Fig. 4C and Table 1).
FIGURE 4.

Influence of membrane surface charge on AS interaction. A, fluorescence emission spectra of AS-18MFE in buffer (dashed and dotted line) or in the presence of neutral (DOPC, gray) or negatively charged (DOPG, black) SUVs (solid lines) and LUVs (dashed lines). Lipid and protein concentrations were 100 μm and 100 nm, respectively. B, titration of AS-18MFE by SUVs composed of DOPG/DOPC mixtures containing 0% (□), 25% (○), 50% (△), and 100% (♢) of negatively charged DOPG. Lines are fits of the data by Equation 1, assuming equivalent binding sites. CAS = 200 nm. C, dependence of the concentration of lipids needed for 50% AS binding on membrane charge (CAS = 100 nm). Shown are means of at least three measurements ± 2 maximal differences. All experiments were performed at 37 °C in 25 mm Na-PO4, pH 6.5, 150 mm NaCl. Excitation was at 420 nm.
Role of Membrane Curvature
The interactions of AS-18MFE were studied using LUVs (diameter ∼100 nm) and SUVs (diameter ∼40 nm). In addition, we compared the influence of neutral (DOPC) and charged (DOPG) lipids with the two systems. AS bound readily to SUVs composed of DOPC or DOPG (Fig. 4 and Table 1); decreasing the membrane curvature (LUVs) had no perceptible effect in the case of negatively charged membranes but strongly reduced the binding to neutral vesicle (Fig. 4A). No significant binding of AS to neutral 100-nm LUVs composed of POPC, DMPC, and DPPC was observed up to a 1 mm lipid concentration. Our results are consistent with a recent report of AS selectivity for highly curved artificial membranes (33), except that we did not observe a significant influence of curvature in the case of vesicles with >25% of negatively charged lipid (DOPC/DOPG and DOPC/DOPS systems).
Influence of Membrane Phase
The effect of lipid bilayer phase on AS binding was examined by using the thermal phase transitions of membranes composed of saturated lipids. At 37 °C, the emission of AS-18MFE in the presence of SUVs composed of zwitterionic DMPC lipids was identical to that of the free probe (Fig. 5A), indicating that AS did not significantly bind to membranes under these conditions. Cooling led to a strong increase in fluorescence and the appearance of a dual band emission in the range 19–25 °C (the phase transition of a DMPC bilayer has a midpoint (Mt) of ∼23 °C). The same phenomenon occurred with SUVs composed of DPPC but was displaced to 37–43 °C (Mt ∼ 41 °C). The fluorescence of the free AS-18MFE was unaffected by changes in temperature (Fig. 5B). Our binding results correlate well with data for the folding of AS into α-helical form in DPPC systems below the phase transition temperature (37). Evidently, AS has a much greater affinity for neutral membranes in the gel than in the Ld phase. This difference was not manifested in the case of negatively charged membranes. In fact, the DPPG membranes did not show sharp changes of MFE fluorescence intensity and, therefore, of affinity for the protein at Mt ∼ 41 °C (Fig. 5B). Moreover, disordered membranes composed of DOPG lipids had a much greater affinity for AS than rigid DPPG bilayers. We conclude that the Ld to gel phase transition of membranes increases the affinity of AS for zwitterionic SUVs but has an opposite or minor effect in the case of anionic SUVs.
FIGURE 5.

AS discriminates lipid phase. A, fluorescence spectra of AS-18MFE (200 nm) in the presence of DMPC SUVs (0.2 mm) as a function of the temperature. The sharp increase corresponds to the range of membrane melting temperature (23 °C). B, temperature dependence of the integral fluorescence intensities of AS-18MFE in buffer (□) and in the presence of DPPG (♢, Mt ∼ 41 °C), DMPC (△, Mt ∼ 23 °C), and DPPC (○, Mt ∼ 41 °C) SUVs. The experiment was performed by decreasing the temperature of a solution. All measurements were performed in 25 mm Na-PO4, pH 6.2, 150 mm NaCl. SUV diameter was 40 ± 5 nm. a.u., arbitrary units.
Role of Unsaturated Fatty Acids
The presence of double bonds in the fatty acyl chains decreases membrane rigidity and the phase transition temperature. We examined the influence of acyl chain saturation on AS binding with SUVs that persisted in the Ld phase at 37 °C: DMPC, POPC, and DOPC, containing 0, 1, and 2 double bonds per phospholipid, respectively.
AS interacted with SUVs composed of DOPC and POPC with a moderate affinity but did not significantly bind to DMPC at 37 °C (Table 1). Whereas in the case of DOPC, the ratio of 600 lipids/protein was sufficient for supporting the binding of 50% of the protein, in the case of DMPC, only less than 2% of the AS was bound under the same conditions (Table 1). The charge, curvature, and phase of DOPC, POPC, and DMPC membranes are similar. Thus, we attribute the gradual increase in binding to the lower lipid packing density and reduced screening of the apolar region in the case of unsaturated lipids. In addition, the binding of AS to DOPC SUVs (Ld) was much lower than to DPPC (gel), indicating a stronger influence of the lipid phase on AS binding to neutral SUVs than of the presence of double bonds. In other words, a different mechanism may be involved in the binding of AS to rigid membranes of high curvature (31).
Due to the high affinity of AS for all negatively charged membranes, an assessment of acyl chain effects based on direct titration was not feasible. Thus, we used a competition approach. AS was added to a solution containing equal amounts of SUVs composed of DOPG and POPG (both of them in excess over protein). The resulting emission spectrum was close to that of the protein bound to DOPG, implying a greater affinity for this type of SUVs than for those composed of POPG (supplemental Fig. S1). Thus, unsaturated fatty acids increase the binding affinity of AS to membranes, but the effect is less significant than that of the membrane charge, curvature, and phase.
Effect of the Cholesterol on AS Binding
Cholesterol is an important component of cellular membranes (57, 58) and also affects the binding of AS to membranes and the rate of AS aggregation (59, 60). We analyzed the effect of cholesterol on the AS-membrane binding. The presence of cholesterol (33%) in neutral SUVs led to a decrease both in the number of binding sites per lipid molecule and in affinity (Fig. 6). However, only an insignificant diminution of AS affinity was observed in the case of negatively charged membranes (Fig. 6B), an effect that could be attributed to a decrease of the membrane surface charge density. Thus, it appears that the cholesterol does not significantly modify the binding of AS to charged membranes.
FIGURE 6.

Effect of cholesterol on AS binding to SUVs. A, comparison of the binding of AS to DOPC and DOPC/cholesterol (Ch) (2:1) SUVs. Binding was monitored by the increase of the fluorescence quantum yield of AS-18MFE (I/I0). Curves correspond to the fitting of the data by Equation 1. 50% protein binding occurs at a lipid/protein ratio of 560 ± 30 and 1200 ± 200 for DOPC and DOPC/Ch, respectively. B, effect of the addition of 33% (molar) cholesterol to membranes on affinity for AS, expressed as 1/L50 (L50 is a concentration of lipid corresponding to 50% binding of 100 nm AS; see “Experimental Procedures”). Experiments were performed at 37 °C in 25 mm Na-PO4, pH 6.5, 150 mm NaCl.
Binding Stoichiometry
Protein interactions with membranes are characterized by affinity and surface coverage. If the binding of each protein molecule is independent, the interaction can be described as a simple bimolecular reaction between the protein and a virtual “binding site” constituted by n lipid molecules. In such a case, a change in the fraction of bound protein fraction upon the addition of lipids should be described by Equation 1. The interaction of AS with neutral SUVs was in good agreement with this model (Figs. 4B and 6A). The binding site for DOPC and DPPC membranes was calculated to be in the range of 300–500 lipids/protein (Table 1). Taking into account that one lipid molecule occupies about 0.7 nm2 of the bilayer surface (61), we estimated that AS binds SUVs with a density of 1 molecule/140 nm2. The size of AS (140-amino acid protein in α-helical conformation) is about 10-fold smaller (close to 14 × 1.1 nm) (39). In the case of cholesterol-containing lipids, the surface density of AS is even smaller (∼500 nm2/molecule), corresponding to a surface coverage of <5%.
Surprisingly, AS covers negatively charged membranes much more efficiently than neutral membranes. The stoichiometry varied in the range of 30–100 lipids/protein, corresponding to ∼15–50 nm2/protein. The lower value is very close to the surface occupied by the α-helix formed by the protein (39). In other words, AS can cover <10% of the surface in the case of neutral SUVs but >30% of negatively charged membranes. The high density of AS on the membrane partially neutralizes surface charge, such that the binding affinity for successive molecules depends on the extent of membrane coverage. As a consequence, the binding of AS to negatively charged membranes, in contrast to neutral membranes, cannot be adequately described by the equivalent sites model. An alternative view is that the binding modes of AS to zwitterionic and anionic vesicles are different. The C terminus of AS, in particular, would be repelled by the anionic phospholipids, thereby affecting the effective interactive surface of the protein and allowing a higher packing density on negatively charged vesicles.
Kinetics of AS Interaction with Lipid Vesicles
ESIPT probes are ideal for monitoring the kinetics of binding and conformational transition by rapid chemical kinetic techniques. We measured the association of AS with charged and neutral membranes by fluorescence stopped flow. In most cases, a monoexponential course of increasing fluorescence intensity ensued after mixing vesicles with AS-18MFE (Fig. 7), although some membrane compositions also exhibited at least one relatively slow component (10–100 s). For an initial comparison of the AS binding rates to membranes of different composition, we determined a pseudo-first-order reaction rate constant measured at 0.25 μm protein and 50 μm lipid concentrations. Negatively charged SUVs interacted with AS in the 1–20 ms range, consistent with the reported AS exchange rate in SDS micelles (10 ms) measured by 19F NMR (62). The binding to neutral SUVs was much slower, in the range of seconds, and the reaction rates and binding affinities were not linearly related (Table 1). The rate of AS binding to anionic vesicles also depends on membrane phase, being much faster for lipids in the Ld phase (Table 1).
FIGURE 7.

Kinetic analysis of AS interaction with membranes. A, kinetics of the AS-18MFE interaction with DPPG SUVs. Line, monoexponential fit of the experimental points (k = 53 s−1, R2 = 0.96). The fluorescence intensity curve was normalized between 0 (free protein fluorescence) and 1 (maximal mean fluorescence). Experimental conditions as in Table 1. B, reversibility of AS interaction with DMPC SUVs. The protein was mixed with vesicles at 15 °C and then heated to 37 °C. Dissociation was monitored by changes in integral fluorescence intensity. After 2000 s, the sample was cooled to 15 °C for ∼5 min to restore protein binding and then again heated to 37 °C. The first 2 min of the curves after the temperature change were discarded to avoid effects of temperature inhomogeneity in the sample. All measurements were performed in 25 mm Na-PO4, pH 6.2, 150 mm NaCl. a.u., arbitrary units.
Reversibility of Membrane Binding
The reversibility of AS/membrane binding was explored with DMPC SUVs for which the affinity for AS changes by about 2 orders of magnitude across the phase transition (∼23 °C). Upon the addition of AS-18MFE to a solution of DMPC SUVs at 15 °C, almost complete binding ensued (Fig. 5). Heating this solution beyond the DMPC phase transition led to a gradual dissociation of the protein from the membrane, characterized by a rate constant of ∼0.001 s−1. Cooling to 15 °C restored protein binding. Successive cooling/heating cycles demonstrated the reversibility of AS association and the maintenance of membrane integrity in the process (Fig. 7B).
The dissociation of AS from membranes at constant temperature was monitored by protein migration to SUVs with a higher affinity. The MFE label provided a unique fluorescence signature of the protein bound to membranes of a given composition, allowing the monitoring of the AS migration by changes in the emission spectrum. In the presence of DPPC SUVs at a lipid/protein ratio of 2000:1, AS was completely bound. The addition of DOPG SUVs (that bind AS much strongly than DPPC) led to a progressive change in fluorescence, and the final emission spectrum corresponded to the AS-18MFE bound to DOPG (Fig. 8A). The presence of an isoemissive point indicates a transition between two states. Nevertheless, the kinetics of AS migration from DPPC to DOPG is complex, consisting of fast (∼1 s) and slow (∼100 s) phases (Fig. 8B). The slow component was not observed during migration from membranes in the Ld phase. Migration was always to membranes exhibiting the higher affinity for AS, leading to the ranking POPC < DOPC < DPPC < DPPG < POPG < DOPG, at a fixed temperature (37 °C).
FIGURE 8.

AS migration between SUVs. A, fluorescence of AS in the presence of saturating concentration of DPPC (black solid line) and time course changes of the fluorescence upon the addition DOPG. The final spectrum overlaps with spectrum of the protein emission in the presence of DOPG alone (dashed line). B, stopped flow kinetics of AS migration from DPPC to DOPG measured by N* band emission (525 ± 25 nm). Concentration of AS-18MFE, 0.1 μm; all lipids were in excess (120 μm). All experiments were performed at 37 °C in 25 mm Na-PO4, pH 6.5, 150 mm NaCl. Excitation was at 420 nm. Curve corresponds to a biexponential fit of experimental points (k1 = 1.0 s−1; k2 = 7.5 s−1). a.u., arbitrary units.
DISCUSSION
Increased levels of AS in neurons induce a defect in the reclustering of synaptic vesicles after endocytosis (6) and endoplasmic reticulum-Golgi vesicle trafficking (5). Membranes of synaptic vesicles are significantly different from normal cellular membranes, being composed of lipids with long polyunsaturated fatty acid chains (63), and have high curvature (diameter ∼45 nm). Pathological events during Parkinson disease are generally related to increased AS concentration and thus may be mediated by less selective aberrant AS binding to membranes of different organelles (64). In this work, we determined how different membrane properties affect the binding of monomeric AS. Membrane charge has a very strong influence on AS affinity (4, 35). Therefore, we considered the effects of other membrane characteristics on AS binding for anionic and zwitterionic membranes separately in order to establish the secondary hierarchies of physicochemical parameters. We found that curvature, phase, and cholesterol content impact binding to neutral and charged vesicles in a differential manner (Table 2).
TABLE 2.
Comparison of AS binding to neutral and negatively charged membranes
| Factor | Neutral membranes | Charged membranes |
|---|---|---|
| Curvature | Increases binding | Minor effect |
| High cholesterol content in membranes | Decreases binding | Minor effect |
| High rigidity of membranes (gel phase) | Increases binding | No effect or decreases binding |
| Presence of unsaturated acids | Increases binding | Increases binding |
| Stoichiometry (lipid/AS) | >300 | 30–100 |
| Rate of binding | ∼1 s−1 | 50–700 s−1 |
The affinity of AS for neutral membranes is very sensitive to membrane curvature. An increase in the vesicle diameter from 45 nm (SUVs) to 100 nm (LUVs) decreases binding of AS by about 2 orders of magnitude. Membranes of high curvature contain more defects that may act as the binding sites for AS (31, 32). This hypothesis is also supported by the results of other experiments. For example, there is a strong decrease of AS affinity for neutral membranes upon an increase in the content of cholesterol, which is known to eliminate defects in membranes of high curvature (Figs. 6B and 9) (58). Membrane bending induces more defects in rigid phospholipid bilayers, explaining the greater affinity of AS for neutral vesicles in the gel phase than in Ld phase. And finally, the low (<10%) coverage of neutral membranes by AS also supports the hypothesis that membrane defects are essential for AS binding.
FIGURE 9.

Affinities of AS for different model membranes. Affinity is presented as the lipid concentration at which 50% of the protein (100 nm) is bound to the membranes. Membranes composed of lipids containing unsaturated acids are in italic type. The boldface type is used to mark the gel phase of membranes.
The interaction of AS with negatively charged membranes does not follow the same rules. The affinity is almost independent of changes in the number of membrane defects caused by alterations of curvature, rigidity, or cholesterol content (Fig. 9). The stoichiometry of AS binding to negatively charged model membranes (30–100 lipids/protein) corresponds to a much denser surface coverage, between 30 and 100%, and therefore the binding cannot be attributed to membrane defects alone. Moreover, the interaction of AS with negatively charged membranes occurs much faster than with zwitterionic membranes. This effect cannot be explained simply by invoking electrostatic attraction forces because the net charge of AS is negative, close to −9 at pH 7.4. The electrostatic repulsion to some extent decreases the initial binding, but this is compensated for by faster conformational changes.
The presence of unsaturated fatty acids in the target membranes significantly increases AS binding to membranes in the Ld phase. The protein binds to vesicles composed of DOPC with at least 5-fold higher affinity than to POPC membranes and about 100-fold better than to membranes formed of saturated DMPC. Moreover, in the case of negatively charged vesicles, the presence of the unsaturated chains has a stronger effect on the binding than the phase of the membrane; for example, DOPG (Ld, unsaturated) binds AS better than DPPG (gel, saturated). The increase in AS binding affinity for lipidic structures that contain unsaturated fatty acids appears to be independent of the presence of membrane defects. Such behavior may be explained by the large distance between the polar headgroups due to less dense packing of lipid bilayer (0.82 nm2/lipid for DOPC versus 0.65 nm2/lipid for DMPC) (61).
We presume that AS binds neutral and negatively charged membranes by different mechanisms. The interaction with negatively charged membranes could be driven by electrostatic forces alone and therefore does not depend significantly on hydrophobic interactions. In contrast, the binding to neutral membranes requires defects in the bilayer structure that render the interaction highly sensitive to the influence of membrane curvature, phase, and composition. We propose that AS binding to phospholipid vesicles occurs as a multistep process, determined initially by electrostatic interaction of its N terminus, but then also strongly dependent on bilayer defects, especially in the case of zwitterionic membranes. In such a model, the first step involves the fast reversible binding of unstructured protein to the membrane, followed by the folding to an energetically preferred α-helical conformation that is stabilized by different interactions with the polar headgroups and the acyl-chains. In the case of anionic vesicles, the influence of neighboring prebound AS must be considered in order to adequately describe the state of the system at high levels of vesicle coverage.
The dissection of the differential contributions of the factors determining the binding to neutral and negatively charged membranes can reconcile some of the disagreements in prior data obtained with different systems. For example, FCS data show that the affinities of AS for POPS SUVs and LUVs are similar (28), whereas isothermal titration calorimetry measurements indicate that AS binds to the zwitterionic SUVs but not LUVs (31). Our kinetic and competition experiments demonstrate that binding of AS to lipid bilayers is reversible such that the protein can migrate to membranes with higher affinity, presumably by a process of unbinding and free diffusion, although direct vesicle-vesicle transfer cannot be excluded.
The fact that AS efficiently discriminates membranes according to their physical properties, suggests a high degree of selectivity in its binding and ability to migrate between membranes of different composition. These features are undoubtedly important for the proper localization and function of AS within the cell. For example, AS binding to synaptic vesicles may be enhanced by its preferences for membranes of high curvature and negative charge. Moreover, the differing mechanisms of AS binding to neutral and negatively charged membranes are probably related to distinct protein conformations and/or positions in membranes of relevance for distinct AS functions as well as the processes leading to pathological aggregation.
This work was funded by the Max Planck Society, the Toxic Proteins Project (Innovation Fund of the Max Planck Society), and Excellence Cluster EXC 171-FZT103 “Microscopy at the Nanometer Range” associated with the Deutsche Forschungsgemeinschaft Center for the Molecular Physiology of the Brain.

The on-line version of this article (available at http://www.jbc.org) contains supplemental “Experimental Procedures” and “Results” and Figs. S1 and S2.
- AS
- α-synuclein
- ESIPT
- excited state intramolecular proton transfer
- POPC
- 1-palmitoyl-2-oleoyl phosphatidylcholine
- POPS
- 1-palmitoyl-2-oleoyl phosphatidylserine
- DOPC
- 1,2-dioleoyl phosphatidylcholine
- DOPC
- 1,2-dioleoyl phosphatidylcholine
- DPPC
- 1,2-dipalmitoyl phosphatidylcholine
- DMPC
- 1,2-dimyristoyl phosphatidylcholine
- DOPG
- 1,2-dioleoyl phosphatidyglycerol
- Ld
- liquid disordered
- SUV
- small unilamellar vesicle
- LUV
- large unilamellar vesicle
- FE
- diethylamino-3-hydroxyflavone
- MFE
- N-(2-[4-(diethylamino)phenyl]-3-hydroxy-4-oxo-4H-chromen-6-yl)-4-(2,5-dioxo-2,5-dihydro-1H-pyrrol-1-yl)propanamide
- AS-18MFE
- AS labeled at position 18.
REFERENCES
- 1. Lees A. J., Hardy J., Revesz T. (2009) Lancet 373, 2055–2066 [DOI] [PubMed] [Google Scholar]
- 2. Uversky V. N., Eliezer D. (2009) Curr. Protein Pept. Sci. 10, 483–499 [DOI] [PMC free article] [PubMed] [Google Scholar]
- 3. Maguire-Zeiss K. A. (2008) Pharmacol. Res. 58, 271–280 [DOI] [PMC free article] [PubMed] [Google Scholar]
- 4. Bisaglia M., Mammi S., Bubacco L. (2009) FASEB J. 23, 329–340 [DOI] [PubMed] [Google Scholar]
- 5. Cooper A. A., Gitler A. D., Cashikar A., Haynes C. M., Hill K. J., Bhullar B., Liu K., Xu K., Strathearn K. E., Liu F., Cao S., Caldwell K. A., Caldwell G. A., Marsischky G., Kolodner R. D., Labaer J., Rochet J. C., Bonini N. M., Lindquist S. (2006) Science 313, 324–328 [DOI] [PMC free article] [PubMed] [Google Scholar]
- 6. Nemani V. M., Lu W., Berge V., Nakamura K., Onoa B., Lee M. K., Chaudhry F. A., Nicoll R. A., Edwards R. H. (2010) Neuron 65, 66–79 [DOI] [PMC free article] [PubMed] [Google Scholar]
- 7. Burré J., Sharma M., Tsetsenis T., Buchman V., Etherton M. R., Südhof T. C. (2010) Science 329, 1663–1667 [DOI] [PMC free article] [PubMed] [Google Scholar]
- 8. Golovko M. Y., Barceló-Coblijn G., Castagnet P. I., Austin S., Combs C. K., Murphy E. J. (2009) Mol. Cell. Biochem. 326, 55–66 [DOI] [PubMed] [Google Scholar]
- 9. Weinreb P. H., Zhen W., Poon A. W., Conway K. A., Lansbury P. T., Jr. (1996) Biochemistry 35, 13709–13715 [DOI] [PubMed] [Google Scholar]
- 10. Davidson W. S., Jonas A., Clayton D. F., George J. M. (1998) J. Biol. Chem. 273, 9443–9449 [DOI] [PubMed] [Google Scholar]
- 11. Bussell R., Jr., Eliezer D. (2003) J. Mol. Biol. 329, 763–778 [DOI] [PubMed] [Google Scholar]
- 12. Jao C. C., Der-Sarkissian A., Chen J., Langen R. (2004) Proc. Natl. Acad. Sci. U.S.A. 101, 8331–8336 [DOI] [PMC free article] [PubMed] [Google Scholar]
- 13. Giasson B. I., Murray I. V., Trojanowski J. Q., Lee V. M. (2001) J. Biol. Chem. 276, 2380–2386 [DOI] [PubMed] [Google Scholar]
- 14. Hoyer W., Cherny D., Subramaniam V., Jovin T. M. (2004) Biochemistry 43, 16233–16242 [DOI] [PubMed] [Google Scholar]
- 15. Bertoncini C. W., Jung Y. S., Fernandez C. O., Hoyer W., Griesinger C., Jovin T. M., Zweckstetter M. (2005) Proc. Natl. Acad. Sci. U.S.A. 102, 1430–1435 [DOI] [PMC free article] [PubMed] [Google Scholar]
- 16. Auluck P. K., Caraveo G., Lindquist S. (2010) Annu. Rev. Cell Dev. Biol. 26, 211–233 [DOI] [PubMed] [Google Scholar]
- 17. Devi L., Raghavendran V., Prabhu B. M., Avadhani N. G., Anandatheerthavarada H. K. (2008) J. Biol. Chem. 283, 9089–9100 [DOI] [PMC free article] [PubMed] [Google Scholar]
- 18. Obeso J. A., Rodriguez-Oroz M. C., Goetz C. G., Marin C., Kordower J. H., Rodriguez M., Hirsch E. C., Farrer M., Schapira A. H., Halliday G. (2010) Nat. Med. 16, 653–661 [DOI] [PubMed] [Google Scholar]
- 19. Jellinger K. A. (2010) J. Cell. Mol. Med. 14, 457–487 [DOI] [PMC free article] [PubMed] [Google Scholar]
- 20. Zakharov S. D., Hulleman J. D., Dutseva E. A., Antonenko Y. N., Rochet J. C., Cramer W. A. (2007) Biochemistry 46, 14369–14379 [DOI] [PubMed] [Google Scholar]
- 21. Kim H. Y., Cho M. K., Kumar A., Maier E., Siebenhaar C., Becker S., Fernandez C. O., Lashuel H. A., Benz R., Lange A., Zweckstetter M. (2009) J. Am. Chem. Soc. 131, 17482–17489 [DOI] [PubMed] [Google Scholar]
- 22. Banerjee K., Sinha M., Pham Cle L., Jana S., Chanda D., Cappai R., Chakrabarti S. (2010) FEBS Lett. 584, 1571–1576 [DOI] [PubMed] [Google Scholar]
- 23. Cole N. B., Murphy D. D., Grider T., Rueter S., Brasaemle D., Nussbaum R. L. (2002) J. Biol. Chem. 277, 6344–6352 [DOI] [PubMed] [Google Scholar]
- 24. Lee H. J., Choi C., Lee S. J. (2002) J. Biol. Chem. 277, 671–678 [DOI] [PubMed] [Google Scholar]
- 25. Necula M., Chirita C. N., Kuret J. (2003) J. Biol. Chem. 278, 46674–46680 [DOI] [PubMed] [Google Scholar]
- 26. Zhu M., Li J., Fink A. L. (2003) J. Biol. Chem. 278, 40186–40197 [DOI] [PubMed] [Google Scholar]
- 27. Kubo S., Nemani V. M., Chalkley R. J., Anthony M. D., Hattori N., Mizuno Y., Edwards R. H., Fortin D. L. (2005) J. Biol. Chem. 280, 31664–31672 [DOI] [PubMed] [Google Scholar]
- 28. Rhoades E., Ramlall T. F., Webb W. W., Eliezer D. (2006) Biophys. J. 90, 4692–4700 [DOI] [PMC free article] [PubMed] [Google Scholar]
- 29. Stöckl M., Fischer P., Wanker E., Herrmann A. (2008) J. Mol. Biol. 375, 1394–1404 [DOI] [PubMed] [Google Scholar]
- 30. Pfefferkorn C. M., Lee J. C. (2010) J. Phys. Chem. B 114, 4615–4622 [DOI] [PMC free article] [PubMed] [Google Scholar]
- 31. Nuscher B., Kamp F., Mehnert T., Odoy S., Haass C., Kahle P. J., Beyer K. (2004) J. Biol. Chem. 279, 21966–21975 [DOI] [PubMed] [Google Scholar]
- 32. Kamp F., Beyer K. (2006) J. Biol. Chem. 281, 9251–9259 [DOI] [PubMed] [Google Scholar]
- 33. Middleton E. R., Rhoades E. (2010) Biophys. J. 99, 2279–2288 [DOI] [PMC free article] [PubMed] [Google Scholar]
- 34. Kjaer L., Giehm L., Heimburg T., Otzen D. (2009) Biophys. J. 96, 2857–2870 [DOI] [PMC free article] [PubMed] [Google Scholar]
- 35. Drescher M., Godschalk F., Veldhuis G., van Rooijen B. D., Subramaniam V., Huber M. (2008) ChemBioChem 9, 2411–2416 [DOI] [PubMed] [Google Scholar]
- 36. Wang G. F., Li C., Pielak G. J. (2010) Protein Sci. 19, 1686–1691 [DOI] [PMC free article] [PubMed] [Google Scholar]
- 37. Bartels T., Ahlstrom L. S., Leftin A., Kamp F., Haass C., Brown M. F., Beyer K. (2010) Biophys. J. 99, 2116–2124 [DOI] [PMC free article] [PubMed] [Google Scholar]
- 38. van Rooijen B. D., Claessens M. M., Subramaniam V. (2009) Biochim. Biophys. Acta 1788, 1271–1278 [DOI] [PubMed] [Google Scholar]
- 39. Ulmer T. S., Bax A., Cole N. B., Nussbaum R. L. (2005) J. Biol. Chem. 280, 9595–9603 [DOI] [PubMed] [Google Scholar]
- 40. Drescher M., Veldhuis G., van Rooijen B. D., Milikisyants S., Subramaniam V., Huber M. (2008) J. Am. Chem. Soc. 130, 7796–7797 [DOI] [PubMed] [Google Scholar]
- 41. Bortolus M., Tombolato F., Tessari I., Bisaglia M., Mammi S., Bubacco L., Ferrarini A., Maniero A. L. (2008) J. Am. Chem. Soc. 130, 6690–6691 [DOI] [PubMed] [Google Scholar]
- 42. Rao J. N., Jao C. C., Hegde B. G., Langen R., Ulmer T. S. (2010) J. Am. Chem. Soc. 132, 8657–8668 [DOI] [PMC free article] [PubMed] [Google Scholar]
- 43. Georgieva E. R., Ramlall T. F., Borbat P. P., Freed J. H., Eliezer D. (2008) J. Am. Chem. Soc. 130, 12856–12857 [DOI] [PMC free article] [PubMed] [Google Scholar]
- 44. Jao C. C., Hegde B. G., Chen J., Haworth I. S., Langen R. (2008) Proc. Natl. Acad. Sci. U.S.A. 105, 19666–19671 [DOI] [PMC free article] [PubMed] [Google Scholar]
- 45. Ferreon A. C., Gambin Y., Lemke E. A., Deniz A. A. (2009) Proc. Natl. Acad. Sci. U.S.A. 106, 5645–5650 [DOI] [PMC free article] [PubMed] [Google Scholar]
- 46. Trexler A. J., Rhoades E. (2009) Biochemistry 48, 2304–2306 [DOI] [PMC free article] [PubMed] [Google Scholar]
- 47. Bodner C. R., Dobson C. M., Bax A. (2009) J. Mol. Biol. 390, 775–790 [DOI] [PMC free article] [PubMed] [Google Scholar]
- 48. Demchenko A. P., Mély Y., Duportail G., Klymchenko A. S. (2009) Biophys. J. 96, 3461–3470 [DOI] [PMC free article] [PubMed] [Google Scholar]
- 49. Chou P. T., Martinez M. L., Clements J. H. (1993) J. Phys. Chem. 97, 2618–2622 [Google Scholar]
- 50. Klymchenko A. S., Demchenko A. P. (2004) New J. Chem. 28, 687–692 [Google Scholar]
- 51. Klymchenko A. S., Mély Y., Demchenko A. P., Duportail G. (2004) Biochim. Biophys. Acta 1665, 6–19 [DOI] [PubMed] [Google Scholar]
- 52. Shynkar V. V., Klymchenko A. S., Kunzelmann C., Duportail G., Muller C. D., Demchenko A. P., Freyssinet J. M., Mely Y. (2007) J. Am. Chem. Soc. 129, 2187–2193 [DOI] [PubMed] [Google Scholar]
- 53. Oncul S., Klymchenko A. S., Kucherak O. A., Demchenko A. P., Martin S., Dontenwill M., Arntz Y., Didier P., Duportail G., Mély Y. (2010) Biochim. Biophys. Acta 1798, 1436–1443 [DOI] [PubMed] [Google Scholar]
- 54. Postupalenko V. Y., Shvadchak V. V., Duportail G., Pivovarenko V. G., Klymchenko A. S., Mély Y. (2011) Biochim. Biophys. Acta 1808, 424–432 [DOI] [PubMed] [Google Scholar]
- 55. Celej M. S., Caarls W., Demchenko A. P., Jovin T. M. (2009) Biochemistry 48, 7465–7472 [DOI] [PubMed] [Google Scholar]
- 56. Yushchenko D. A., Fauerbach J. A., Thirunavukkuarasu S., Jares-Erijman E. A., Jovin T. M. (2010) J. Am. Chem. Soc. 132, 7860–7861 [DOI] [PubMed] [Google Scholar]
- 57. Liu J. P., Tang Y., Zhou S., Toh B. H., McLean C., Li H. (2010) Mol. Cell Neurosci. 43, 33–42 [DOI] [PubMed] [Google Scholar]
- 58. Mills T. T., Toombes G. E., Tristram-Nagle S., Smilgies D. M., Feigenson G. W., Nagle J. F. (2008) Biophys. J. 95, 669–681 [DOI] [PMC free article] [PubMed] [Google Scholar]
- 59. Bar-On P., Crews L., Koob A. O., Mizuno H., Adame A., Spencer B., Masliah E. (2008) J. Neurochem. 105, 1656–1667 [DOI] [PMC free article] [PubMed] [Google Scholar]
- 60. Bar-On P., Rockenstein E., Adame A., Ho G., Hashimoto M., Masliah E. (2006) J. Neurochem. 98, 1032–1045 [DOI] [PubMed] [Google Scholar]
- 61. Nagle J. F., Tristram-Nagle S. (2000) Curr. Opin. Struct. Biol. 10, 474–480 [DOI] [PMC free article] [PubMed] [Google Scholar]
- 62. Li C., Lutz E. A., Slade K. M., Ruf R. A., Wang G. F., Pielak G. J. (2009) Biochemistry 48, 8578–8584 [DOI] [PMC free article] [PubMed] [Google Scholar]
- 63. Takamori S., Holt M., Stenius K., Lemke E. A., Grønborg M., Riedel D., Urlaub H., Schenck S., Brügger B., Ringler P., Müller S. A., Rammner B., Gräter F., Hub J. S., De Groot B. L., Mieskes G., Moriyama Y., Klingauf J., Grubmüller H., Heuser J., Wieland F., Jahn R. (2006) Cell 127, 831–846 [DOI] [PubMed] [Google Scholar]
- 64. Cookson M. R. (2009) Mol. Neurodegener. 4, 9. [DOI] [PMC free article] [PubMed] [Google Scholar]