Abstract
The serine/threonine kinase B-Raf is the second most frequently occurring human oncogene after Ras. Mutations of B-Raf occur with the highest incidences in melanoma, and the most common mutant, V600E, renders B-Raf constitutively active. The sodium proton exchanger isoform 1 (NHE1) is a ubiquitously expressed plasma membrane protein responsible for regulating intracellular pH, cell volume, cell migration, and proliferation. A screen of protein kinases that bind to NHE1 revealed that B-Raf bound to the cytosolic regulatory tail of NHE1. Immunoprecipitation of NHE1 from HeLa and HEK cells confirmed the association of B-Raf with NHE1 in vivo. The expressed and purified C-terminal 182 amino acids of the NHE1 protein were also shown to associate with B-Raf protein in vitro. Because treatment with the kinase inhibitor sorafenib decreased NHE1 activity in HeLa and HEK cells, we examined the role of B-Raf in regulating NHE1 in malignant melanoma cells. Melanoma cells with the B-RafV600E mutation demonstrated increased resting intracellular pH that was dependent on elevated NHE1 activity. NHE1 activity after an acute acid load was also elevated in these cell lines. Moreover, inhibition of B-Raf activity by either sorafenib, PLX4720, or siRNA reduction of B-Raf levels abolished ERK phosphorylation and decreased NHE1 activity. These results demonstrate that B-Raf associates with and stimulates NHE1 activity and that B-RafV600E also increases NHE1 activity that raises intracellular pH.
Keywords: Cell pH, Membrane, Membrane Enzymes, Membrane Proteins, Sodium Proton Exchange, Melanoma
Introduction
The Na+/H+ exchanger is a cation-transporting pH-regulatory protein. In eukaryotes, the protein exchanges one extracellular Na+ for one intracellular H+ across lipid bilayers. The ubiquitous isoform of the protein, Na+/H+ exchanger type 1 (NHE1), is present on the plasma membrane and is critical in regulation of intracellular pH and in response to osmotic challenge in mammalian cells (1). Human NHE1 is 815 amino acids consisting of a 500-amino acid transmembrane domain and a 315-amino acid regulatory cytosolic tail. The cytosolic tail has been shown to be subject to regulatory phosphorylation and can bind regulatory proteins, including calmodulin (2, 3).
NHE1 has numerous physiological roles. In the myocardium, NHE1 is critical in mediating the damage that occurs with myocardial ischemia/reperfusion injury (4, 5) and is also an important mediator of cardiac hypertrophy (6). However, NHE1 also is important in cell volume regulation, cell differentiation, and in cell proliferation (1, 7–9). Notably, NHE1 has been shown to interact with many different signaling molecules and has been suggested to act as a scaffolding platform for signaling complexes (10, 11). NHE1 also has several mechanisms by which it contributes to cell migration, including assembly of cytoskeletal elements and via regulation of intracellular pH (10, 12).
Serum deprivation of the tumor microenvironment stimulates NHE1 in breast cancer cells and promotes increased cell motility and invasiveness in these cells (13, 14). The mechanism by which NHE1 contributes to the growth and metastasis of transformed cells occurs in several ways. NHE1 contributes to the increased DNA synthesis and cell cycle progression of transformed cells by increasing intracellular pH. Additionally, NHE1 has been suggested to play an important role in regulating the tumor microenvironment by acidifying the extracellular milieu, promoting extracellular adhesion and thereby promoting invasiveness of melanoma cells (8).
Although it was previously suggested that the role of NHE1 as a signaling scaffold should be further investigated (11), limited progress has been made in this area. We have shown previously that NHE1 is regulated by the MAPK-signaling pathway (15, 16). This pathway is activated in most melanomas. In this study, we examined the interaction of NHE1 with a member of this pathway, the B-Raf protein kinase. B-Raf-activating mutations have been found with high frequencies in melanomas (17). Among these mutations, the most common is a single amino acid substitution of V600E, which makes the B-Raf kinase hyperactive resulting in the constitutive activation of MAPK cascade. Indeed, the mutation data currently listed at the COSMIC website demonstrate that in 39% of melanoma patients (n = 4431), B-Raf mutations can be detected, of which the B-RafV600E is the most prominent mutation found in more than 80% of the patients with B-Raf mutations. The inhibition of this oncogenic B-Raf is a promising therapeutic target for treating melanoma (18). In this study, a screen of the NHE1 cytoplasmic domain for interacting partners led to the discovery that B-Raf complexes with NHE1. We show, for the first time, that B-Raf binds to and regulates NHE1. We also demonstrate that human malignant melanoma cells with the B-RafV600E mutation have elevated intracellular pH and NHE1 activity.
EXPERIMENTAL PROCEDURES
Materials
Routine chemicals were of analytical grade and were purchased from Fisher, BDH (Toronto, Ontario, Canada), or Sigma. 2′,7-Bis(2-carboxyethyl)-5(6)-carboxyfluorescein-AM was from Molecular Probes (Eugene, OR). EMD87580 was a kind gift of Dr. N. Beier, Merck. LipofectamineTM 2000 reagent was from Invitrogen. Mouse anti-NHE1 antibody was from BD Biosciences. Anti-hemagglutinin (HA) antibody Y-11 was from Santa Cruz Biotechnology (Santa Cruz, CA), and protein-A-Sepharose beads were from Sigma. DMEM and RPMI 1640 medium were also from Sigma. Sorafenib was obtained from LC Laboratories (Woburn, MA). Dithiobis(succinimidylpropionate) was purchased from Pierce. Anti-B-Raf antibody was from Santa Cruz Biotechnology (sc-5284). Phospho-ERK1/2 (Thr-202/Tyr-204)-mouse monoclonal and ERK1/2(p44/42 MAPK)-rabbit polyclonal antibodies were from Cell Signaling Technology (Danvers, MA). The plasmids encoding for B-Raf (pEFmB-Rafwt) and B-Raf with the V600E mutation (pEFmB-RafV600E) (19) were the generous gift of Dr. Richard Marais (Institute of Cancer Research, UK, Center for Cell and Molecular Biology).
Screening for NHE1-interacting Proteins
To identify NHE1-interacting proteins, we used an affinity chromatography technique similar to that used earlier for the potassium channel (20). The C terminus of the rabbit NHE1 isoform of the Na+/H+ exchanger, amino acids 545–816, was produced as a fusion protein with glutathione S-transferase essentially as described earlier (21). The primer pair used for amplification of the sequence was 5′-acggatccattggaaagacaagctcaaccggttta-3′ and 5′-aagaattcactgccctttggggatgaaaggct-3′, and for cloning and expression, we used the plasmid pGEX-3X in the BamHI-EcoRI sites as described earlier (21). Purification was with glutathione-Sepharose affinity chromatography after induction at 30 °C with isopropyl β-d-thiogalactopyranoside. Glutathione S-transferase was produced and purified using the same plasmid without an exogenous insert.
Heart extracts were prepared by initially grinding 10 frozen rat hearts with a mortar and pestle using liquid nitrogen for cooling, prior to homogenization. Hearts were homogenized in 10 volumes of 20 mm HEPES, pH 7.2, 1 mm EDTA, 1 mm EGTA, 1 mm DTT, 1 mm PMSF, 3 mm benzamidine, 1% Triton X-100, and a mixture of protease inhibitors (22). Homogenization was with a Polytron homogenizer, three times for 15 s on ice. The homogenate was then sonicated four times for 10 s on ice. Nuclei and debris were collect by centrifugation two times at 1000 × g for 10 min. The supernatant was then centrifuged at 40,000 × g for 10 min. The next supernatant was centrifuged at 100,000 × g for 1 h, and the supernatant was collected and frozen prior to use.
For affinity chromatography, 5 mg of purified GST protein or purified GST-NHE1 fusion protein was passed through a glutathione-Sepharose column several times. The column was washed with 20 volumes of buffer A containing 20 mm HEPES, pH 7.2, 1 mm EDTA, 1 mm EGTA, 1 mm DTT, 1 mm PMSF, 3 mm benzamidine, 1% Triton X 100, and protease inhibitors. The GST or GST-NHE1-loaded matrix was added to solubilized heart proteins from 10 hearts and incubated overnight at 4 °C while rotating. After incubation, the matrix was loaded onto a column and washed with 20 volumes of buffer A. GST (as a control) or GST-NHE1-bound proteins were eluted with 5 mm glutathione in buffer A. Dialysis removed residual glutathione, and eluted proteins were precipitated with trichloroacetic acid.
To determine the protein kinases that bound to the cytosolic tail of NHE1, both experimental and control proteins eluted were initially screened using a KinexTM protein kinase array (Kinexus Bioinformatic Corporation, Vancouver, British Columbia, Canada). This identified protein kinases and related proteins that were binding to the NHE1 C-terminal GST fusion. These results were compared with the control screen of sample binding to the GST affinity column. B-Raf and several other protein kinases were found to bind to the NHE1 C-terminal fusion and not to the GST column alone. As a second screen, the affinity chromatography procedure described above was repeated again, and an independently made sample was subjected to a Western blotting screening using antibodies against the putative positive interacting proteins (KinetworksTM multi-immunoblot analysis, Kinexus Bioinformatic Corp.).
Cell Culture
Human cervical cancer cells (HeLa) and human embryonic kidney cells (HEK293) were grown in a humidified atmosphere of 5% CO2 and 95% air in DMEM supplemented with 10% (v/v) fetal bovine serum, 20 mm HEPES, penicillin (100 units/ml), and streptomycin (100 μg/ml) at 37 °C. Human malignant melanoma cell lines were cultured in RPMI 1640 medium supplemented with 10% fetal bovine serum as described earlier (23).
Cell Surface Expression
The relative levels of NHE1 cell surface expression were measured essentially as described earlier (24). HEK or HeLa cells were transfected with NHE1 plus B-Raf expression plasmid or control vector as above. Cell surfaces were labeled with sulfo-NHS-SS-biotin (Pierce), and immobilized streptavidin resin was used to remove plasma membrane NHE1 protein. Equal amounts of total and unbound proteins were analyzed by Western blotting and densitometry measuring immunoreactive (HA-tagged) NHE1 protein. It was not possible to efficiently and reproducibly elute proteins bound to immobilized streptavidin resin. The relative amount of NHE1 on the cell surface was calculated for both the 110- and 95-kDa (partial or de-glycosylated) HA-immunoreactive species in Western blots of the fractions as indicated in the figures and legends.
Immunoprecipitations
To determine whether NHE1 and B-Raf interacted in vivo, we used co-immunoprecipitation essentially as described earlier (25). HeLa and HEK293 cells were transfected with the plasmid pYN4+ to express the entire cDNA for the coding region of the Na+/H+ exchanger with a hemagglutinin (HA) tag that we have previously shown does not affect the function of the protein (24). For transient expression of B-Raf proteins, the plasmids encoding for B-Raf (pEFmB-Rafwt) and B-Raf with the V600E mutation (pEFmB-RafV600E) (19) were used. The transfection of cells was done as described earlier with LipofectamineTM 2000 reagent (24). After 24 h of transfection, cells (100-mm dishes) were washed two times with phosphate-buffered saline (PBS, 150 mm NaCl, 5 mm sodium phosphate, pH 7.4) and then frozen in 1 ml of RIPA buffer (50 mm Tris-HCl, pH 8.0, 150 mm NaCl, 80 mm NaF, 5 mm EDTA, 1 mm EGTA, 1 mm sodium orthovanadate, 1% Nonidet P-40, 0.05% deoxycholate, and protease inhibitor mixture) by placing cells on dry ice. After thawing of cells on ice, the cells were collected by scraping and sonicated for 15 s. This lysate was centrifuged (10,000 × g for 30 min), and the supernatant was incubated with 7.5 μl (1.4 μg/ml) of rabbit anti-HA polyclonal antibody and rocked for 2 h at 4 °C. Supernatant with antibody was added to 100 μl of prepared protein A-Sepharose beads and agitated overnight at 4 °C. Beads were collected by centrifugation at 7000 rpm for 30 s and washed four times with RIPA buffer before final collection. After washing, the bound protein was eluted from the washed beads by incubating with 45 μl of 1× SDS-PAGE sample loading buffer at 37 °C for 15 min and immunoblotted as described below.
For immunoprecipitation of endogenous NHE1 and B-Raf, confluent HeLa and HEK293 cells were washed twice with phosphate-buffered saline (PBS, 150 mm NaCl, 5 mm sodium phosphate, pH 7.4). Dithiobis(succinimidylpropionate), a cross-linking reagent, was added to cells at a final concentration of 2 mm in reaction buffer (20 mm sodium phosphate, 20 mm Na2HPO4, 1.76 mm KH2PO4, 150 mm NaCl, pH 7.4) for 30 min at room temperature. The reaction was terminated by addition of Tris, pH 7.5, to a final concentration of 10 mm for 15 min at room temperature. Cells were then washed with phosphate-buffered saline. The balance of the steps was performed at 4 °C unless otherwise noted. HeLa and HEK293 cells were lysed in 1 ml of RIPA buffer as described above. Cells were scraped off the Petri dishes followed by sonication for 15 s. The lysate was centrifuged at 100,000 × g for 1 h. After centrifugation, the supernatants were rocked for 2 h with protein G-agarose beads to remove nonspecific binding proteins. This was centrifuged to remove the beads (3000 rpm, 30 s), and the supernatants containing Na+/H+ exchanger and B-Raf were rocked for 4 h with 7.5 μl of mouse anti-B-Raf monoclonal antibody. Afterward, protein G-agarose was added, and the sample was rocked overnight in a cold room. The resin was washed with RIPA buffer three times, and bound protein was removed by incubating with SDS-PAGE sample buffer with 10 mm DTT for 30 min at 37 °C. Proteins were transferred to nitrocellulose after SDS-PAGE and probed with anti-NHE1 (Millipore, Temecula, CA) antibody.
Immunoblotting
SDS-PAGE and immunoblotting were performed essentially as described earlier (26). For Western blot analysis, equal amounts of up to 100 μg of each sample were resolved on 10% SDS-polyacrylamide gels. Nitrocellulose transfers were immunostained, and we used Li-COR fluorescence labeling and detection systems (LI-COR Biosciences, Lincoln, NE) to visualize and quantify immunoreactive proteins.
Measurement of Intracellular pH
Intracellular pH measurement was essentially as described earlier (24). Cells were grown on coverslips to subconfluency, and pH changes were measured using a PTI Deltascan spectrofluorometer and the fluorescent compound 2′,7-bis(2-carboxyethyl)-5(6)-carboxyfluorescein-AM. Cells were acidified using ammonium chloride, and the initial rate of recovery was measured during the first 20 s after return of NaCl at 37 °C. A calibration curve was done with nigericin at the end of every experiment to calibrate intracellular pH to fluorescence as described earlier (24). Where indicated, individual buffering capacity of each cell type was determined as described earlier (27, 28), and proton flux was calculated as described earlier (27, 28) from individual buffering capacities. Some assays were done in the presence of 10 μm of EMD 87580, 10 μm Sorafenib, or 10 μm PLX4720.
Production of B-Raf Protein
B-Raf protein was produced in HeLa cells. HeLa cells were cultured in DMEM supplemented with 10% fetal bovine serum, 25 mm HEPES, penicillin (100 units/ml), and streptomycin (100 μg/ml) in a humidified 5% CO2 atmosphere at 37 °C. Transient transfections were made at 80–90% confluence with LipofectamineTM 2000 as described above. The plasmids pEBG-B-RafWT and pEBG-B-RafV600E were used to express GST fusion B-Raf wild type or mutant protein in HeLa cells (29). Cells were lysed 48 h after the transfection in lysis buffer (20 mm Tris-HCl, pH 7.5, 150 mm NaCl, 1 mm Na2EDTA, 1 mm EGTA, 1% Triton, 2.5 mm sodium pyrophosphate, 1 mm Na3VO4, and proteinase inhibitors) and placed on dry ice. Cells were defrosted and removed from the Petri dishes and sonicated two times for 15 s. The lysate was centrifuged (60,000 × g for 1 h at 4 °C), and the supernatant was collected for overlay experiments or was purified via GST affinity chromatography.
Overlay Procedure
To examine wild type B-Raf or mutant V600E binding to the Na+/H+ exchanger, we expressed and purified the C-terminal region of the NHE1 protein essentially as described earlier (30). Two His-tagged fusion proteins were used of the human NHE1 C terminus consisting of the distal 182 (His-182, amino acids 634–815) and 239 (His-239, amino acids 577–815) amino acids. Controls were two other His-tagged proteins. A His-tagged calcineurin homologous protein (HisCHP) was produced as described earlier (26), and the His-tagged MgATPase protein was a gift of Dr. H. Young (Department. of Biochemistry, University of Alberta). Equal amounts of protein samples were separated on 10% SDS-PAGE and then transferred to nitrocellulose membranes. Nitrocellulose membranes were blocked with 10% (w/v) skim milk powder in TBS (20 mm Tris, pH 7.4, 137 mm NaCl) for 3 h at room temperature. They were then incubated with wild type B-Raf protein or mutant B-RafV600E protein. Either purified protein or supernatant of cell lysates containing B-Raf proteins was used where indicated. Membranes were rocked gently overnight at 4 °C. Membranes were washed with TBS four times for 15 min at room temperature. The nitrocellulose was then incubated with rabbit anti-GST antibody (1:5000) or mouse anti-B-Raf antibody (1:2000) in TBS with 1% skim milk powder for 2 h at room temperature followed by washing for another 1 h with TBS. Further amplification was achieved by a subsequent incubation with goat anti-rabbit/mouse-horseradish peroxidase antibodies. Reactive bands were visualized by the enhanced chemiluminescence system (Amersham Biosciences).
siRNA Transfection
For siRNA reduction of B-Raf levels, the following sets of RNA oligonucleotides were used: to reduce wild type B-Raf, Raff, AGAAUUGGAUCUGGAUCAU, and Rafr, AUGAUCCAGAUCCAAUUCU; to reduce mutant V600E B-Raf, V600Raff, GCUACAGAGAAAUCUCGAU, and V600Rafr, AUCGAGAUUUCUCUGUAGC; and to control NonSpf, AUUCAUGGAUCUAGAGGArU, and NonSpr, AUCCUCUAGAUCCAUGAAU. These were based on the sequences used earlier (31). siRNA duplexes were prepared as described previously (32). The transfection was done with LipofectamineTM 2000 following the manufacturer's protocol.
Statistical Analysis
Results are shown as mean ± S.E., and statistical significance was determined using a Wilcoxon-Mann Whitney rank sum test.
RESULTS
A screen for protein kinases interacting with the C-terminal 272 amino acids of the NHE1 isoform of the Na+/H+ exchanger (KinexTM protein kinase array) revealed several putative protein kinases of rat heart extracts that potentially interact with this domain, including B-Raf. As the C-terminal region of NHE1 was a fusion protein with GST, results of the screen were compared with that of a screen with GST alone and the relative signal strength is indicated (Table 1). The strongest signal observed reacting with the NHE1-C terminus was that of B-Raf. Several forms of protein kinase C also reacted as did protein phosphatase 1, heat shock protein, and p90Rsk. We performed a second independent screen again using the C-terminal 272 amino acids of the NHE1 isoform followed by Western blot analysis. This analysis demonstrated that B-Raf was the strongest positive-reacting kinase bound to the NHE1 cytosolic domain (supplemental Fig. S1). For this reason, we further investigated the potential interactions of B-Raf with the NHE1 protein.
TABLE 1.
Protein interactions with the C-terminal 272 amino acids of the NHE1 isoform of the Na+/H+ exchanger
Results were from a KinexTM protein kinase array and are presented as a comparative value to a screen done with a control (GST protein).
| Protein | Signal strength, fold change over control |
|---|---|
| RafB proto-oncogene-encoded protein-serine kinase | 237 |
| Protein-serine kinase Cδ | 201 |
| Bcl2-like protein 1 | 155 |
| p53-induced protein PIGPC1 | 149 |
| Platelet-derived growth factor receptor kinase α/β | 113 |
| Protein-serine kinase Cγ | 91 |
| Protein-serine kinase Cθ | 90 |
| Protein-serine kinase Cθ | 89 |
| Heat shock 90-kDa protein α/β | 87 |
| Protein-serine phosphatase 1, catalytic subunit, α isoform | 86 |
| FLJ35932 protein-serine kinase | 83 |
| cAMP-dependent protein-serine kinase-type I-α regulatory chain | 79 |
| Ribosomal S6 protein-serine kinase 1/2 | 77 |
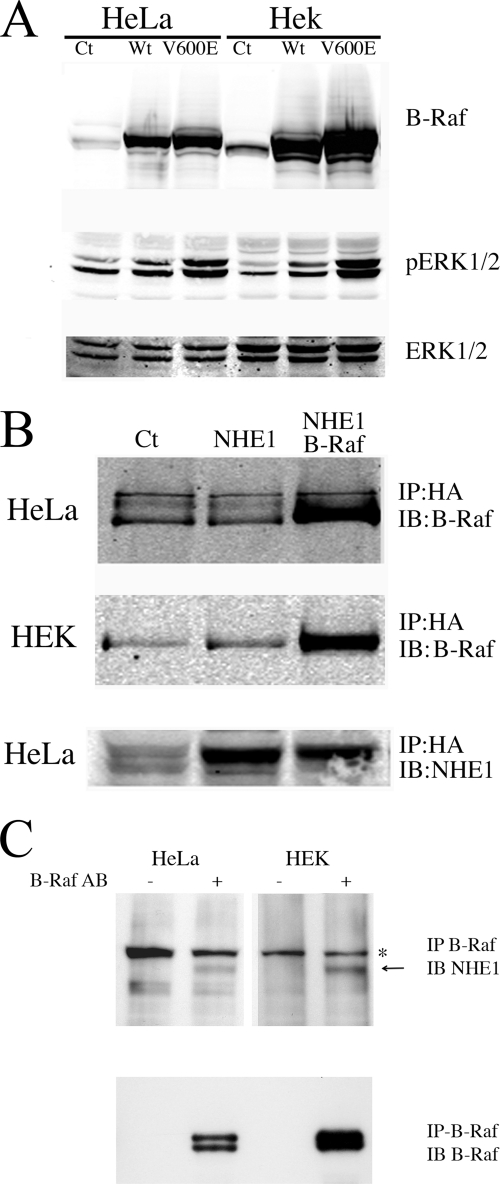
Initial experiments were performed on HeLa and HEK cells. We confirmed that transfection with B-Raf increased B-Raf protein levels and caused activation of the ERK pathway increasing phospho-ERK levels (Fig. 1A). The levels of phospho-ERK were increased higher with expression of the B-RafV600E plasmid than with the wild type B-Raf. The levels of the ERK1/2 protein were unchanged by expression of B-Raf.
FIGURE 1.
Characterization of B-Raf expression and its interaction with NHE1 in HeLa and HEK cells. HeLa or HEK cells were transiently transfected with wild type (Wt) B-Raf or V600E mutant B-Raf plasmid (V600E) for 24 h, and the cell lysates were prepared and run for Western blotting. Ct indicates mock-transfected cells. A, upper panel, Western blot with anti B-Raf antibody. Middle panel, Western blot with anti-phospho-ERK1/2 antibody. Lower panel, Western blot with anti ERK1/2 antibody. Results are typical of three experiments. B, co-immunoprecipitation of (wild type) B-Raf and NHE1. HEK or HeLa cells were transiently transfected with an expression plasmid for NHE1 (NHE1) and for wild type B-Raf where indicated. NHE1 was then immunoprecipitated (IP) using antibody against the NHE1-HA tag as described under “Experimental Procedures.” Immunoblotting (IB) was done with anti-B-Raf antibody or with anti NHE1 protein antibody as indicated. C, immunoprecipitation of endogenous NHE1 and B-Raf. Confluent HeLa or HEK293 cells were cross-linked in the presence of dithiobis(succinimidylpropionate), and cell lysates were prepared as described under “Experimental Procedures.” B-Raf was immunoprecipitated (IP) using antibody against B-Raf where indicated. The co-IP complex was solubilized with SDS-PAGE sample buffer containing 10 mm DTT for 30 min at 37 °C. After SDS-PAGE, proteins were transferred onto nitrocellulose for immunoblotting (IB), which was done with anti-NHE1 antibody (Millipore, Temecula, CA) or with anti-B-Raf antibody as indicated. Arrow denotes location of NHE1 protein. * indicates nonspecific protein present in all samples. Results are typical of at least three experiments.
We examined if B-Raf was bound to the NHE1 protein in two cell types, HeLa and HEK cells. An HA-tagged NHE1 protein was expressed and immunoprecipitated from these cells, and the immunoprecipitate was examined for the presence of B-Raf protein. The results (Fig. 1B) demonstrated an association between the proteins; in both HeLa cells (upper panel) and HEK cells (middle panel), B-Raf immunoprecipitated with the expressed NHE1 protein. A control of untransfected cells showed only a background immunoreactivity that occurred with the antibody used.
We confirmed that endogenous B-Raf and NHE1 were associated with each other in untransfected cells. Immunoprecipitation of B-Raf from either HeLa or HEK cells confirmed that NHE1 protein was associated (Fig. 1C). These results demonstrated that the association we observed was present with endogenous levels of the proteins, that the reverse immunoprecipitation was also possible, and that B-Raf could be used to immunoprecipitate NHE1 and maintain an association with NHE1.
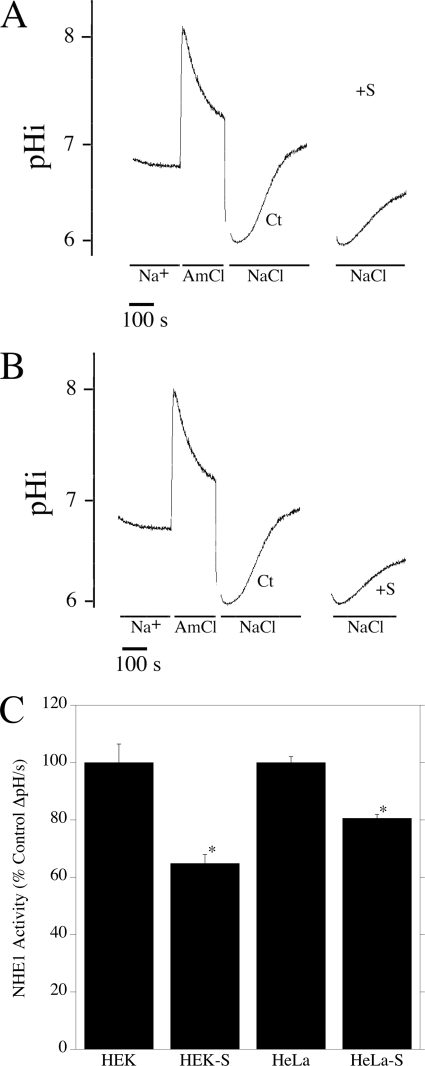
We next determined if B-Raf had a significant role in maintaining NHE1 activity in HEK and HeLa cells. Cells were subjected to an ammonium chloride-induced acid pulse, and the initial rate of recovery after acidosis was measured in the presence or absence of sorafenib, a known inhibitor of B-Raf kinase activity. The rate of recovery (ΔpH/S) for HEK and HeLa cells was 0.005 ± 0.0003 and 0.0085 ± 0.0001, respectively. For both cell types, sorafenib caused significant decreases in the rate of recovery after acid load (Fig. 2, A–C). For HeLa cells, the decrease was ∼20% of the control recovery rate (Fig. 2, A and C), although for HEK cells this was ∼35% (Fig. 2, B and C).
FIGURE 2.
Effect of sorafenib on NHE1 activity in HeLa and HEK cells. A and B, examples of measurement of Na+/H+ exchanger activity after ammonium chloride-induced acid load in HEK (A) and HeLa (B) cells. Lines indicate the presence of ammonium chloride- and NaCl-containing solutions. Traces are shown for ammonium chloride treatment and recovery in the absence of sorafenib. For clarity, only the recovery is shown for the sorafenib-treated cells. Ct, cells recovering from acid load in the absence of sorafenib. +S, cells recovering from acid load in the presence of sorafenib. C, summary of effects of sorafenib NHE1 activity. * indicates significantly decreased from the absence of sorafenib p < 0.0001. Values are mean ± S.E. of 13–21 experiments. NHE1 activity of sorafenib-treated cells is expressed as a percentage of untreated control cells. S.E. for controls were calculated from the absolute values of NHE activity.
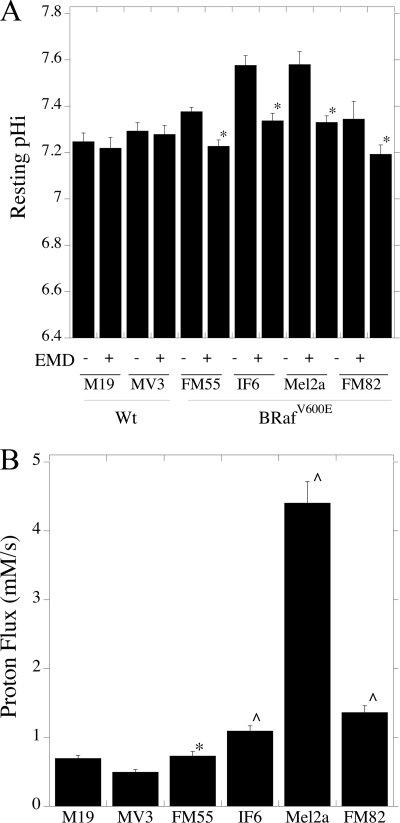
Further experiments involved the characterization of intracellular pH regulation in human melanoma cell lines. We initially examined resting intracellular pH in cell lines harboring the B-RafV600E mutation, in comparison with cell lines without this mutation. The results are shown in Fig. 3A. Resting pH was ∼7.2 in M19 and MV3 cells that do not carry the B-RafV600E mutation. In cells with the mutation, resting pH was between 0.1 and 0.3 pH units higher; in IF6 and Mel2a cells it reached a pH of almost 7.6. EMD87580 had no significant effect on resting pH in cells without the B-RafV600E mutation. However, in all other cells with the B-RafV600E mutation, EMD8750 significantly reduced the intracellular pH to levels similar (pH 7.2–7.3) to cells without the B-RafV600E mutation.
FIGURE 3.
Characterization of pHi and Na+/H+ exchanger activity in melanoma cells with the B-RafV600E mutation. A, resting intracellular pH was determined in human melanoma cell lines either with or without the B-RafV600E mutation as described under “Experimental Procedures.” Cells with the B-RafV600E mutation are indicated. +, indicates the addition of 10 μm EMD87580, a specific inhibitor of NHE1 activity. * indicates significantly decreased from the absence of EMD87580 at p < 0.01. Values are mean ± S.E. of 6–12 experiments. B, proton extrusion rates by various cells lines with or without the B-RafV600E mutation. Cells were acidified using ammonium chloride prepulse, and the initial rate of recovery was used with the buffering capacity of cells to calculate proton flux. Values are the mean ± S.E. of 6–8 experiments. ∧ indicates significantly elevated from M19 or MV3 rates at p < 0.01, * indicates significantly elevated from MV3 rates at p < 0.05.
Fig. 3B is a comparison of NHE1 activity between the various human melanoma cell lines, after being challenged by an acid load. To better compare the effects between different cell types, in these experiments, we measured buffering capacity of each cell type (supplemental Fig. S2) and compared the rates of proton flux between cells (as opposed to change in internal pH). Individual buffering capacities of each cell type were used to calculate proton flux. After being challenged by acid load, M19 and MV3 had relatively low NHE1 activity. IF6, Mel2a, and FM82 all had NHE1 activity that was significantly elevated relative to M19 and MV3 cells. The activity of FM55 cells was elevated compared with MV3 cells but was not significantly different from that of M19 cells.
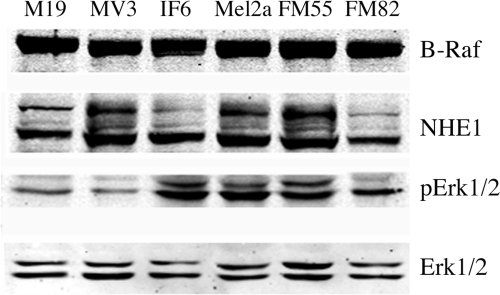
We used Western blotting to examine the levels of B-Raf and NHE1 protein in the various cell lines (Fig. 4). Immunoblotting with anti-B-Raf antibody showed that the amount of B-Raf protein was similar in the various cell types. Western blotting with anti-NHE1 antibody showed the standard pattern of two main immunoreactive bands, one fully glycosylated protein and one partial or de-glycosylated protein (24). The level of NHE1 varied somewhat from one cell type to another, but there was no consistent pattern of elevated NHE1 expression in cells with the B-RafV600E mutation. We also examined the levels of ERK1/2 and phospho-ERK1/2 levels in these cell lines. Similar levels of ERK1/2 protein were found in the various cell types. As expected, cells with the B-RafV600E mutation had an elevated level of phospho-ERK1/2 protein compared with the control M19 and MV3 cell lines.
FIGURE 4.
Western blot analysis of protein expression in human melanoma cell lines. Cell extracts were made as described under “Experimental Procedures.” Upper panel, immunotransfers were blotted with anti-B-Raf antibody. 2nd to 4th panels were immunoblotted with anti NHE1, anti-phospho-ERK1/2, and anti ERK1/2 antibodies, respectively. Results are typical of three independent experiments.
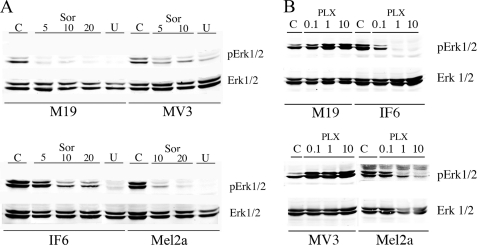
To ensure that MAPK pathways were selectively activated in the human cell lines, we tested the effect of sorafenib and U0126 on the level of phospho-ERK1/2 in M19, MV3, IF6, and Mel2a cells. Fig. 5A confirmed that the MAPK signaling pathway was functional in these cells. ERK1/2 phosphoprotein levels were inhibited by sorafenib and U0126. Sorafenib at concentrations of 5–20 μm decreased the levels of pERK1/2 as did treatment with the MEK inhibitor U0126. This occurred in the human melanoma cell lines with (IF6 and Mel2a) and without (M19 and MV3) the B-RafV600E mutation. Because sorafenib is not a very specific inhibitor of B-Raf, we also examined the effect of PLX4720, a newly developed specific inhibitor of B-RafV600E (33). PLX4720 did not affect the levels of pERK1/2 in cells without the B-RafV600E mutation but did decrease the levels of pERK1/2 in both IF6 and Mel2a cells. This result was consistent with its specific inhibition of the B-RafV600E mutation (33).
FIGURE 5.
Western blot analysis of pERK1/2 and ERK1/2 levels after treatment with sorafenib, U0126, or PLX4720. Cell lysates of M19, MV3, IF6, or Mel2a cells were analyzed for pERK1/2 and ERK1/2. Panels were immunoblotted with anti-phospho-ERK1/2 and anti-ERK1/2 antibodies as indicated. A, Sor indicates cells were treated with sorafenib at the concentrations indicated (5–20 μm) for 20 min prior to harvest. U indicates cells were treated with 10 μm U0126 for 20 min prior to harvest. C indicates mock-treated control cells. B, as in A but cells were treated with the indicated concentration of PLX4720. Results are typical of three separate experiments.
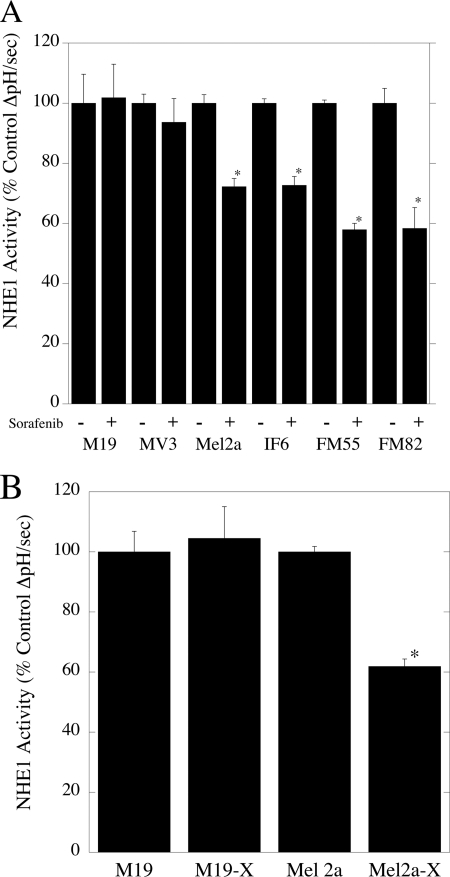
We then determined the effect of sorafenib on NHE1 activity in malignant melanoma cell lines (Fig. 6A). The absolute level of activity of the M19, MV3, Mel2a, IF6, FM55, and FM81 cells was 0.0025 ± 0.00024, 0.0016 ± 0.00005, 0.005 ± 0.00014, 0.0075 ± 0.00011, 0.0075 ± 0.00008, and 0.0058 ± 0.00029. In both M19 and MV3 cell lines without the B-RafV600E mutation, sorafenib had no effect on the rate of recovery after an acid load. In contrast, sorafenib significantly decreased NHE1 activity in cell lines harboring the B-RafV600E mutation. For Mel2a and IF6, this decrease was about 30%, and in FM55 and FM82 cells, it was ∼40%. For Mel2a and M19 cells, we also determined the effect of the more specific inhibitor of B-RafV600E PLX4720 on NHE1 activity (Fig. 6B). Similar to the results with sorafenib, PLX4720 inhibited NHE1 activity in Mel2a cells that have the B-RafV600E mutation but not in M19 cells that do not have the mutation. This observation was consistent with PLX4720 affecting NHE1 activity through the mutant B-RafV600E protein.
FIGURE 6.
Effect of sorafenib and PLX4720 on the rate of recovery from an acute acid load in malignant melanoma cell lines. A, cells were treated with 10 μm sorafenib for 20 min prior to assay, and an acute acid load was induced in cell lines in the presence or absence of 10 μm sorafenib. The rate of recovery from the acid load in the presence of sorafenib was compared with that in its absence. B, as in A but with 5 μm PLX4720. Results are mean ± S.E. of 6–8 experiments. * indicates significantly different from the rate of recovery in the absence of sorafenib or PLX4720 at p < 0.01.
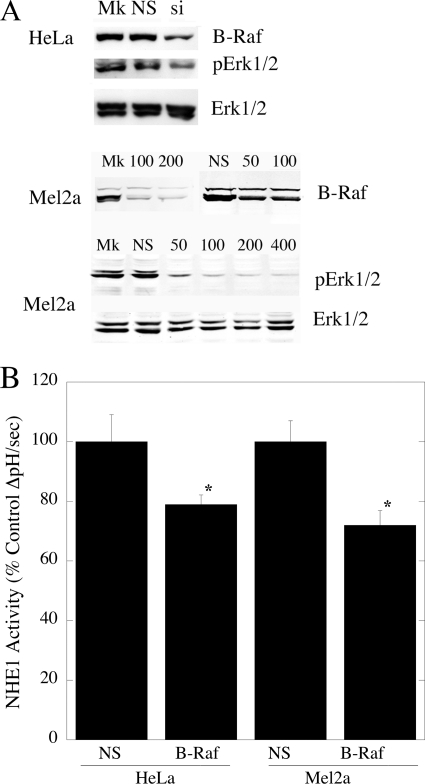
Because sorafenib is a multikinase inhibitor, we wanted to confirm that the effects of sorafenib were mediated via B-Raf. Therefore, we used siRNA to down-regulate B-Raf in two cell types, HeLa cells and Mel2a cells. The latter was chosen as it demonstrated the highest NHE1 activity of the melanoma cell types. As shown in Fig. 7A, treatment with siRNA specific to B-Raf reduced the level of this protein, although scrambled siRNA had no effect. Accordingly, upon B-Raf V600E-specific siRNA treatment, phospho-ERK1/2 levels were reduced in Mel2a and HeLa cells. Importantly, this siRNA treatment caused significant declines in NHE1 activity in both of these cell types (Fig. 7B).
FIGURE 7.
Effect of siRNA on levels of B-Raf and NHE1 in HeLa and Mel2a cells. A, Western blot analysis of effects of siRNA on B-Raf protein and phospho-ERK1/2 levels. Upper panel, mock (Mk), 200 nm nonspecific (NS), and 200 nm B-Raf siRNA (si)-treated cells immunoblotted for B-Raf protein levels. Middle panel, effect of varying concentrations of B-Raf siRNA or nonspecific siRNA on B-Raf levels of Mel2a cells. Lower panels, effect of B-Raf siRNA on phospho-ERK1/2 (pERK1/2) and ERK1/2 levels in Mel2a cells. B, effect of siRNA on NHE1 activity in HeLa and Mel2a cells. An acute acid load was induced in cells either treated with 200 nm of nonspecific or B-Raf siRNA. The rate of recovery from the acid load was compared in the two groups. Results are mean ± S.E. of at least six experiments. * indicates significantly different from the rate of recovery with nonspecific treatment at p < 0.005.
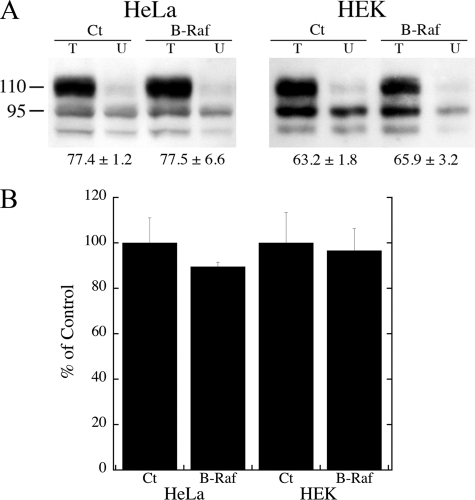
To determine whether B-Raf expression increased NHE1 by either increasing protein expression or by changing the targeting of the protein, we examined the effect of B-Raf on these two parameters. The results are shown in Fig. 8. For both HeLa and HEK cells, expression of B-Raf did not affect the efficiency of targeting or the expression level of the protein.
FIGURE 8.
Analysis of the effect of B-Raf expression on NHE1 protein levels and targeting. A, surface localization of HeLa and HEK cells expressing NHE1 protein in the presence or absence of additional NHE1 protein. Cells were transfected with NHE1 in the presence or absence of B-Raf (or empty vector). Surface localization was determined as described under “Experimental Procedures.” Equal amounts of total cell lysate (T) and unbound intracellular lysate (U) were examined by Western blotting with anti-HA antibody to identify NHE1 protein. Ct and B-Raf refer to control cells or cells expressing B-Raf. The percent of the total NHE1 protein found on the plasma membrane is indicated. Results are mean ± S.E. n = at least four determinations. There was no significant difference between control and B-Raf-transfected cells. B, summary of Western blot analysis of NHE1 expression in control HeLa or HEK cells or in cells transfected with B-Raf as in A. Expression levels of experimentals were compared with that of controls. There was no significant difference between controls (Ct) and cells transfected with B-Raf.
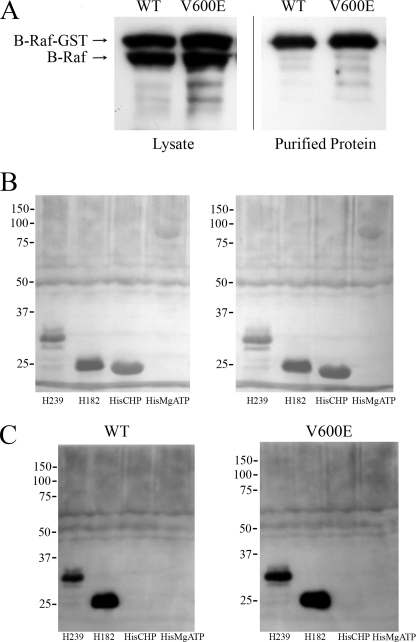
We next produced wild type and mutant B-Raf proteins and also the C terminus of the Na+/H+ exchanger to determine whether B-Raf could interact directly with the C-terminal region of NHE1. B-Raf was produced in eukaryotic cells because of the purported difficulty of production in Escherichia coli.4 A GST fusion protein of mutant and wild type B-Raf was successfully produced in HeLa cells and could be purified using the GST tag (Fig. 9A). Fig. 9A demonstrates that, as expected, the GST fusion protein of mutant and WT B-Raf was produced in HeLa cells with an apparent molecular weight greater than that of endogenous B-Raf. Upon purification via GST affinity chromatography, only the larger immunoreactive GST-tagged B-Raf protein was present.
FIGURE 9.
Analysis of in vitro association of wild type (WT) and mutant (V600E) B-Raf with the C terminus of the NHE1 protein. A, production and purification of WT and mutant B-Raf protein. B-Raf was produced by transfection of HeLa cells. Lysates and GST-purified proteins were immunoblotted with anti-B-Raf antibody. B, nitrocellulose transfer of NHE1 His-tagged protein (His-239 and His-182) and control proteins (HisCHP and MgATPase-His) stained with Ponceau S prior to overlay with B-Raf protein. C, overlay assay of NHE1 proteins with wild type (WT) and mutant (V600E) B-Raf proteins. Proteins transferred to membranes were incubated with enriched B-Raf protein as described under “Experimental Procedures.” After washing, immunoblotting was with anti-B-Raf antibody. Results are typical of five experiments.
To determine whether B-Raf could interact directly with the C terminus of NHE1, we produced and purified two C-terminal His-tagged proteins consisting of the distal 239 and 182 amino acids of the NHE1 protein. Two controls of other His-tagged proteins were also used (CHP and a MgATPase). These proteins were transferred to nitrocellulose and incubated with WT and mutant B-Raf protein. Fig. 9B shows a Ponceau S stain of the transfer to nitrocellulose membrane, which was done to confirm that the proteins transferred properly prior to incubation with B-Raf proteins. All proteins transferred to the membrane though the larger His-MgATPase appeared to transfer less effectively. After incubation with WT and mutant B-Raf proteins, we found that both the His-239 and His-182 proteins bound to both WT and mutant B-Raf protein. There was no binding to the His-tagged CHP protein or to the His-tagged MgATPase. We obtained similar results in several experiments, including whether the primary antibody to develop the overlay was either anti-B-Raf or anti-GST (which would react with the GST tag on the B-Raf protein).
DISCUSSION
In this study, we demonstrate the novel result that B-Raf binds to and regulates the NHE1 isoform of the Na+/H+ exchanger. In this regard, we initially found that B-Raf bound to the cytosolic domain of NHE1 in a screen for protein kinases binding to this region. B-Raf binding was the strongest signal that we obtained. Several other proteins were found to bind to the NHE1 C terminus. This included heat shock protein and protein phosphatase 1. We have previously demonstrated that the heat shock protein (21) and protein phosphatase 1 (34) interact with this region of the protein. NHE1 is known to be phosphorylated by p90Rsk (35), which along with ERK1/2 mediates acidosis induced activation of NHE1 (15, 36). p90Rsk also bound to the C-terminal region. We found positive results with these proteins, which suggest that the screening system demonstrated legitimate protein-protein interactions. Interestingly, several other kinases bound to the C terminus, including several isoforms of protein kinase C. Although protein kinase C has been suggested to play a regulatory role for NHE1 (37), this and several other potential regulators were not investigated at this time.
Because of its important physiological and pathological role, and because B-Raf demonstrated the strongest signal in our system, we investigated its interactions with the NHE1. In two different cell types, we found NHE1 and B-Raf form a complex together as demonstrated by immunoprecipitation. The nature of the complex, whether direct or indirect, is not known. NHE1 is a target for multiple protein kinases, including MAPK (9), and it has been suggested that they may exist as complexes with other members of their pathway (38, 39). It is possible that B-Raf is one member of a complex, although this still has to be demonstrated.
We examined the functional significance of B-Raf association with the NHE1 protein. Initial experiments used the nonselective kinase inhibitor sorafenib. This compound has been used previously as a B-Raf inhibitor in clinical trials (40), but it is known to be not entirely specific for B-Raf (41). These experiments showed that sorafenib inhibited NHE1 activity in HEK and HeLa cell lines, suggesting a possible link between B-Raf and pH regulation by NHE1. Because hyperactive B-RafV600E has been implicated in human melanomas (17), we examined pH regulation in several human melanoma cell lines with or without the B-RafV600E mutation. It was of note that human melanoma cells with this mutation had elevated resting intracellular pH values and increased the proton flux that was abolished by sorafenib. The activation of NHE1 was likely through the ERK1/2 pathway because B-Raf is known to act through this pathway that has been shown to stimulate NHE1 activity (15, 16). Because sorafenib is not entirely specific for B-Raf, we also used PLX4720, a specific B-RafV600E inhibitor (33). This inhibitor also reduced activity of the NHE1 protein in Mel2a cells with the B-RafV600E mutation, but not in M19 cells that do not have this mutation. In addition it blocked activation of the ERK1/2 pathway in cells with the B-RafV600E mutation. This provided further evidence that the mutant B-RafV600E protein specifically activates the NHE1 protein. We also used down-regulation of B-Raf to confirm that the increase in NHE1 activity we observed was due to B-Raf. Specific down-regulation of B-Raf levels in multiple cell lines decreased NHE1 activity.
Our results suggested that there is an activation of the NHE protein in cell lines with the B-RafV600E mutation, which does not occur in cell lines without this mutation. This activation results in elevation of resting intracellular pH in the cell lines with the mutated B-RafV600E protein as demonstrated in Fig. 3A. We suggest that there is a shift in the set point of the NHE1 protein in cell lines with the mutant B-RafV600E protein. Wild type B-Raf appears to have a regulatory role in some cell lines (Fig. 7B), but this seems to be accentuated when the V600E mutation is present. As noted above, the inhibition of NHE1 activity by PLX4720, in Mel2a cells but not in M19 cells, supports this hypothesis.
A number of studies have shown that activation of the NHE1 isoform of the Na+/H+ exchanger facilitates cell growth and metastasis. Activation of the NHE1 protein has been shown to promote metastasis in human mammary epithelial cells (13). Protons extruded by NHE1 may lead to local extracellular acidification promoting cell invasive behavior (12). This mechanism has been suggested to be of importance in human melanoma cells (42, 43). Regulation of NHE1 in association with cell invasion is therefore of significant clinical interest (8). Our results suggest that B-Raf regulation of the NHE1 could, at least partially, stimulate the NHE1 protein and might contribute to the pro-carcinogenic behavior of B-Raf. Other studies have suggested an involvement of this pathway. Acidosis has earlier been shown to activate NHE1 through a pathway dependent on Ras/Raf/MEK (36), and Raf-1 kinase up-regulates NHE1 activity in the Na+/H+ exchanger in Xenopus oocytes (44).
The effects we observed were most likely due to regulation of NHE1. We demonstrated that the effect of B-Raf was not through an effect on either expression levels of NHE1 or on targeting of NHE1.
It was of interest that B-Raf elevated resting pHi in melanoma cell lines and that this was prevented by inhibition of NHE1. Intracellular pH has been linked to cell proliferation. Intracellular alkalinization in the absence of mitogens can induce DNA synthesis and stimulate proliferation. Imposing intracellular alkalinization alone can trigger cell growth (45). NHE-dependent intracellular alkalinization has also been shown to be an early event in malignant transformation and can play an essential role in the development of transformation-associated phenotypes (46). The elevation of intracellular pH by B-Raf in human melanoma cells may therefore be contributing to the abnormal growth phenotype observed in these cells. Future experiments will examine the downstream effects of NHE1 activation.
Although our results have demonstrated that B-Raf binds to the NHE1 protein, we have not yet localized the exact binding site. We showed that B-Raf can directly bind to the C-terminal 182 amino acids of the NHE1 protein. In these experiments we used other His-tagged proteins to confirm that the binding was to NHE1 and not to the His tag on the protein. It was not clear if the binding was increased in the mutant versus wild type of protein. Future experiments may localize the binding site more precisely. An interesting aspect of Erk stimulation is recently emerging in the literature. Evidence has suggested the ERK, MEK, p90Rsk, Raf-1, PAK5, and 14-3-3 exist as complexes in some cell types (38, 39, 47–50). These complexes can regulate activity of some proteins acting through scaffold proteins (39, 50, 51). It is not yet known if B-Raf regulates NHE1 through part of a complex, although we did find that p90Rsk also associated with the NHE1 C terminus (Table 1).
Overall, our results demonstrate for the first time that the NHE1 protein is an important target of the B-Raf kinase in different cell types, including human melanoma cells with activated B-RafV600E. We demonstrate that B-Raf elevates NHE1 activity and elevates pHi in these cells.
Acknowledgments
We thank Dr. J. M. Kyriakis (Tufts University School of Medicine) for the gift of the plasmids pEBG-B-RafWT and pEBG-B-RafV600E and Dr. J. Stone (Department of Biochemistry, University of Alberta) for the gift of antibody. We also thank Dr. Richard Marais (Institute of Cancer Research, United Kingdom Center for Cell and Molecular Biology) for the pEFm-B-Raf plasmids. We are grateful to Dr. H. Young (Department of Biochemistry, University of Alberta) for the gift of His-tagged MgATPase protein.
Footnotes
This work was supported in part by a grant from the Canadian Institutes of Health Research (to L. F.).

The on-line version of this article (available at http://www.jbc.org) contains supplemental Figs. S1 and S2.
R. Marais, personnel communication.
REFERENCES
- 1. Fliegel L. (2005) Int. J. Biochem. Cell Biol. 37, 33–37 [DOI] [PubMed] [Google Scholar]
- 2. Slepkov E. R., Rainey J. K., Sykes B. D., Fliegel L. (2007) Biochem. J. 401, 623–633 [DOI] [PMC free article] [PubMed] [Google Scholar]
- 3. Fliegel L. (2009) Expert Opin. Ther. Targets 13, 55–68 [DOI] [PubMed] [Google Scholar]
- 4. Avkiran M. (2001) Basic Res. Cardiol. 96, 306–311 [DOI] [PubMed] [Google Scholar]
- 5. Lazdunski M., Frelin C., Vigne P. (1985) J. Mol. Cell. Cardiol. 17, 1029–1042 [DOI] [PubMed] [Google Scholar]
- 6. Karmazyn M., Sawyer M., Fliegel L. (2005) Curr. Drug Targets Cardiovasc. Haematol. Disord. 5, 323–335 [DOI] [PubMed] [Google Scholar]
- 7. Wang H., Singh D., Fliegel L. (1997) J. Biol. Chem. 272, 26545–26549 [DOI] [PubMed] [Google Scholar]
- 8. Cardone R. A., Casavola V., Reshkin S. J. (2005) Nat. Rev. Cancer 5, 786–795 [DOI] [PubMed] [Google Scholar]
- 9. Malo M. E., Fliegel L. (2006) Can. J. Physiol. Pharmacol. 84, 1081–1095 [DOI] [PubMed] [Google Scholar]
- 10. Meima M. E., Mackley J. R., Barber D. L. (2007) Curr. Opin. Nephrol. Hypertens. 16, 365–372 [DOI] [PubMed] [Google Scholar]
- 11. Baumgartner M., Patel H., Barber D. L. (2004) Am. J. Physiol. Cell Physiol. 287, C844–C850 [DOI] [PubMed] [Google Scholar]
- 12. Stock C., Cardone R. A., Busco G., Krähling H., Schwab A., Reshkin S. J. (2008) Eur. J. Cell Biol. 87, 591–599 [DOI] [PubMed] [Google Scholar]
- 13. Paradiso A., Cardone R. A., Bellizzi A., Bagorda A., Guerra L., Tommasino M., Casavola V., Reshkin S. J. (2004) Breast Cancer Res. 6, R616–R628 [DOI] [PMC free article] [PubMed] [Google Scholar]
- 14. Reshkin S. J., Bellizzi A., Albarani V., Guerra L., Tommasino M., Paradiso A., Casavola V. (2000) J. Biol. Chem. 275, 5361–5369 [DOI] [PubMed] [Google Scholar]
- 15. Malo M. E., Li L., Fliegel L. (2007) J. Biol. Chem. 282, 6292–6299 [DOI] [PubMed] [Google Scholar]
- 16. Coccaro E., Karki P., Cojocaru C., Fliegel L. (2009) Am. J. Physiol. Heart Circ. Physiol. 297, H846–H858 [DOI] [PubMed] [Google Scholar]
- 17. Davies H., Bignell G. R., Cox C., Stephens P., Edkins S., Clegg S., Teague J., Woffendin H., Garnett M. J., Bottomley W., Davis N., Dicks E., Ewing R., Floyd Y., Gray K., Hall S., Hawes R., Hughes J., Kosmidou V., Menzies A., Mould C., Parker A., Stevens C., Watt S., Hooper S., Wilson R., Jayatilake H., Gusterson B. A., Cooper C., Shipley J., Hargrave D., Pritchard-Jones K., Maitland N., Chenevix-Trench G., Riggins G. J., Bigner D. D., Palmieri G., Cossu A., Flanagan A., Nicholson A., Ho J. W., Leung S. Y., Yuen S. T., Weber B. L., Seigler H. F., Darrow T. L., Paterson H., Marais R., Marshall C. J., Wooster R., Stratton M. R., Futreal P. A. (2002) Nature 417, 949–954 [DOI] [PubMed] [Google Scholar]
- 18. Flaherty K., Puzanov I., Sosman J., Kim K., Ribas A., McArthur G., Lee R. J., Grippo J. F., Nolop K., Chapman P. (2009) J. Clin. Oncol. 27, 15S. [DOI] [PMC free article] [PubMed] [Google Scholar]
- 19. Sheridan C., Brumatti G., Martin S. J. (2008) J. Biol. Chem. 283, 22128–22135 [DOI] [PubMed] [Google Scholar]
- 20. Leonoudakis D., Conti L. R., Anderson S., Radeke C. M., McGuire L. M., Adams M. E., Froehner S. C., Yates J. R., 3rd, Vandenberg C. A. (2004) J. Biol. Chem. 279, 22331–22346 [DOI] [PubMed] [Google Scholar]
- 21. Silva N. L., Haworth R. S., Singh D., Fliegel L. (1995) Biochemistry 34, 10412–10420 [DOI] [PubMed] [Google Scholar]
- 22. Michalak M., Fliegel L., Wlasichuk K. (1990) J. Biol. Chem. 265, 5869–5874 [PubMed] [Google Scholar]
- 23. Schrama D., Keller G., Houben R., Ziegler C. G., Vetter-Kauczok C. S., Ugurel S., Becker J. C. (2008) J. Carcinog. 7, 1. [DOI] [PMC free article] [PubMed] [Google Scholar]
- 24. Slepkov E. R., Chow S., Lemieux M. J., Fliegel L. (2004) Biochem. J. 379, 31–38 [DOI] [PMC free article] [PubMed] [Google Scholar]
- 25. Li X., Liu Y., Alvarez B. V., Casey J. R., Fliegel L. (2006) Biochemistry 45, 2414–2424 [DOI] [PubMed] [Google Scholar]
- 26. Li X., Liu Y., Kay C. M., Müller-Esterl W., Fliegel L. (2003) Biochemistry 42, 7448–7456 [DOI] [PubMed] [Google Scholar]
- 27. Murtazina R., Booth B. J., Bullis B. L., Singh D. N., Fliegel L. (2001) Eur. J. Biochem. 268, 4674–4685 [DOI] [PubMed] [Google Scholar]
- 28. Silva N. L., Wang H., Harris C. V., Singh D., Fliegel L. (1997) Pflugers Arch. 433, 792–802 [DOI] [PubMed] [Google Scholar]
- 29. Cui Y., Guadagno T. M. (2008) Oncogene 27, 3122–3133 [DOI] [PubMed] [Google Scholar]
- 30. Karki P., Coccaro E., Fliegel L. (2010) Biochim. Biophys. Acta 1798, 1565–1576 [DOI] [PubMed] [Google Scholar]
- 31. Zhao Y., Zhang Y., Yang Z., Li A., Dong J. (2008) Biochem. Biophys. Res. Commun. 370, 509–513 [DOI] [PubMed] [Google Scholar]
- 32. Elbashir S. M., Harborth J., Lendeckel W., Yalcin A., Weber K., Tuschl T. (2001) Nature 411, 494–498 [DOI] [PubMed] [Google Scholar]
- 33. Tsai J., Lee J. T., Wang W., Zhang J., Cho H., Mamo S., Bremer R., Gillette S., Kong J., Haass N. K., Sproesser K., Li L., Smalley K. S., Fong D., Zhu Y. L., Marimuthu A., Nguyen H., Lam B., Liu J., Cheung I., Rice J., Suzuki Y., Luu C., Settachatgul C., Shellooe R., Cantwell J., Kim S. H., Schlessinger J., Zhang K. Y., West B. L., Powell B., Habets G., Zhang C., Ibrahim P. N., Hirth P., Artis D. R., Herlyn M., Bollag G. (2008) Proc. Natl. Acad. Sci. U.S.A. 105, 3041–3046 [DOI] [PMC free article] [PubMed] [Google Scholar]
- 34. Misik A. J., Perreault K., Holmes C. F., Fliegel L. (2005) Biochemistry 44, 5842–5852 [DOI] [PubMed] [Google Scholar]
- 35. Takahashi E., Abe J., Gallis B., Aebersold R., Spring D. J., Krebs E. G., Berk B. C. (1999) J. Biol. Chem. 274, 20206–20214 [DOI] [PubMed] [Google Scholar]
- 36. Haworth R. S., Dashnyam S., Avkiran M. (2006) Biochem. J. 399, 493–501 [DOI] [PMC free article] [PubMed] [Google Scholar]
- 37. Anwer M. S. (1994) Hepatology 20, 1309–1317 [PubMed] [Google Scholar]
- 38. Lundquist J. J., Dudek S. M. (2006) Brain Cell Biol. 35, 267–281 [DOI] [PMC free article] [PubMed] [Google Scholar]
- 39. Kolch W. (2005) Nat. Rev. Mol. Cell Biol. 6, 827–837 [DOI] [PubMed] [Google Scholar]
- 40. Smalley K. S., Flaherty K. T. (2009) Future Oncol. 5, 775–778 [DOI] [PubMed] [Google Scholar]
- 41. Pratilas C. A., Solit D. B. (2007) Rev. Recent Clin. Trials 2, 121–134 [DOI] [PubMed] [Google Scholar]
- 42. Stüwe L., Müller M., Fabian A., Waning J., Mally S., Noël J., Schwab A., Stock C. (2007) J. Physiol. 585, 351–360 [DOI] [PMC free article] [PubMed] [Google Scholar]
- 43. Stock C., Mueller M., Kraehling H., Mally S., Noël J., Eder C., Schwab A. (2007) Cell. Physiol. Biochem. 20, 679–686 [DOI] [PubMed] [Google Scholar]
- 44. Kang M. G., Kulisz A., Wasserman W. J. (1998) Biol. Cell 90, 477–485 [PubMed] [Google Scholar]
- 45. Grinstein S., Rotin D., Mason M. J. (1989) Biochim. Biophys. Acta 988, 73–97 [DOI] [PubMed] [Google Scholar]
- 46. Reshkin S. J., Bellizzi A., Caldeira S., Albarani V., Malanchi I., Poignee M., Alunni-Fabbroni M., Casavola V., Tommasino M. (2000) FASEB J. 14, 2185–2197 [DOI] [PubMed] [Google Scholar]
- 47. Wang X., Studzinski G. P. (2006) J. Cell. Physiol. 209, 253–260 [DOI] [PMC free article] [PubMed] [Google Scholar]
- 48. Wu X., Carr H. S., Dan I., Ruvolo P. P., Frost J. A. (2008) J. Cell. Biochem. 105, 167–175 [DOI] [PMC free article] [PubMed] [Google Scholar]
- 49. Edmunds J. W., Mahadevan L. C. (2004) J. Cell Sci. 117, 3715–3723 [DOI] [PubMed] [Google Scholar]
- 50. Ren J. G., Li Z., Sacks D. B. (2007) Proc. Natl. Acad. Sci. U.S.A. 104, 10465–10469 [DOI] [PMC free article] [PubMed] [Google Scholar]
- 51. Camiña J. P., Lodeiro M., Ischenko O., Martini A. C., Casanueva F. F. (2007) J. Cell. Physiol. 213, 187–200 [DOI] [PubMed] [Google Scholar]


