

Abstract
The G380R mutation in the transmembrane domain of fibroblast growth factor receptor 3 (FGFR3) causes achondroplasia, the most common form of human dwarfism. Achondroplasia is a heterozygous disorder, and thus the affected individuals express both wild-type and mutant FGFR3. Yet heterodimerization in achondroplasia has not been characterized thus far. To investigate the formation of FGFR3 heterodimers in cellular membranes, we designed an FGFR3 construct that lacks the kinase domain, and we monitored the formation of inactive heterodimers between this construct and wild-type and mutant FGFR3. The formation of the inactive heterodimers depleted the pool of full-length receptors capable of forming active homodimers and ultimately reduced their phosphorylation. By analyzing the effect of the truncated FGFR3 on full-length receptor phosphorylation, we demonstrated that FGFR3 WT/G380R heterodimers form with lower probability than wild-type FGFR3 homodimers at low ligand concentration. These results further our knowledge of FGFR3-associated bone disorders.
Keywords: Membrane Biophysics, Membrane Proteins, Protein-Protein Interactions, Receptor Tyrosine Kinase, Signal Transduction, Dwarfism, Heterodimerization
Introduction
The G380R mutation in fibroblast growth factor receptor 3 (FGFR3) transmembrane (TM)2 domain has been linked to achondroplasia, the most common form of human dwarfism (1). Achondroplasia, characterized by short stature, is a common (1 in 15,000 live births) autosomal dominant disorder that interferes with the maturation of the cartilage growth plate of long bones (2–4). The affected protein, FGFR3, is a receptor tyrosine kinase. Its activation, manifested in the autophosphorylation of its kinase domain, involves lateral dimerization and binding of FGF ligands and heparan sulfate (5, 6). Ligand binding increases receptor activation by stabilizing the dimers and perhaps altering the dimer structure (7–11).
In cellular studies, the G380R mutation increases FGFR3 phosphorylation in the absence of ligand and at low ligand concentration (12–15). The increase, which is the likely cause for pathogenesis, has been linked to an increase in the phosphorylation of the unliganded dimer (13). However, FGFR3 dimerization does not appear affected by the G380R mutation, as both the wild-type FGFR3 and the G380R mutant show very similar cross-linking and dimerization propensities (13).
Achondroplasia is a heterozygous disorder, and thus the affected individuals express both wild-type and mutant FGFR3. In this paper, we address the question whether mutant FGFR3 receptors heterodimerize with the wild type. Currently, the answer to this question is unknown. Most studies of FGFR3 activation thus far have focused on FGFR3 homodimers, because the detection of heterodimers is challenging. When both wild-type and mutant FGFR3 molecules are present in cells, three different dimeric species can co-exist as follows: 1) wild-type homodimers, 2) mutant homodimers, and 3) wild-type/mutant heterodimers (16). These dimers will be indistinguishable in many experiments, and their abundance will depend on the respective expression levels and on the dimerization propensities, which are unknown. Furthermore, the wild-type and mutant unliganded dimer structures have been proposed to be different (13, 17), and thus the formation and the stability of heterodimers cannot even be predicted based on previous homodimerization studies.
To investigate the formation of FGFR3 heterodimers in a cellular environment, here we designed an FGFR3 construct that lacks the kinase domain, and we monitored the formation of heterodimers between this construct and full-length wild-type and mutant FGFR3. Such full-length/truncated heterodimers will be inactive. They will deplete the pool of full-length receptors capable of forming homodimers and ultimately reduce the concentration of active homodimers. Thus, the presence of the truncated receptors will lead to a decrease in the phosphorylation of the full-length receptor if the full-length and the truncated receptors dimerize. This decrease in phosphorylation can be measured experimentally.
We use this approach to compare the likelihood of formation of FGFR3 WT/WT homodimers, WT/G380R heterodimers, and heterodimers between WT and a different pathogenic FGFR3 mutant, A391E (see Fig. 1). The A391E mutation in FGFR3 TM domain is linked to a different heterozygous disorder, Crouzon syndrome with acanthosis nigricans (18). The G380R and A391E mutations are both localized in FGFR3 TM domain, and it is puzzling why they lead to two very different phenotypes (skeletal dysplasia versus craniosynostosis) (19, 20). Our results demonstrate that FGFR3 WT/G380R heterodimers form with lower probability than wild-type homodimers and WT/A391E heterodimers at low ligand concentration. Thus, here we provide evidence for a key difference in the behavior of the two mutants, namely a difference in the interactions between the wild type and the two mutants.
FIGURE 1.

Overview of experimental design. The schematic depicts the three types of dimers present in each cell line. Only the full-length FGFR3 homodimers are active: wild-type FGFR3 is shown in yellow; the G380R mutant is shown in green, and the A391E mutant is shown in blue. The presence of the truncated ECTMWT-1 construct (yellow) leads to the formation of full-length/truncated heterodimers that are inactive. They deplete the pool of full-length receptors capable of forming homodimers and ultimately reduce the concentration of active homodimers. The assay measures the decrease in the phosphorylation of the full-length receptors.
MATERIALS AND METHODS
Cell Culture
Human embryonic kidney (HEK) 293 cells were cultured in DMEM supplemented with 10% fetal bovine serum (FBS). Cells were maintained in the incubator with 5% CO2 at 37 °C.
Creation of Stable Cell Lines
HEK 293 cells were transfected with one of the plasmids encoding FGFR3/WT, FGFR3/G380R, or FGFR3/A391E. Twenty four hours after transfection, culture medium was replaced by medium supplemented with 0.6 μg/ml Geneticin® (G418, Invitrogen). Two or 3 days later, the cells that grew to about 90% confluency were passed and seeded with high dilution ratio into 150-mm cell culture dishes. The medium with antibiotics was replaced every 2–3 days until colonies of cells appeared around 2 weeks after the initial seeding. Eight colonies from each dish were selected and cultured in 24-well plates. The expression levels of FGFR3/WT, FGFR3/G380R, and FGFR3/A391E were analyzed by Western blots, and three cell lines with the same stable receptor expression were selected. These cell lines were further amplified and used in the experiments.
Construction of Truncated FGFR3 Plasmids
The plasmids utilized the pcDNATM 3.1(+) vector (Invitrogen), which contains a human cytomegalovirus immediate-early (CMV) promoter for high level expression in a wide range of mammalian cells, a T7-priming site, and a multiple cloning site. Genes encoding the truncated versions of human wild-type FGFR3 were constructed by ligation of the transmembrane PCR products using HindIII and XbaI restriction sites. The gene sequences were amplified using a forward primer with a HindIII restriction enzyme site and a reverse primer with an XbaI restriction enzyme site, prior to ligation into the pcDNATM 3.1(+) vector. The truncated constructs are shown in Fig. 1. ECTMWT-1 contains the complete extracellular and TM domains of FGFR3, ending at Arg399 (see Fig. 1). ECTMWT-2, ending at residue Ala391, contains the extracellular domain of FGFR3 and part of the TM domain. ECTMWT-3, ending at residue Ser445, contains the extracellular, TM, and a part of the juxtamembrane domain of FGFR3. NeuECTM contains the extracellular and TM domains of Neu, ending at residue Arg680.
Transfection and Immunostaining
HEK 293 cells were transfected with the plasmids encoding the truncated receptors using FuGENE HD (Roche Applied Science) according to the manufacturer's protocol. Cells were cultured in normal medium for 24 h following transfection. After fixing with 3% paraformaldehyde, cells were blocked using bovine serum albumin (BSA) for 1 h. Cells were then incubated with anti-N-FGFR3 antibodies (SC-9007, Santa Cruz Biotechnology) overnight at 4 °C, followed by secondary antibodies (Alexa Fluor 488 goat anti-rabbit IgG (H+L) (Invitrogen)). The distribution of the secondary antibodies was visualized using a confocal laser scanning microscope (Nikon, Japan).
Flow Cytometry Measurements
HEK 293 cells were transfected with a pcDNA 3.1(+) empty vector or the plasmid encoding ECTMWT-1. Twenty four hours later, cells were starved in serum-free DMEM for another 24 hours. The cells were suspended in 5 mm EDTA and washed with 3% FBS/PBS. ECTMWT-1 expressed on the cell surface was stained with anti-N-FGFR3 antibodies (SC-9007, Santa Cruz Biotechnology). The cells were then incubated in the solution of fluorescein-conjugated anti-rabbit IgG (401314, EMD Chemicals). Measurements were performed with a FACSCalibur flow cytometer (BD Biosciences). The percentage of cells expressing ECTMWT-1 was determined using FCS express software (De Novo Software).
Western Blots
After culture in normal medium for 24 h following transfection and then starvation in serum-free medium for 24 h, cells were lysed with lysis buffer (25 mm Tris-Cl, 0.5% Triton X-100, 20 mm NaCl, 2 mm EDTA, 2 mm NaVO4, and protease inhibitor from Roche Applied Science). In some experiments cells were incubated in medium supplemented with FGF1 (Millipore, MA), before they were lysed. After spinning at 15,000 × g for 15 min at 4 °C, the supernatant was collected, and the pellet was discarded. Protein concentration was determined using the BCATM assay kit (Pierce). The lysate was loaded into 3–8% NuPAGE® Novex® Tris acetate mini gels (Invitrogen). Proteins were separated by electrophoresis and transferred onto nitrocellulose membranes. The membrane was blocked in milk for 1 h at room temperature and then stained with either anti-N-FGFR3 (H-100) antibodies (sc-9007, Santa Cruz Biotechnology), anti-C-FGFR3 antibodies (sc-123, Santa Cruz Biotechnology), or phospho-Tyr-FGFR antibodies (anti-Tyr653/654, Cell Signaling Technology). ECLTM detection reagent (GE Healthcare) was used to visualize the secondary anti-mouse or anti-rabbit HRP-conjugated antibodies (Promega). The bands were quantified using ImageQuant TL (GE Healthcare).
Quantification of Western Blot Results and Statistical Analysis
The Western blot films were scanned and processed with ImageQuant TL. At least three sets of independent experiments were performed to determine the averages, the standard deviations, and the standard errors.
The inhibition of the receptors in the stable lines was determined by taking the ratio of anti-Tyr653/654 staining intensities in the presence and absence of ECTMWT-1. Each data point was the result of three independent measurements, expressed as means ± S.E. To reduce the inordinate impact of the few measurements with fortuitously small errors, we assumed that all inhibition data had the same relative error. Composite errors were calculated from inhibition data with an intercept of 0.06 and a slope of 0.14, values that were determined by a linear regression analysis of measured standard errors versus inhibition.
To determine whether there was statistically significant inhibition across the range of ligand concentrations, we performed a χ2 test (21) in which the χ2 contribution of each point, i, is shown in Equation 1,
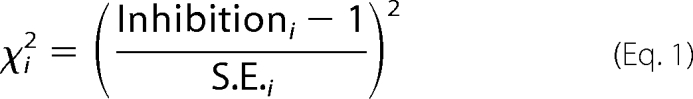 |
where 1 is the expected value in the case of no inhibition. In a set of measurements in which the expected and observed values differ only by random experimental error, the χ2 values will have a mean of around 1, with a 95% confidence interval of about 0–2. The total reduced χ2 for the whole curve was calculated according to Equation 2,
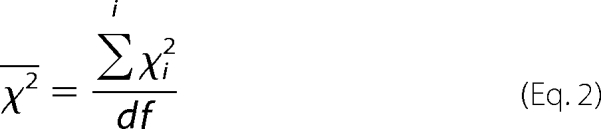 |
where df is the degrees of freedom (the number of points in the curve minus 1). The reduced χ2 will be approximately 1 if the data do not differ from the null hypothesis (no inhibition) by more than the experimentally determined standard errors. Once the reduced χ2 was calculated, we determined a p value for the null hypotheses that the observed values are sampled from a parent population with a mean equal to the expected value. The p values for the calculated reduced χ2 values were determined using a χ2 table (21) with a p value < 0.05 considered significant.
The χ2 test was also used to assess the statistical difference between different inhibition curves, a and b. In this case, reduced χ2 was calculated by summing the difference over the curves for each ligand concentration, i, as shown in Equation 3,
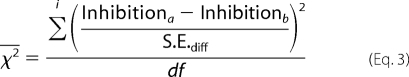 |
where S.E.diff is the standard error of the difference between two points, calculated by error propagation shown in Equation 4,
 |
As above, the p value for the reduced χ2 was determined using a χ2 table (21), with a p value < 0.05 considered significant.
RESULTS
Expression and Membrane Localization of Truncated FGFR3
The presence of a truncated RTK construct lacking the kinase domain is expected to decrease phosphorylation of full-length RTKs via the formation of inactive full-length/truncated dimers (Fig. 1). First, we sought to confirm this expectation for FGFR3 by investigating whether a truncated FGFR3 construct without the kinase domain can indeed inhibit FGFR3 phosphorylation. Second, we sought to determine whether the exact point of truncation affects the inhibition. Toward this goal, we constructed plasmids encoding three different versions of truncated FGFR3, with extracellular and transmembrane domains but no kinase domains. The three plasmids (ECTMWT-1, ECTMWT-2, and ECTMWT-3), which differ in the exact point of truncation, are shown schematically in Fig. 2A. The hydrophobic membrane-embedded TM domain is underlined in Fig. 2A. We also created a similarly truncated version of an unrelated RTK, Neu, also shown in Fig. 2A, to serve as a control.
FIGURE 2.

A, FGFR3 and Neu constructs used in the study. The abbreviations used are as follows: EC, extracellular domain; TM, transmembrane domain; JM, juxtamembrane domain; KIN, kinase domain. B, immunofluorescence staining of the truncated FGFR3 constructs (ECTMWT-1, ECTMWT-2, and ECTMWT-3) and the NeuECTM construct, expressed in HEK 293 cells. Intact cells were stained with anti-N-FGFR3 or anti-N-Neu antibodies without cell permeabilization. These antibodies recognize the extracellular domains of the truncated constructs. The secondary antibody used was Alexa Fluor 488 goat anti-rabbit IgG (H+L). Scale bar, 100 μm. C, expression levels of truncated FGFR3 and Neu, as detected by Western blots, probed by anti-N-FGFR3 antibodies. Actin staining served as a loading control. 1, empty vector; 2, ECTMWT-1; 3, ECTMWT-2; 4, ECTMWT-3; and 5, Neu-ECTM.
HEK 293 cells were transfected with the plasmids encoding the four truncated receptors. Twenty four hours after transfection, the localization of these truncated receptors on the cell surface was detected via immunostaining without permeabilization, using antibodies against the N termini of the truncated receptors (anti-N-FGFR3 or anti-N-Neu antibodies), followed by fluorescent secondary antibodies. As seen in Fig. 2B, all four truncated receptors are expressed on the cell surface.
Next, we used Western blotting to probe the expression and the molecular weight of the truncated FGFR3 constructs (ECTMWT-1, ECTMWT-2, and ECTMWT-3). In these experiments HEK 293 cells were transfected with plasmids encoding the truncated receptor, and lysed; the lysates were subjected to Western blotting. The cellular proteins were separated by molecular weight using SDS-PAGE, and the expression of the truncated FGFR3 constructs was detected by blotting with anti-N-FGFR3 (SC-9007, Santa Cruz Biotechnology) antibodies that recognize the extracellular domain of FGFR3. The results are shown in Fig. 2C.
The full-length FGFR3 has the following three forms, with different degrees of N-glycosylation: a 98-kDa native form which is rarely observed, a 120-kDa partially glycosylated form, and a 130-kDa fully glycosylated form (22). The calculated molecular masses of the truncated receptors, based on their primary amino acid sequences, are 39, 40, and 46 kDa for ECTMWT-1, ECTMWT-2. and ECTMWT-3 respectively. As seen in Fig. 2C, there are two bands for each truncated FGFR3 at positions higher than their predicted molecular weight. These two bands correspond to the expected degrees of truncated receptor glycosylation.
Effect of Truncated FGFR3 on FGFR3 Phosphorylation in Stable Cell Lines
Three stable HEK 293 cell lines, expressing FGFR3/WT, FGFR3/G380R, and FGFR3/A391E, were created as described under “Materials and Methods.” The G380R mutant is linked to achondroplasia, the most common form of short limb human dwarfism, and the A391E mutant is linked to Crouzon syndrome (a craniosynostosis) with acanthosis nigricans (a skin disorder). The three stable cells were transfected with the plasmids encoding the truncated receptors, ECTMWT-1, ECTMWT-2, and ECTMWT-3 and NeuECTM. Cells transfected with an empty pcDNA 3.1+ vector served as a control. Twenty four hours after transfection, the cell culture medium was replaced by serum-free medium. Another 24 h later, cells were stimulated with 100 ng/ml of the ligand FGF1. After incubating with the ligand for 10 min, cells were rinsed with cold PBS and lysed. The lysates were subjected to Western blotting (see supplemental Fig. S1). The phosphorylation of full-length wild-type and mutant FGFR3 in the three stable cell lines was detected using anti-p-FGFR3 (anti-Tyr653/654). Although these antibodies have been generated to recognize phosphorylated Tyr653 and Tyr654 in FGFR1, they also specifically recognize the analogous Tyr647 and Tyr648 in FGFR3 (13). Tyr647 and Tyr648 are located in the activation loop of FGFR3 kinase domain and are essential for FGFR3 biological function. The total FGFR3 expression, however, was probed using anti-C-FGFR3 antibodies, which are reactive to the C terminus of FGFR3 and thus detect only full-length FGFR3 but not the truncated receptors.
Fig. 3 shows the results of three independent Western blot experiments and demonstrates that all three FGFR3 truncated constructs inhibited the phosphorylation of wild-type and mutant FGFR3, with phosphorylation levels reduced to about 20% of the control. The truncated Neu construct, however, did not inhibit significantly either wild-type FGFR3 or the two mutants, despite the fact that it is expressed similarly on the cell surface (Fig. 2B). In particular, the calculated p values for the null hypothesis of no inhibition by NeuECTM according to Student's t test were 0.27, 0.47, and 0.68 for FGFR3/WT, FGFR3/G380R, and FGFR3/A391E, respectively, demonstrating a lack of significant effect. Thus, all three FGFR3 truncated constructs, ECTMWT-1, ECTMWT-2, and ECTMWT-3, inhibited the activation of FGFR3 in a specific manner. Importantly, there were no significant differences in the effects of these three truncated receptors on the phosphorylation of the wild type and the two mutants, indicating that the exact point of truncation is not critical. One of the truncated receptors, ECTMWT-1, was selected for further studies.
FIGURE 3.

Effect of the truncated receptors on the phosphorylation levels of FGFR3/WT (A), FGFR3/G380R (B), and FGFR3/A391E (C) in stable cells. In these experiments HEK 293 cells, stably expressing full-length receptors, were transfected with plasmids encoding the truncated constructs. Cells were incubated with 100 ng/ml FGF1 for 10 min before lysis.
Expression of Full-length Receptors and ECTMWT-1 in the Three Stable Cell Lines
FGFR3/WT, FGFR3/G380R, and FGFR3/A391E stable cells were transfected with the plasmid encoding ECTMWT-1. The stable expression of full-length FGFR3 was probed using anti-C-FGFR3 antibodies. One representative Western blot is shown in supplemental Fig. S3A. We conducted three independent experiments for each of the three stable lines, and in Fig. 4A we show the averages and the standard errors for the three stable lines (the expression of the wild-type is assigned a value of 1). The p value from one-way ANOVA is 0.46, demonstrating that there are no significant differences in the stable expression of wild-type FGFR3 and the two mutants in the three stable lines.
FIGURE 4.

A, expression of full-length FGFR3 in the three stable lines. Averages and standard errors were calculated from three independent experiments. The p value from one-way ANOVA is 0.46, indicating that there is no statistical difference among the expression levels. B, transient expression of ECTMWT-1 in the three stable cells. The averages and standard errors are from four sets of independent experiments. The p value from one-way ANOVA is 0.2, indicating that there is no statistical difference in ECTMWT-1 expression in the three stable lines.
The transient expression of ECTMWT-1 in the cells was probed using anti-N-FGFR3 antibodies. A typical Western blot is shown in supplemental Fig. S3B. After conducting four independent experiments for each of the stable lines, we show the average expression of ECTMWT-1 in the three stable cells, along with the standard errors, in Fig. 4B (the expression of ECTMWT-1 in the wild-type stable line is assigned a value of 1). The p value from one-way ANOVA is 0.2, demonstrating that the expression of ECTMWT-1 is the same in the three stable cell lines.
Because the anti-N-FGFR3 antibody recognizes the epitope corresponding to amino acids 25–124 within the extracellular domain of FGFR3, it can detect both full-length FGFR3 and ECTMWT-1. Upon increasing the exposure time, both full-length FGFR3 and ECTMWT-1 could be observed (supplemental Fig. S2C). The expression level of ECTMWT-1 is an order of magnitude higher than the expression of full-length FGFR3 in the three stable cell lines. Under these conditions, mass action dictates that heterodimers between full-length and truncated receptors are preferred over active FGFR3 homodimers (see “Discussion”).
Inhibitory Effect of ECTMWT-1 Over a Wide Ligand Concentration Range
To gain further insight into the inhibition, we assessed the inhibitory effect of ECTMWT-1 over a wide ligand concentration range. We transfected the stable cell lines, expressing either FGFR3/WT, FGFR3/G380R, or FGFR3/A391E, with plasmids encoding either ECTMWT-1 or an empty pcDNA 3.1+ vector, and we analyzed the phosphorylation of the stably expressed receptors using Western blotting. Typical Western blot films are shown in Figs. 5–7 for FGFR3/WT, for FGFR3/G380R, and for FGFR3/A391E, respectively.
FIGURE 5.

Effect of ECTMWT-1 on FGFR3/WT phosphorylation in stable cell lines, as a function of ligand (FGF1) concentration. HEK 293 cells stably expressing FGFR3/WT were transfected with plasmids encoding ECTMWT-1 or an empty vector. Cells were stimulated with different concentrations of FGF1, ranging from 1 to 2500 ng/ml. The phosphorylation of FGFR3/WT in the stable cells was detected using anti-p-FGFR3 antibodies, and the total expression level of FGFR3 was probed by anti-C-FGFR3 antibodies, recognizing the intracellular domain of FGFR3 and thus not reactive to the truncated ECTMWT-1.
FIGURE 6.

Effect of ECTMWT-1 on FGFR3/G380R phosphorylation in stable cell lines, as a function of ligand (FGF1) concentration.
FIGURE 7.

Effect of ECTMWT-1 on FGFR3/A391E phosphorylation in stable cell lines, as a function of ligand (FGF1) concentration.
Figs. 5–7 show the band staining intensities of anti-C-FGFR3 (SC-123) antibodies (bottom films) and anti-Tyr653/654 antibodies (top films). These films report the expression and the phosphorylation of the full-length receptors, respectively. The truncated FGFR3 construct is not detected by either of these antibodies. In all cases, we observe two bands that are reactive to anti-FGFR3 antibodies, corresponding to the 120-kDa immature and the 130-kDa mature fully glycosylated FGFR3 isoforms. Below, we quantify only the intensity of the highest molecular weight band, corresponding to the mature receptor located predominantly in the plasma membrane and activated in the presence of the ligand (22).
In Figs. 5–7 we observe strong phosphorylation of the mature FGFR3 isoform in the absence of ECTMWT-1, which increases with increasing FGF1 concentration. At concentrations in the range 125–1000 ng/ml FGF1, we observe a plateau in the phosphorylation; the phosphorylation level does not change as more ligand is added. We have previously observed such a plateau at high ligand concentrations in transient transfection experiments (13). This plateau is rationalized by the fact that at such high ligand concentrations all receptors that are accessible to ligand have responded to it, and FGFR3 phosphorylation is at its highest level possible (13).
In the presence of ECTMWT-1, the phosphorylation of the three mature FGFR3 receptors increases with ligand concentration, but it is always lower than in the absence of ECTMWT-1. Thus, the truncated wild-type constructs inhibit the activation of FGFR3/WT, FGFR3/A391E, and FGFR3/G380R. To measure this effect, we first quantified the bands corresponding to the highest molecular weight mature fully glycosylated FGFR3. For successful quantification, the loading of the gels was such that all the band intensities were within the so-called “linear range,” where the staining intensities were proportional to the protein concentrations (23). To plot results for the three receptors on the same scale, the highest phosphorylation level observed for each receptor was assigned a value of 1. The calculated phosphorylation levels in the presence and absence of ECTMWT as a function of ligand concentration (activation curves) are presented in Fig. 8.
FIGURE 8.

Phosphorylation of FGFR3/WT, FGFR3/G380R, and FGFR3/A391E in the presence and absence of ECTMWT-1. The results are obtained via quantification of Western blot films such as the ones shown in Figs. 5–7. The averages and the standard errors are from three independent sets of experiments. The x axis is the concentration of the ligand, FGF1. The y axis is the intensity of the anti-p-FGFR3 staining divided by the intensity of the FGFR3 expression band.
Next, we divided the measured FGFR3 phosphorylation in the presence of ECTMWT-1, PECTMWT-1, by that of each corresponding control (P, in the absence of ECTMWT-1), and then we plotted the ratios PECTMWT-1/P, a measure of the inhibitory effect of ECTMWT-1, versus FGF1 concentrations. The resultant inhibition curves are shown in Fig. 9; a ratio below 1 is indicative of inhibition. The errors shown are standard errors.
FIGURE 9.

Inhibition curves, ratios of measured phosphorylation of FGFR3/WT, FGFR3/G380R, and FGFR3/A391E in the presence and absence of ECTMWT-1.
We then examined the statistical significance of the observed inhibition. First, we evaluated the inhibition over the entire ligand concentration range by assessing if the results are statistically different from a value of 1, the null hypothesis for no inhibition. Toward this goal we calculated the statistical significance of the whole curves using a χ2 test given by Equations 1 and 2. The results are shown in Table 1, and they demonstrate that the inhibition curves for FGFR3/WT, FGFR3/A391E, and FGFR3/G380R are highly significantly different from 1. Thus, ECTMWT-1 inhibits the phosphorylation of wild-type and mutant FGFR3 over a wide ligand concentration range.
TABLE 1.
Analysis of inhibition by ECTMWT-1 over a wide ligand concentration range
χ2 analysis of the inhibition curves in Fig. 9 are compared with a null hypothesis of 1 (no inhibition at any ligand concentration). All curves show extremely significant inhibition, overall.
a Shown are the number of data points in the inhibition curves used to calculate reduced χ̄2.
b Data were calculated using Equation 2.
Next, we sought to identify the ligand concentration range, over which the inhibition of the three receptors is the highest. The contribution of each point to the sum of χ2 (Equation 1) is shown in Fig. 10; the 95% confidence interval for random distribution is about 0–2 as shown by the gray area. There is a statistically significant inhibitory effect of ECTMWT-1 on FGFR3/WT and FGFR3/A391E over the entire ligand concentration range. The inhibition of FGFR3/G380R, however, is statistically significant only above 10 ng/ml FGF1.
FIGURE 10.

Individual contributions to χ2 from the three inhibition curves shown in Fig. 9. The y axis is a measure of the statistical significance of difference between inhibition and no inhibition. If there is no statistical difference, each χ2 value will be around 1–2. All the curves show the most significant differences in the range 10–1000 ng/ml ligand. The effect of ECTMWT-1 on FGFR3/G380R phosphorylation is not significant for concentrations lower than 10 ng/ml.
Next, we investigated if there are statistically significant differences between the three inhibition curves shown in Fig. 9. To answer this question, we compared the three pairs of inhibition curves for (i) FGFR3/WT and FGFR3/A391E, (ii) FGFR3/WT and FGFR3/G380R, and (ii) FGFR3/A391E and FGFR3/G380R in a χ2 test using Equation 3. The results are shown in Table 2, and they demonstrate that the FGFR3/G380R inhibition curve is significantly different from the FGFR3/WT and FGFR3/A391E inhibition curves. However, the FGFR3/WT and FGFR3/A391E inhibition curves are not statistically different from each other.
TABLE 2.
Comparison of inhibition by ECTMWT-1 over a wide ligand concentration range
χ2 analysis of the difference between the inhibition curves in Fig. 9, with a null hypothesis of no difference. Reduced χ2 and corresponding p values are shown for the entire ligand concentration range (all data) and only for data above 125 ng/ml ligand, where there is no difference between curves. There are statistically significant differences between the inhibition of FGFR3/G380R by ECTMWT-1, and the inhibition of the wild-type and the A391E mutant.
| Receptor pair | N | χ̄2 (all data) | p value | χ̄2 (above 125 ng/ml) | p value |
|---|---|---|---|---|---|
| WT − G380R | 8a | 5.5b | <0.001c | 1.0 | >0.05 |
| WT − A391E | 8 | 0.9 | >0.05 | 0.7 | >0.05 |
| G380R − A391E | 8 | 3.1 | <0.01c | 0.2 | >0.05 |
a Shown are the number of data points in the inhibition curves, used to calculate reduced χ̄2.
b Data were calculated using Equation 3.
c Highly significant (p < 0.01).
To assess the ligand concentration range over which the differences are the largest, in Fig. 11 we show the contributions of each point to the sum of χ2 from the three difference curves. The gray area in Fig. 11 shows the 95% confidence interval of the χ2 values expected if there is no statistical difference other than random error. Note that the most significant differences between the FGFR3/G380R inhibition curve and the other two inhibition curves occur at low ligand concentrations, below 125 ng/ml ligand. Above 125 ng/ml, none of the curves are different from each other (also shown in Table 2).
FIGURE 11.

Individual contributions to χ2 from the differences between the inhibition curves. The gray area is where the χ2 values will be found if there is no statistical difference. The most significant differences occur up to 125 ng/ml ligand.
Inhibitory effect of ECTMWT-1 in the absence of ligand
To further investigate if the activation of FGFR3 is inhibited by ECTMWT-1 in the absence of ligand, we performed additional inhibition experiments without ligand. To determine whether there is statistically significant inhibition, we performed a Student's t test using a null hypothesis of 1 (no inhibition). The calculated p values are shown in Table 3. To evaluate the significance, we used the Bonferroni correction for multiple pairwise comparisons, such that the p value cutoff for significance was 0.02 for each comparison, rather than 0.05 normally used for single comparisons. The results in Table 3 show that the effect of ECTMWT-1 on FGFR3/WT and FGFR3/A391E activation was statistically significant. However, ECTMWT-1 did not inhibit the activity of FGFR3/G380R in the absence of ligand.
TABLE 3.
Analysis of inhibition by ECTMWT-1 in the absence of ligand
The data are compared with a null hypothesis of 1 (no inhibition) using Student's t test. The wild-type and the A391E mutant show inhibition that is statistically significant, but only moderately.
| Receptor (no ligand) | N | Mean | S.D. | p value |
|---|---|---|---|---|
| WT | 6a | 0.67 | 0.23b | 0.02c |
| G380R | 6 | 1.24 | 0.34 | 0.14 |
| A391E | 5 | 0.60 | 0.25 | 0.02c |
a Shown are the number of independent data points measured in the absence of ligand.
b Shown is the standard deviation.
c Statistically significant (p < 0.05).
Next, we asked if there are statistically significant differences in the unliganded inhibition of the three receptors by ECTMWT-1. To answer this question, we compared their inhibition in the absence of ligand using ANOVA and the Tukey-Kramer test for pairwise comparisons. The results, shown in Table 4, show that the inhibitions of FGFR3/WT and FGFR3/G380R by ECTMWT-1 are significantly different from each other in the absence of ligand. Similarly, the inhibitions of the two mutants by ECTMWT-1 are significantly different from each other, but the effects of ECTMWT-1 on the activation of FGFR3/A391E and FGFR3/WT are similar.
TABLE 4.
Comparison of unliganded inhibition via ANOVA analysis of the three sets of unliganded inhibition data
In this analysis the data sets are compared with one another with a null hypothesis that the inhibition is equal for all three. The overall ANOVA p value is 0.003, which is highly significant. p values for the pairwise comparisons shown in the table were calculated using Tukey-Kramer analysis for multiple comparisons. The inhibitions of the wild-type and the A391E mutant in the absence of ligand are not significantly different, although G380R inhibition is significantly different from the inhibition of both the wild-type or the A391E mutant.
| Receptor pair (no ligand) | p value |
|---|---|
| Wild type − G380R | p < 0.01a |
| Wild type − A391E | p > 0.05 |
| G380R − A391E | p < 0.01a |
a Highly significant (p < 0.01).
DISCUSSION
Summary of Findings
Our findings can be summarized as follows. 1) The three FGFR3 receptors (WT, G380R, and A391E) are inhibited significantly by ECTMWT-1 over a wide ligand concentration range (Table 1 and Fig. 10). 2) The inhibitory effect of ECTMWT-1 on FGFR3/WT and FGFR3/A391E is significantly larger than its effect on FGFR3/G380R (Table 1 and Fig. 10). 3) The differences between the measured inhibitory effects occur up to 125 ng/ml ligand. Above 125 ng/ml ligand the effects are indistinguishable (Table 2 and Fig. 11). 4) In the absence of ligand, FGFR3/WT and FGFR3/A391E are inhibited by ECTMWT-1, although FGFR3/G380R is not inhibited (Table 3). 5) FGFR3/WT and FGFR3/A391E are inhibited similarly by ECTMWT-1 in the absence of ligand (Table 4).
The conclusion of these studies is that the WT/G380R heterodimers form with lower probability than the WT/WT homodimers or the WT/A391E heterodimers for FGF1 concentrations lower than 125 ng/ml. Under these conditions, there is a large fraction of unliganded dimers, and the TM domains contribute significantly to interactions between FGFR3 receptors (24). At high ligand concentrations, where most dimers are liganded, and where the extracellular domains dominate the interactions between receptors, the mutations have little or no effect on dimerization. Indeed, here we find that the likelihoods for WT/WT homodimers, WT/G380R heterodimers, and WT/A391E heterodimers are indistinguishable at higher ligand concentrations.
Discussion of Experimental Design
Here we assess the formation of heterodimers between a wild-type truncated construct lacking the catalytic domain, ECTMWT-1, and full-length wild-type and mutant FGFR3 receptors, stably expressed in HEK 293 cells. Such full-length/truncated heterodimers are inactive (Fig. 1). Their formation depletes the pool of full-length receptors capable of forming active homodimers and reduces the concentration of active WT/WT, G380R/G380R and A391E/A391E homodimers. Thus, the propensities for FGFR3 wild-type homodimerization and WT/A391E and WT/G380R heterodimerization can be compared.
ECTMWT-1 is expressed in about 70% of the cells because it is introduced via transient transfection (see supplemental Fig. S2). The remainder of the stable cells do not express the truncated constructs but are part of the cell pool assayed in the experiments. The cells that do not express ECTMWT-1 reduce the measured inhibitory effect of the construct. Nonetheless, the effects are measurable and reproducible, and they can be compared using statistical analysis, based on the following facts: 1) the stable expressions of the three full-length receptors are the same (Fig. 4A), and 2) the transient expression of ECTMWT-1 in the three stable lines is also the same (Fig. 4B).
The expression of ECTMWT-1 is an order of magnitude higher than the expression of full-length FGFR3 in the three stable cell lines (supplemental Fig. S3C). According to the law of mass action, under these conditions the heterodimers between full-length and truncated receptors are preferred over active FGFR3 homodimers. Although it is possible that the deletion of the intracellular domain affects dimerization, the relative propensities for the formation of WT homodimers and WT/G380R and WT/A391E heterodimers can be compared because the expression levels of the full-length RTKs and ECTMWT-1 in the three stable lines are the same (Fig. 4, A and B). Furthermore, it should be noted that there is always excess of free ligand, even at the lowest ligand concentration (see supplemental material), such that the observed inhibitory effects are not due to ligand depletion by ECTMWT-1.
Molecular Mechanism behind FGFR3-associated Pathologies
The A391E mutation in FGFR3 has been identified as a somatic mutation in bladder cancer (25) and as a germ line mutation in Crouzon syndrome with acanthosis nigricans (18), an autosomal dominant disorder characterized by premature ossification of the skull (craniosynostosis) and skin hyperpigmentation and hyperkeratosis. The A391E mutation stabilizes the isolated FGFR3 TM domain homodimer in lipid bilayers by −1.3 kcal/mol, most probably via hydrogen bonding (26). The mutation increases the activation and the cross-linking propensity of a chimeric Neu receptor containing the FGFR3 TM domain in CHO cells by about −1.0 kcal/mol (23). The mutation also increases the stability of the heterodimer of the wild-type/mutant FGFR3 TM domains in lipid bilayers by −0.6 kcal/mol (16).
Furthermore, molecular modeling has suggested that the TM domain dimer structures of the wild-type FGFR3 and the pathogenic A391E mutant are similar, and therefore mutant dimer stabilization is a direct consequence of the interaction (most probably hydrogen bonding) between Glu391 and the adjacent helix in the dimer (26). In other words, the dimerization motif does not change because of the mutation, but instead a new hydrogen bond is added to further stabilize the dimer.
The G380R mutation associated with achondroplasia, however, does not increase FGFR3 dimerization (13, 27). Instead, FGFR3 activity in achondroplasia is increased due to increased probability for phosphorylation in the absence of ligand (13). Computer modeling of the FGFR3 TM domain dimer carrying the G380R mutation suggests that the mutation induces a rotation in the TM dimer interface (13). Such rotations of RTK TM dimer interfaces have been linked to changes in auto-phosphorylation propensities (28).
Because the structures of the wild-type and G380R homodimers are expected to be different, no prediction can be made about the formation/stability of WT/G380R heterodimers. Here, we show experimentally that WT/G380R heterodimers form with lower probability than WT/WT homodimers and WT/A391E heterodimers for low FGF1 concentrations. The likelihoods for WT/WT homodimers, WT/G380R heterodimers, and WT/G380R heterodimers are similar to each other at higher ligand concentrations.
The G380R and A391E mutations are localized in the TM domain of the same receptor. Yet the two mutations are linked to different phenotypes. The G380R mutation affects the development of the long bones, whereas the A391E mutation leads to premature ossification of the skull in the coronal area (20, 29). Long bones and cranial bones develop via different pathways. The long bones develop via endochondral ossification, i.e. as hypertrophic chondrocytes die, the space is invaded by bone. The cranial bones develop as a result of differentiation of mesenchymal cells into bone. Currently, it is not clear why these two mutations in the same receptor give rise to different phenotypes.
Previous work has already revealed a difference in the effects of these two mutations; A391E increases FGFR3 activation by increasing dimerization, whereas G380R likely affects the structure of the dimer in the absence of ligand (8, 9). Here, we demonstrate a second key difference between the two mutants. Although WT/A391E heterodimers readily form in cellular membranes, WT/G380R heterodimers form with lower probability than WT/WT homodimers and WT/A391E heterodimers for low FGF1 concentrations. The difference in interactions that we measure here may help explain the different phenotypic effects due to these two mutations.
This work was supported, in whole or in part, by National Institutes of Health Grants GM068619, GM095930 (to K. H.), and GM060000 (to W. C. W.).

The on-line version of this article (available at http://www.jbc.org) contains supplemental Figs. S1–S4 and additional references.
- TM
- transmembrane
- ANOVA
- analysis of variance
- RTK
- receptor tyrosine kinase.
REFERENCES
- 1. Shiang R., Thompson L. M., Zhu Y. Z., Church D. M., Fielder T. J., Bocian M., Winokur S. T., Wasmuth J. J. (1994) Cell 78, 335–342 [DOI] [PubMed] [Google Scholar]
- 2. Ponseti I. V. (1970) J. Bone Joint Surg. Am. 52, 701–716 [PubMed] [Google Scholar]
- 3. Horton W. A., Hall J. G., Hecht J. T. (2007) Lancet 370, 162–172 [DOI] [PubMed] [Google Scholar]
- 4. Colvin J. S., Bohne B. A., Harding G. W., McEwen D. G., Ornitz D. M. (1996) Nat. Genet. 12, 390–397 [DOI] [PubMed] [Google Scholar]
- 5. Wilkie A. O., Morriss-Kay G. M., Jones E. Y., Heath J. K. (1995) Curr. Biol. 5, 500–507 [DOI] [PubMed] [Google Scholar]
- 6. L'Hôte C. G., Knowles M. A. (2005) Exp. Cell Res. 304, 417–431 [DOI] [PubMed] [Google Scholar]
- 7. Eswarakumar V. P., Lax I., Schlessinger J. (2005) Cytokine Growth Factor Rev. 16, 139–149 [DOI] [PubMed] [Google Scholar]
- 8. Li E., Hristova K. (2010) Cell Adh. Migr. 4, 249–254 [DOI] [PMC free article] [PubMed] [Google Scholar]
- 9. Li E., Hristova K. (2006) Biochemistry 45, 6241–6251 [DOI] [PMC free article] [PubMed] [Google Scholar]
- 10. Plotnikov A. N., Schlessinger J., Hubbard S. R., Mohammadi M. (1999) Cell 98, 641–650 [DOI] [PubMed] [Google Scholar]
- 11. Schlessinger J. (2000) Cell 103, 211–225 [DOI] [PubMed] [Google Scholar]
- 12. Li Y., Mangasarian K., Mansukhani A., Basilico C. (1997) Oncogene 14, 1397–1406 [DOI] [PubMed] [Google Scholar]
- 13. He L., Horton W., Hristova K. (2010) J. Biol. Chem. 285, 30103–30114 [DOI] [PMC free article] [PubMed] [Google Scholar]
- 14. Naski M. C., Wang Q., Xu J., Ornitz D. M. (1996) Nat. Genet. 13, 233–237 [DOI] [PubMed] [Google Scholar]
- 15. Harada D., Yamanaka Y., Ueda K., Tanaka H., Seino Y. (2009) J. Bone Miner. Metab. 27, 9–15 [DOI] [PubMed] [Google Scholar]
- 16. Merzlyakov M., You M., Li E., Hristova K. (2006) J. Mol. Biol. 358, 1–7 [DOI] [PMC free article] [PubMed] [Google Scholar]
- 17. Han X., Mihailescu M., Hristova K. (2006) Biophys. J. 91, 3736–3747 [DOI] [PMC free article] [PubMed] [Google Scholar]
- 18. Meyers G. A., Orlow S. J., Munro I. R., Przylepa K. A., Jabs E. W. (1995) Nat. Genet. 11, 462–464 [DOI] [PubMed] [Google Scholar]
- 19. Vajo Z., Francomano C. A., Wilkin D. J. (2000) Endocr. Rev. 21, 23–39 [DOI] [PubMed] [Google Scholar]
- 20. McIntosh I., Bellus G. A., Jab E. W. (2000) Cell Struct. Funct. 25, 85–96 [DOI] [PubMed] [Google Scholar]
- 21. Bevington P. R. (1969) Data Reduction and Error Analysis for the Physical Sciences, pp. 51–65, McGraw-Hill Book Co., New York [Google Scholar]
- 22. Raffioni S., Zhu Y. Z., Bradshaw R. A., Thompson L. M. (1998) J. Biol. Chem. 273, 35250–35259 [DOI] [PubMed] [Google Scholar]
- 23. He L., Hristova K. (2008) J. Mol. Biol. 384, 1130–1142 [DOI] [PubMed] [Google Scholar]
- 24. Chen L., Placone J., Novicky L., Hristova K. (2010) Sci. Signal. 3, ra86. [DOI] [PMC free article] [PubMed] [Google Scholar]
- 25. van Rhijn B. W., van Tilborg A. A., Lurkin I., Bonaventure J., de Vries A., Thiery J. P., van der Kwast T. H., Zwarthoff E. C., Radvanyi F. (2002) Eur. J. Hum. Genet. 10, 819–824 [DOI] [PubMed] [Google Scholar]
- 26. Li E., You M., Hristova K. (2006) J. Mol. Biol. 356, 600–612 [DOI] [PMC free article] [PubMed] [Google Scholar]
- 27. You M., Li E., Hristova K. (2006) Biochemistry 45, 5551–5556 [DOI] [PubMed] [Google Scholar]
- 28. Bell C. A., Tynan J. A., Hart K. C., Meyer A. N., Robertson S. C., Donoghue D. J. (2000) Mol. Biol. Cell 11, 3589–3599 [DOI] [PMC free article] [PubMed] [Google Scholar]
- 29. Passos-Bueno M. R., Wilcox W. R., Jabs E. W., Sertié A. L., Alonso L. G., Kitoh H. (1999) Hum. Mutat. 14, 115–125 [DOI] [PubMed] [Google Scholar]