

Abstract
The Forkhead box transcription factor FoxO1 regulates metabolic gene expression in mammals. FoxO1 activity is tightly controlled by phosphatidylinositol 3-kinase (PI3K) signaling, resulting in its phosphorylation and nuclear exclusion. We sought here to determine the mechanisms involved in glucose and insulin-stimulated nuclear shuttling of FoxO1 in pancreatic β cells and its consequences for preproinsulin (Ins1, Ins2) gene expression. Nuclear-localized endogenous FoxO1 translocated to the cytosol in response to elevated glucose (3 versus 16.7 mm) in human islet β cells. Real-time confocal imaging of nucleo-cytosolic shuttling of a FoxO1-EGFP chimera in primary mouse and clonal MIN6 β cells revealed a time-dependent glucose-responsive nuclear export, also mimicked by exogenous insulin, and blocked by suppressing insulin secretion. Constitutively active PI3K or protein kinase B/Akt exerted similar effects, while inhibitors of PI3K, but not of glycogen synthase kinase-3 or p70 S6 kinase, blocked nuclear export. FoxO1 overexpression reversed the activation by glucose of pancreatic duodenum homeobox-1 (Pdx1) transcription. Silencing of FoxO1 significantly elevated the expression of mouse Ins2, but not Ins1, mRNA at 3 mm glucose. Putative FoxO1 binding sites were identified in the distal promoter of rodent Ins2 genes and direct binding of FoxO1 to the Ins2 promoter was demonstrated by chromatin immunoprecipitation. A 915-bp glucose-responsive Ins2 promoter was inhibited by constitutively active FoxO1, an effect unaltered by simultaneous overexpression of PDX1. We conclude that nuclear import of FoxO1 contributes to the suppression of Pdx1 and Ins2 gene expression at low glucose, the latter via a previously unsuspected and direct physical interaction with the Ins2 promoter.
Keywords: Akt PKB, Diabetes, Glucose, Insulin, Insulin Secretion, Pancreatic Islet
Introduction
The mechanisms through which changes in glucose concentration regulate the expression of the preproinsulin and other genes in pancreatic islet β cells are only partly understood (1, 2). Enhanced secretion of insulin, and the rebinding of the released hormone to pancreatic β-cell insulin receptors, may play an important role in mediating some of the effects of nutrients in this cell type (3–8). Indeed, Bouche et al. (9) recently demonstrated that insulin improves glucose-stimulated insulin secretion in healthy humans. However, the identity of the downstream transcription factors, and/or repressors, which mediate the effects of insulin and glucose, is still incompletely defined.
Forkhead transcription factors, characterized by the presence of a 100-amino acid winged helix domain, are implicated in the control of a variety of cellular processes (10). FoxO1 (previously termed FKHR), is a member of the Forkhead box (FOX)3 subclass whose deletion results in early embryonic lethality in mice (11). Activation by insulin of type 1 phosphoinositide 3-phosphokinases (PI3Ks) and protein kinase B (PKB/Akt) (12) results in the phosphorylation of FoxO1 at Ser256 (supplemental Fig. S1, A and B) and causes the translocation of FoxO1 from the nucleus to the cytoplasm (13, 14). This is followed by enhanced degradation of FoxO1 (15) and thereby de-repression (16) of target genes. Conversely, in pancreatic α cells, nuclear accumulation of FoxO1 when glucose and insulin concentrations are low leads to the activation of the preproglucagon gene (17).
Suggesting an important role as a repressor of pancreatic islet β-cell gene expression, inactivation of a single allele of the FoxO1 gene in mice rescued the deleterious effect of deleting insulin receptor substrate-2 (11, 18). Conversely, transgenic overexpression of FoxO1 in the liver and in β cells of mice led to abnormal glucose tolerance in vivo and defective glucose-stimulated insulin secretion (19). Finally, overexpression of FoxO1 in clonal βTC-3 cells reversed the activation by Foxa2 (HNF3β) of a fragment of the proximal promoter of pancreatic duodenal homeobox 1 (Pdx1) (20), a key regulator of β cell differentiation (2).
Another study has demonstrated that FoxO1 translocated from the nucleus to the cytosol of MIN6 β cells in response to elevated glucose concentrations in a mechanism involving enhanced insulin secretion and signaling through PI3K (21). However, neither the kinetics, nor the molecular basis of the nuclear-cytosolic shuttling of FoxO1 was explored in detail in the latter study. Moreover, although a possible role for FoxO1 in the regulation of the Chop promoter was identified (21), the role in the regulation of Pdx1 and preproinsulin transcription was not explored (21).
By imaging the dynamics of FoxO1-EGFP cytoplasmic-nuclear shuttling, and the activity of potential target genes, in single primary human and mouse β cells and in clonal MIN6 cells, we show here that: (a) FoxO1 translocation occurs rapidly (within 10–20 min) after exposure to high glucose or insulin; (b) involves the activation of PI 3-kinase and PKB/Akt, but not ribosomal protein 70 kDa S6 kinase (p70 S6K) or glycogen synthase kinase-3, (c) blocks Pdx1 and Ins2 transcription by separate and at least partly independent mechanisms, including the direct binding of FoxO1 to the preproinsulin promoter.
EXPERIMENTAL PROCEDURES
Reagents
Dulbecco's modified Eagle's medium (DMEM) was obtained from Sigma. Lipofectamine 2000TM and Lipofectamine RNAi MaxTM, Trizol were from Invitrogen (Carlsbad, CA), dual-luciferase assay kit was from Promega (Southampton, UK) and LY294002, SB216763, and SB415286 were from Calbiochem (Nottingham, UK).
Plasmids, pFoxO1-EGFP
Human FKHR was cloned by PCR as described elsewhere (17). The full-length FKHR/FoxO1 clone was then amplified by PCR to add Xho1 and Sal1 sites and cloned into pCINeo downstream of EGFP. The FoxO1-EGFP fragment was further subcloned into pShuttle and recombined in adenoviral vector pAdeasy as described (22). cDNA encoding a constitutively active (CA) FoxO1 was generated by substitution of Ser256 to Ala by site directed mutagenesis (Agilent Technologies Inc, Cheshire, UK) in the FoxO1-EGFP-pShuttle vector, which was then used to generate the adenoviral vectors.
Plasmids based on vector pCMV5 (Invitrogen) and bearing constitutively active (-DD; containing substitutions of Thr308 and Ser473 for Asp) and membrane-targeted forms of PKB, (myrPKB) were kindly provided by Professor B. Hemmings (Friedrich Miescher Institute, Basel). Plasmid pCMV-RL carrying Renilla reniformis cDNA under cytomegalovirus promoter control and pGL3 Basic (23) were from Promega. Generation of pCMV.Pdx1, the full-length human Pdx1 cDNA bearing a c-myc epitope tag (24) and plasmids bearing the active catalytic subunit of PI3K, modified with the addition of a CAAX box, or a dominant-negative form of the regulatory subunit lacking the p100-binding domain (Δp85) (25) are described elsewhere (24).
pIns2.LucFF
Total DNA was extracted from MIN6 cells and the Ins2 promoter was PCR amplified using primers R1 fwd and R2 rev as described later in this section (“Chromatin Immunoprecipitation”). The fragment was cloned upstream of a cDNA encoding humanized firefly luciferase in plasmid PGL3 (Promega). The resulting pIns2.LucFF plasmid consisted of a 915 bp fragment of the mouse Ins2 promoter spanning nucleotides −907 to +8 bp with respect to the transcriptional start site. The deletion mutant (Ins2ΔRegion1) was generated by removing the first 290 bp from pIns2.LucFF using an internal Sac1 site. The Herpes simplex virus thymidine kinase (TK) promoter was excised from pRL-TK (Promega) and inserted into pGL3 Basic to create pGL3-TK in which expression of firefly luciferase is driven by the TK promoter. The 290 bp region 1 of mouse Ins2 promoter was inserted upstream of the TK promoter between KpnI and SacI sites.
MIN6 Cell Culture
Clonal MIN6 β-cells (26) were used between passages 20 and 30 and grown in DMEM supplemented with 15% (v/v) heat-inactivated fetal calf serum (Invitrogen), 25 mm glucose, 2 mm glutamine, 50 μm β-mercaptoethanol, 100 IU/ml penicillin, and 100 μg/ml streptomycin. Cells were cultured in a humidified atmosphere at 37 °C with 5% CO2, as previously described (23).
Human and Mouse Islet Isolation
Islets were isolated from cadaveric donors according to standard procedures (27) following local ethical procedures (Charing Cross Ethics Committee REC 07/H0711/114). Mouse islets were prepared as described elsewhere (28). The islets were allowed to recover for a week in culture medium (RPMI supplemented with 10% FCS, 2 mm glutamine, and 11 mm glucose).
Transfection and Transduction
MIN6 cells seeded onto poly-l-lysine-coated coverslips were transfected with pFoxO1-EGFP (1 μg/ml) alone or with other plasmids (each at 1 μg/ml) using Lipofectamine 2000TM, according to the manufacturer's instructions. Islets were partially dissociated by incubation in Hank's-based cell dissociation buffer (Invitrogen) for 10 min and by vigorous pipetting. Islet clusters were seeded on poly-l-lysine coated coverslips for a day and transduced with FoxO1-EGFP adenoviral particles of a multiplicity of infection (MOI) of 20–25 for 6 h and subsequently allowed to express the protein for 24–48 h in fresh culture media.
Dual Luciferase Assay
MIN6 cells seeded on 12-well plates at 70% confluency were transfected with a mixture of 450 ng pIns2FF and 1 ng of pCMVRen or 500 ng of TKFF and 100 ng of TKRen using Lipofectamine 2000. After 4 h, media was replaced and adenoviral particles were added at 20–30 MOI where indicated. Cells were incubated for a further 16 h and then media changed to allow culture for 16–20 h at 3, 25, or 30 mm glucose. Luciferase assay was carried out using a Dual-Luciferase kit (Promega) and a Lumat LB 9507 Luminometer following manufacturer's instructions.
Confocal Imaging and Image Analysis
After culturing in DMEM-based medium at the required concentrations of glucose and insulin, MIN6 cells were transferred into Krebs-Ringer bicarbonate (KRB) buffer (125 mm NaCl, 3.5 mm KCl, 1.5 mm CaCl2, 0.5 mm MgSO4, 0.5 mm KH2PO4, 25 mm NaHCO3, and 10 mm Na+-Hepes, equilibrated with 95:5 O2/CO2). Confocal microscopy was performed with a Leica TCS DM IRBE inverted confocal microscope (488 nm excitation; ×63 oil immersion objective) controlled with TCS-NT4 software (Leica). The extent of FoxO1-EGFP translocation to the nucleus was quantified in regions of interest (ROI) as follows. Fluorescence intensity within selected cytosolic or nuclear regions was measured using on-board TCS-NT software, and the mean ratio of cytosol:nuclear intensity obtained.
siRNA Transfection and Real-time qRT-PCR Analysis
MIN6 cells seeded on 6-well plates were transfected with 20 nm of either scrambled (prepared using a template, 5′-AAATGTCCCCCTCAGCGTGTCCTGTCTG-3′ and a Silencer SiRNA construction kit, Ambion, Huntingdon, UK) or SiGENOME SMARTpoolTM siRNA (Dharmacon, Thermo Fisher Scientific, Lafayette, CO) using Lipofectamine RNAiMaxTM for 48 h in culture media before subsequent culture in media containing 3 or 30 mm glucose. Total RNA was prepared with Trizol and treated with DNase 1 (Ambion). RNA (2 μg) was reverse-transcribed using High Capacity cDNA Reverse Transcription kit. Real-time PCR was carried out with cDNA (equivalent of 20 ng input RNA) using Power SYBR Green master mix (ABI Biosystems) in a 7500 Fast Real-Time PCR system (ABI Biosystems) and analyzed by comparative Ct method. All real-time primers (supplemental Table S1) were generated using ABI Primer Express 3.0 except for FoxO1 the SF QuantiTectTM (Qiagen) primers were used and were predicted to produce a single unique product under the high stringency conditions deployed.
Western Blotting
Protein analysis was carried out as described elsewhere (29). The antibodies used were rabbit monoclonal anti-FoxO1 (1:1000, C29H4 Cell Signaling Technology, Danvers, MA), anti-Phospho-FoxO1 Ser-256 (1:1000, Cell Signaling Technology), monoclonal anti-α tubulin (1:10,000, Sigma clone B-5-1-2) and HRP-linked secondary antibodies (1:10000, GE Healthcare).
Chromatin Immunoprecipitation
ChIP was performed as described elsewhere (30). Briefly, MIN6 cells were cultured in medium containing 3 mm glucose for 16 h before stimulation with 3 or 30 mm glucose for 20 h, and then cross-linking with 1% formaldehyde and sonication to obtain fragments of chromatin of ∼0.5 kb. DNA-protein complexes were immunoprecipitated with a rabbit monoclonal antibody against FoxO1 (C29H4, Cell Signaling Technology, Danvers, MA) or ChIP-grade immunoglobulin G (Sigma), and protein-G-agarose/salmon sperm DNA (Millipore), followed by digestion with proteinase K (Roche Applied Science). The resulting DNA was extracted using phenol-chloroform and precipitated with ethanol. Regions of interest were PCR amplified using AccuprimeTM TaqDNA polymerase (Invitrogen) and primers (R1 fwd: tctcccaggtacccagagtg, R1 rev: agccagctgtctccatctgt, R2 fwd: aactggttcatcaggccatc, R2 rev: ttagggctggtggttactgg, R3 fwd: ccagtaaccaccagccctaa, R3 rev: caaaggtgctgcttgacaaa) specific to regions (∼200 bp) encompassing the putative FoxO1 binding sites.
Immunostaining and Confocal Imaging
MIN6 cells grown on glass coverslips and transduced with adenoviral vectors as indicated. Immunostaining was carried out using the following antibodies; monoclonal anti-Myc antibody (1:200; Roche), polyclonal anti-Swine insulin (1:200; DakoCytomation, Ely, UK), anti-FoxO1 (1:200) and Alexa 488- or 564-coupled secondary antibodies (1:500; Molecular Probes) and confocal imaging was carried out as described elsewhere (29).
Statistical Analysis
Data analyzed using one-tailed Student's t test for paired data with Microsoft ExcelTM, or two-tailed Student's t test and two-way ANOVA with Bonferroni correction using GraphPad PrismTM where appropriate.
RESULTS
Elevated Glucose Concentrations or Insulin Cause Translocation of FoxO1-EGFP from the Nucleus to the Cytosol
Beta cell clusters derived from partially-dissociated human islets showed, upon incubation at 3 or 16.7 mm glucose for 16 h and subsequent staining with anti-FoxO1 or insulin antibodies, differential staining of endogenous FoxO1 in the nucleus and cytosol (Fig. 1, A and B), indicating that FoxO1 translocates from the nucleus in response to the sugar. To analyze the kinetics and molecular mechanisms involved in FoxO1 nuclear exclusion more closely, we monitored the subcellular localization of FoxO1-EGFP in primary mouse β cells incubated at 16.7 mm glucose for different time periods up to 1 h (Fig. 1, C and D). Cells were again fixed with formaldehyde and immunostained with an anti-insulin antibody. While FoxO1 was predominantly localized in the nucleus after overnight incubation in 3 mm glucose, exposure to the elevated sugar concentration triggered significant cytosolic translocation after 45–60 min of stimulation. Real-time imaging of FoxO1-EGFP dynamics in single living β cells derived from mouse islets (Fig. 2, A–D) or MIN6 β cell lines (Fig. 2, E–H) showed that whereas the initial, predominantly nuclear localization of FoxO1 was maintained during incubation in 3 mm glucose, addition of 16.7 (Fig. 2, A and B) or 30 mm glucose (Fig. 2, E and F), or 20 (Fig. 2C) or 200 nm (Fig. 2, C, G, H) insulin caused a progressive increase in cytosolic fluorescence at the expense of nuclear fluorescence. These changes were clearly detectable after 10–20 min of exposure to either stimulus. However, quantitation of fluorescence changes during the time course revealed that while insulin caused a near 4-fold increase in cytosolic to nuclear fluorescence after 60 min, the response to 30 mm glucose was more modest with a maximum increase of twice the initial value. While we were unable in this case to confirm that the examined cell was a β cell, from our staining for insulin in these cultures (above), and a vast quantity of existing literature in the rodent (e.g. Ref. 31), β cells are likely to comprise 70–75% of the cells in these cultures. Here again, in individual cells, we observed closely similar data to that obtained from the “cross-sectional” studies obtained from collections of β cells (Fig. 1C) in terms of the initial and final cytosol:nucleus staining and the time course of the changes in this parameter.
FIGURE 1.

Imaging the effects of glucose and insulin on the subcellular localization of endogenous FoxO1 or overexpressed FoxO1-EGFP in primary human and mouse β-cells. A, partially dissociated human islets seeded on coverslips for 1 day in 11 mm glucose were subsequently incubated for 16 h in 3 or 16.7 mm glucose, were formaldehyde-fixed, permeabilized, and immunostained with anti-FoxO1 and anti-insulin antibodies, and subsequently with Alexa Fluor-488- and -564-coupled secondary antibodies, while DAPI was used for nuclear staining. Cell clusters containing insulin-positive cells were imaged by confocal microscopy taking Z cross-sections at 0.2 μm spacing along the entire depth of the clusters. The three-dimensional “opacity” (VolocityTM software) view is presented. Scale bar, 10 μm. B, ratio of fluorescence quantified within regions of interest selected in the cytosol and nucleus in the central cross-sections of single islet β cells and calculated from 25–30 individual cells. The bar shows mean ± S.E. analyzed by two-tailed t test. C, dissociated mouse islet cells plated on coverslips were transduced with FoxO1-EGFP-expressing adenovirus (20–25 MOI) and incubated for 36 h to allow expression. Following overnight incubation in 3 mm glucose, cells were exposed to either 3 or 16.7 mm glucose for the indicated time before fixation and immunostaining with anti-insulin antibody as described in A. Images show typical distribution of FoxO1-EGFP from 20–30 cells studied per condition from three independent experiments. Scale bar, 10 μm. D, ratio of fluorescence quantified from C, as described in B. Bar shows mean ± S.E. analyzed by two-tailed t test all compared to 0 time point.
FIGURE 2.

Real-time dynamic imaging of the effects of glucose and insulin on the subcellular localization of FoxO1-EGFP. Single primary β cells derived from mouse islets (A and C) or clonal MIN6 cells (E and G) were infected with FoxO1-EGFP-expressing adenovirus and cultured for 48 h in complete medium and then overnight in 3 mm glucose. Cells were then transferred to the heated stage of a Leica SP2 confocal microscope in KRB containing 3 mm glucose. Images were captured every 2 min up to 60 min, either 15 min (A) or immediately before and then after the addition of 16.7 mm (A) or 30 mm (E) glucose, 20 nm (C) or 200 nm insulin in (C, G) as indicated. Traces in B are typical of the single cells seen in A and are presented to distinguish the glucose-dependent effects above basal fluctuations. All other traces (D, F, H) show the mean ± S.E. from ≥3 independent experiments. Error bars are included only for the 15, 30, and 60 min time points for clarity. *, p < 0.05. Scale bar, 10 μm (5 μm for A).
Next, we determined whether the stimulatory effect of high glucose was due to the secreted insulin acting through an autocrine loop (8). MIN6 cells were maintained for 6 h in serum-containing medium at either low (0.5 mm) or high (25 mm) glucose in the additional presence of 20 nm insulin or 200 μm diazoxide (Fig. 3, A and B). By opening the ATP-sensitive K+ channels, diazoxide causes hyperpolarization of the plasma membrane and thereby an essentially complete inhibition of glucose-stimulated insulin secretion of the MIN6 cells (32). Added insulin efficiently mimicked the effects of 25 mm glucose. The effects of glucose, but not those of insulin, were completely suppressed by diazoxide (Fig. 3, A and B).
FIGURE 3.
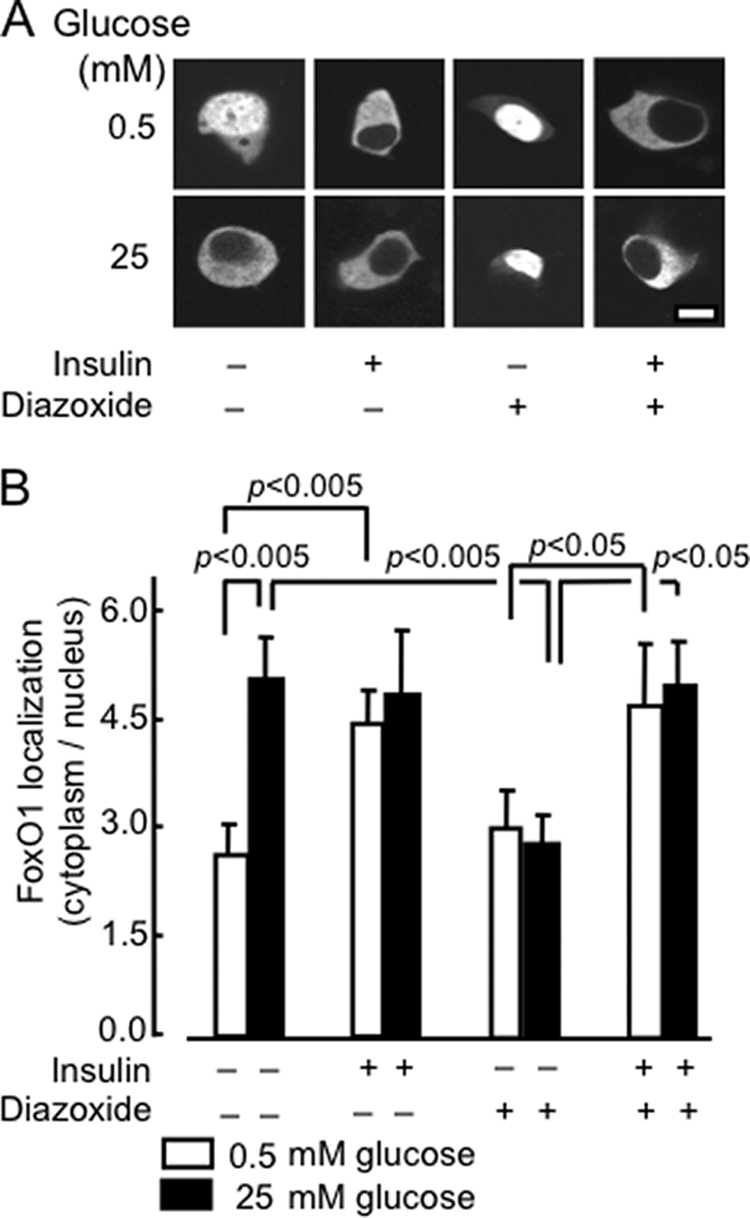
Role of secreted insulin on the effects of glucose on FoxO1-EGFP translocation. A, after 24 h of transient transfection with pFoxO1-EGFP, MIN6 cells were incubated at varying concentrations of insulin (0, 20 nm), glucose (0.5, 25 mm), or DAO (diazoxide, 20 and 200 μm) for 1 h in medium prior to imaging. B, distribution of FoxO1 between the cytosol and nucleus. Data show ratio (mean ± S.E., n = 20–50 cells from three separate experiments).
The Effects of Glucose and Insulin on FoxO1-EGFP Translocation Are Due to Activation of PI 3-Kinase Signaling
We sought next to study if the effects of glucose were mediated by released insulin, as opposed to the action of co-secreted factors (ATP, Zn2+ etc) in which case the action of glucose should be inhibited by the blockade of signaling downstream of the insulin receptor. To test this possibility, we inhibited PI3K activity with either the pharmacological agent LY294002 or by expression of a dominant-negative form of the PI3K adaptor subunit Δp85 (25). The latter was expected to prevent the recruitment of the catalytic (p110) subunit of PI3K to the phosphorylated adaptor molecules (IRS1, IRS2, Shc, etc.) (24). Incubation with LY294002 or the expression of Δp85 led to a complete suppression of the effects of glucose and insulin on the subcellular localization of FoxO1 (Fig. 4, A and B). Conversely, expression of a constitutively active, membrane-associated form of p110 (p100.CAAX) led to the translocation of FoxO1 from the nucleus at low (0.5 mm) as well as elevated (25 mm) glucose concentrations.
FIGURE 4.

Effects of activation or inhibition of PI 3-Kinase on FoxO1-EGFP localization. A, MIN6 cells, after 24 h of transient transfection with pFoxO1-EGFP (1.0 μg), and either empty vector (pcDNA3; Con) or plasmids encoding p100.CAAX or Δp85 (1.0 μg) were incubated with further additions (as shown, LY294002, 50 μm) for 1 h in KRB medium. B, quantitation of the ratio (mean ± S.E., n = 20–30 cells from ≥ 3 separate experiments) as shown in A. C, effects of glucose and insulin on FoxO1-EGFP localization are mimicked by an active form of protein kinase B but do not require p70 S6 kinase or glycogen synthase kinase-3 (GSK3). Cells were transfected with pFoxO1-EGFP plus either empty vector (pcDNA3; Con), PKB-DD or PKB-myr. After 16 h of incubation in DMEM containing 3 mm glucose, the medium was replaced with medium containing the specified concentrations of glucose, insulin, and GSK3 inhibitors, SB216763 and SB415286 (SB21, SB41, 3 μm and 30 μm, respectively), rapamycin, 30 nm. D, quantification of ratio (mean ± S.E., n = 20–40 cells, obtained from ≥3 independent experiments for each condition). Scale bar, 5 μm.
To explore the signaling pathways acting downstream of PI3K, we determined whether FoxO1 translocation to the cytosol could be induced by a constitutively active form of PKB/Akt, PKB-DD (Thr308 and Ser473 substituted with Asp), or by a membrane-targeted constitutively active version of PKB (PKB-myr). Cotransfection with either construct resulted in a significant increase in the ratio of cytosolic to nuclear FoxO1 at low glucose concentrations (Fig. 4, C and D), consistent with a role for active PKB. Ribosomal S6 kinase (p70 S6 K) (33) and glycogen synthase kinase (34) have both recently been shown to be activated by glucose and insulin, as well as other growth factors in clonal rat β cells (INS-1). However, we observed here that pre-incubation of MIN6 cells with the p70 S6 kinase inhibitor rapamycin had no effect on the translocation of FoxO1 provoked by either 25 mm glucose or 20 nm insulin. Similarly, treatment with either of two structurally distinct GSK3 inhibitors, SB216763 or SB415286 (35) had no effect on the subcellular distribution of FoxO1 at either low or high glucose concentrations (Fig. 4, C and D) arguing that neither of the downstream kinases is involved in stimulating the nuclear export of FoxO1.
Modulation of FoxO1 Expression Affects Mouse Ins2 mRNA Levels; Evidence for a Direct Interaction of FoxO1 with the Promoter of the Corresponding Gene
Given that FoxO1 is a key transcription factor in metabolic gene regulation in response to glucose and insulin, we next examined the effects of FoxO1 silencing on some of the most important genes involved in β-cell glucose metabolism. A reduction (>70%) in FoxO1 expression (Fig. 5, A and B) in MIN6 cells, achieved by transfection of FoxO1 siRNA for 48 h led, upon subsequent culture in 3 or 30 mm glucose for another 12–16 h, to a significant rise in basal Ins2 mRNA levels at 3 mm glucose (Fig. 5B), but not in Ins1, Pdx1 (Fig. 5B) or MafA and NeuroD (supplemental Fig. S2) mRNA levels. Despite displaying an elevated basal Ins2 mRNA level, FoxO1-silenced cells appeared to retain the glucose inducibility of Ins2 expression. Thus, basal and glucose-induced expression levels were significantly different, though the fold rise in response to high glucose was less when compared with control cells (scrambled siRNA). Furthermore, the level of Ins2 mRNA after treatment with 30 mm glucose did not differ significantly in cells silenced or not for FoxO1. A tendency toward an increased basal level of expression, though not reaching significance, was also observed for Pdx1, but not for Ins1, MafA or NeuroD mRNAs (supplemental Fig. S2). On the other hand, overexpression of a dephosphomimetic (Ser256>Ala), constitutively-active and nuclearly localized form of FoxO1 (FoxO1-CA) led to a remarkable inhibition of both Ins2 and Pdx1, but not Ins1, mRNA expression (Fig. 5C). Because of its constitutive presence in the nucleus, FoxO1-CA thus overcomes the effect of high glucose and thereby helps to identify possible repressive effects of this factor on genes while over-riding its intrinsic regulation. It should be emphasized that the real-time PCR primers designed against each of the genes studied, including Ins1 and Ins2, recognized exclusive regions with in the transcribed template, with minimal overlap between genes. Thus, each pair of primers amplified a single and specific product under the high stringency PCR conditions deployed (see “Experimental Procedures” for further details). The differential regulation of the two rodent insulin genes by FoxO1 would appear therefore to be a bona fide phenomenon whose mechanisms were studied further below.
FIGURE 5.

Changes in FoxO1 level modify mouse Ins2 gene expression. A, Western blot showing protein extracted from MIN6 cells transfected with the indicated siRNA. MIN6 cells were transfected with Smart Pool or scrambled siRNA (20 nm) for 48 h before protein analysis. B, real-time qRT-PCR analysis of the indicated genes after siRNA-mediated silencing of FoxO1 studied at 3 and 30 mm glucose concentrations. MIN6 cells were transfected with indicated siRNA as mentioned above. Subsequently, cells were cultured in 3 mm glucose for overnight prior to incubation in 3 or 30 mm glucose for 6–8 h and RNA was extracted for real-time RT-PCR analysis. C, MIN6 cells overexpressing a constitutively active (nuclear) FoxO1-CA-EGFP were analyzed by real-time RT-PCR of the indicated genes, as in B. Cells were transduced with FoxO1-CA virus (20–25 MOI) for 12 h and subsequently cultured overnight (16 h) in 3 mm glucose prior to incubation in 3 or 30 mm glucose for 6–8 h and RNA was extracted for analysis (see “Experimental Procedures”). Bars (B, C) show mean ± S.E., n≥ 9 from 4–5 independent experiments of the ddCT values (compared with control samples in 30 mm glucose for each gene).
Importantly, the above findings are consistent with the negative regulatory role of FoxO1 toward insulin/IGF-induced β-cell growth and proliferation (11) and inhibition of Pdx1 action at the insulin promoter by competition with the stimulatory factor FoxA2/HNF3β for the same binding site (20, 36). The above findings also raise the possibility of a direct inhibition of mouse Ins2, but not Ins1 expression by FoxO1. Indeed, a search for consensus FoxO1 binding sites, namely the insulin response element (IRE) and the Daf-16 binding element (DBE) in the rodent Ins2 promoter region extending up to 2-kb upstream from the transcription start site revealed three regions of partial identity (Fig. 6A), which were absent in the Ins1 promoter. Region 1 in the distal Ins2 promoter contained two such binding sites starting at −768 and −673 bp upstream of transcription start site, while region 2 was identified in the proximal promoter (−141). To determine if these elements were genuine FoxO1 binding sites with physiological relevance, a chromatin immunoprecipitation experiment was carried out using cross-linked DNA from MIN6 cells cultured in 3 or 30 mm glucose and a rabbit monoclonal anti-FoxO1 antibody. As shown in Fig. 6B, and quantified in Fig. 6C, cells maintained overnight at 3 mm glucose displayed significant FoxO1 binding to the promoter region 1, to a smaller, but nevertheless significant extent to region 2, but not to region 3. Conversely, incubation of cells at 30 mm glucose effectively eliminated binding of FoxO1 to these regions. The chromatin immunoprecipitation experiments with FoxO1 antibody were validated by PCR amplification of the previously-known FoxO1 binding regions on the MafA and NeuroD promoters (supplemental Fig. S3) (37) using the same experimental DNA samples. This observation qualified regions 1 and 2 as physiological FoxO1 binding sites imparting differential regulation of Ins2 gene expression at low and high concentrations of glucose.
FIGURE 6.

A putative FoxO1 binding site detected in a distal region of mouse Ins2 promoter. A, comparison of the putative FoxO1 binding elements identified in the mouse Ins2 promoter (a) to the consensus sequences, IRE and DBE (insulin response element, Daf-16 binding element) present in FoxO1-regulated genes. Relative position of the elements corresponds to the underlined nucleotide in the element, with respect to the transcription start site (b). B, chromatin immunoprecipitation (ChIP) of cross-linked DNA from lysed MIN6 cells using anti-FoxO1 antibody or immunoglobulin (IgG) and subsequent PCR amplification of short (∼200 bp) fragments around the putative FoxO1 binding regions. MIN6 cells (70% confluent) were cultured overnight in 3 mm glucose before incubating in 3 or 30 mm glucose for 6 h and subsequently formalin fixed for 15 min. ChIP experiments were done as described under “Experimental Procedures.” The agarose gel image is representative of ≥ 4 independent ChIP experiments. C, quantification of PCR products, as in B, normalized to the matched total, for regions 1 and 2. Bar represents mean ± S.E., n = 3.
An Inhibitory Effect of FoxO1, Independent of Pdx1, Is Evident on Ins2 Promoter Activity in a Heterologous System
We sought next to determine what contribution a direct interaction of FoxO1 at the Ins2 promoter may play in the regulation of this gene, independently of a predicted action of FoxO1 to suppress Pdx1 gene expression. We therefore cloned a 915-bp region spanning (−907 to +8 bp) of the mouse Ins2 promoter and generated a promoter-reporter construct for luciferase activity assays in MIN6 β cells. While the constitutively-active variant of FoxO1 strongly suppressed Ins2 promoter activity (Fig. 7A), this may conceivably have resulted largely from inhibition of PDX1 expression as reported earlier (20). However, because simultaneous overexpression of PDX1 failed to rescue the promoter activity (Fig. 7A), although both FoxO1-EGFP and PDX1 immunoreactively colocalized in the nucleus (Fig. 7B), the direct inhibitory role of FoxO1 on mouse Ins2 promoter was clearly evident. In addition, silencing of FoxO1 de-repressed the Ins2 promoter and yielded a significantly robust activity at each glucose concentration examined (Fig. 7C). Furthermore, when a 290 bp fragment (−907 to −617 bp) from the distal end of the Ins2 promoter, including the putative FoxO1 binding site (region 1) was deleted FoxO1-CA overexpression was no longer able to inhibit the activity of the shorter promoter (Fig. 7D). Finally, the same 290 bp inhibitory region cloned upstream of a thymidine kinase (TK) promoter and a luciferase reporter conferred significant suppression to the TK promoter activity in MIN6 β cells (Fig. 7E). Interestingly, silencing of FoxO1 abolished the inhibition of the modified, but not the wild-type, TK promoter (Fig. 7E).
FIGURE 7.

FoxO1 inhibits Ins2 promoter activity independently of PDX1 analyzed by luciferase assay. A region of 915 bp of mouse Ins2 promoter. firefly luciferase reporter construct (pIns2.LucFF, 450 ng/3.8 cm2) was cotransfected with p.CMV.LucRen (1 ng/3.8 cm2) in MIN6 cells and luciferase activity in the lysate was measured as described under “Experimental Procedures.” A, cells after 6 h of transfection were subsequently infected with the adenoviral vectors (20–25 MOI) as indicated and maintained in high (25 mm) glucose for 16–20 h before analysis (n = 5). C, MIN6 cells were transfected with siRNA for 48 h preceding transfection of the promoter constructs as described in A. Following a 12 h of transfection, cells were incubated for 12–14 h in 3 or 30 mm glucose prior to luciferase assay (n = 3). D, a deletion mutant of pIns2.LucFF, lacking region 1 was constructed and promoter activity was compared with the wild type as described in A (n = 5). E, inhibition of thymidine kinase (TK) promoter activity by the FoxO1-regulated region 1 of the Ins2 promoter. The 290-bp region deleted in D, was subcloned upstream to a TK promoter driving firefly luciferase (Ins-TKFF). MIN6 cells transfected with FoxO1 or scrambled siRNA for 48 h prior to cotransfection with Ins-TKFF (500 ng/3.8 cm2) and thymidine kinase driving Renilla luciferase (TKRen, 100 ng/3.8 cm2). After 12 h of transfection cells were incubated in 3 or 30 mm glucose for 12–16 h and luciferase activity was assayed (n = 3). Bars in A, C, D, and E show mean ± S.E. from duplicate samples from ≥3 independent experiments and analyzed by two-tailed t test. B, confocal images showing the intracellular localization of co-expressed FoxO1-CA-EGFP and PDX1.c-myc examined by immunocytochemistry and DAPI staining (n≥20 cells from three independent experiments). Scale bar, 10 μm.
DISCUSSION
The principal aim of the current study was to examine the potential role of FoxO1 in the stimulation by glucose and insulin of preproinsulin gene transcription in pancreatic islet β cells. The present data are consistent with a previous report (21) suggesting that the effects of glucose on the subcellular localization of FoxO1 in β cells are mediated largely by secreted insulin. Extending these earlier findings, the inhibitor studies performed here also suggest that whereas activation of the PKB pathway is likely to be critical for the nuclear-cytosolic translocation of FoxO1, p70 S6 kinase and GSK3 are not involved. The latter finding is consistent with a previous report that FoxO1 is not a target of GSK-3 in the stimulation of IGFBP-1 expression by insulin in the liver (38).
We and others (4, 32) have previously demonstrated that glucose stimulates the accumulation of mRNAs encoding both the preproinsulin and Pdx1 (32) genes through a mechanism likely to involve the release of insulin. However, the identity of the transcriptional stimulators/repressors which mediate these effects is only partially elucidated. Thus, PDX-1, HNF1α (39), and FoxA2 (36) have each been identified as regulators of Pdx1 transcription, and likely to be important in the cell type-specific expression of this factor. We have previously shown that glucose (24, 40), but not insulin (41), also causes the translocation of PDX1 from the cytosol and nuclear periphery into the nucleoplasm. The present results suggest that FoxO1 may play an important role in the regulation by glucose and insulin of both the Ins2 and the Pdx1 genes. Thus, overexpressed FoxO1 blocked the effects of either stimulus on each promoter (Ins2- Fig. 7A, Pdx1, data not shown).
An unexpected and novel finding of the present work was that overexpression of the constitutively active FoxO1 effectively suppressed the induction of the mouse Ins2, but not Ins1 by glucose (Fig. 5C), while activation (de-repression) of Ins2 expression was observed in FoxO1-silenced cells. Interestingly, the effect of FoxO1-CA, leading to a decrease in Ins2 mRNA levels, was accompanied by a concomitant increase in Ins1 mRNA message. These observations in MIN6 cell lines are consistent with findings in an earlier report demonstrating a compensatory rise in Ins1 mRNA levels in Ins2−/− mice (42). This finding suggests that the repressive effect of FoxO1-CA on Ins2 expression is unlikely to be due simply to a decrease in PDX1 levels, as might be predicted from earlier findings (20), because such a mechanism would be expected to inhibit both Ins1 and Ins2 expression. Furthermore, the inhibitory action of FoxO1 was resistant to overexpression of exogenous PDX1 to levels capable of stimulating the Ins2 promoter to essentially the same extent as high glucose (Fig. 7A), under conditions where the presence of both FoxO1 and PDX1 could readily be demonstrated in the nucleus (Fig. 7B).
A model describing the putative role of FoxO1 in the regulation of the rodent Ins2 gene is provided in Fig. 8. This FoxO1-dependent mechanism for the control of insulin genes seems likely to play a role in an action of glucose, via the stimulated secretion of insulin and then rebinding of the hormone to its receptors on the β cells (8, 43) to activate further insulin gene transcription in an autocrine loop. Providing further evidence for such a mechanism, Hettiarachchi et al. (44) demonstrated that short term treatment of MIN6 β cells with bafilomycin led to prolonged activation of the insulin receptor, insulin receptor substrate 2 and Akt. Bafilomycin treatment also led to nuclear exclusion of FoxO1 and increased preproinsulin gene expression.
FIGURE 8.
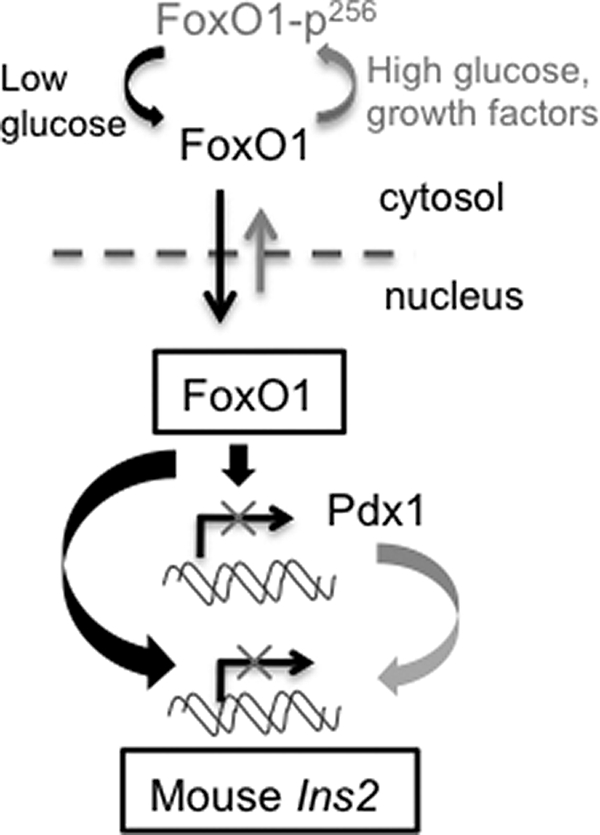
Schematic diagram showing FoxO1 mediated direct regulation of rodent Ins2 gene expression depending on available nutrient (glucose) and growth factors.
A search for consensus binding sites for the DAF-16 homologues FoxO1, FoxO3a, FoxO4 (Formerly FKHR, FKHRL1, and AFX1) (45), and IRE (46) in the mouse (and rat) preproinsulin promoters resulted in the identification of two regions in the Ins2 gene that showed glucose-regulated binding to FoxO1, and which conferred sensitivity to suppression by the constitutively active FoxO1. Interestingly, closely similar sequences lie in the regions of the human insulin promoter previously termed GGII (−148CCTTTAC) and GGI (−135TTTAAC) (47), the latter a “mini-enhancer region” now referred to as the A2 box (48). Yet another conserved site was detected in the second intron of the human (+749TGTTTTG) and Chimpanzee INS genes. None of these regions was present in mouse or rat Ins1 genes. It is important to emphasize that the origin and regulation of the Ins2 and Ins1 genes in rodents differs: the Ins1 gene seems likely to be a functional retroposon of Ins2 emerging later in evolution (49), and unlike Ins2 the former lacks genetic imprinting and expresses from both alleles (50). “Snapshot” measurements of the precise number of Ins1 and Ins2 mRNA molecules expressed in single primary β cells from mouse islets incubated at low (5 mm) and high (20 mm) glucose concentrations also indicated differential expression and inducibility of the two insulin genes previously, Ins2 mRNA being 3-fold and 2-fold higher than Ins1 mRNA at low and high glucose, respectively (51).
Notably Ins2, but not Ins1, appears to be expressed in the hypothalamus and other parts of the brain during development and possibly at later stages (52, 53). Differences in the regulatory regions lying upstream of the two genes, as further detailed in the present study, seem likely to underlie the differing expression patterns of the Ins1 and Ins2 genes in rodents.
Acknowledgments
We thank Dr. Mark Jepson and Alan Leard of the Bristol MRC Imaging Centre for technical and other support. We thank JDRF for the provision of human islets (JDRF award 31-2008-617 UK Islets for basic research programme) (to S. H and P. J.).
This work was supported by Juvenile Diabetes Research Fund (JDRF) Project Grant 1-2003-235, Wellcome Trust Programme Grants 067081/Z/02/Z and 081958/Z/07/Z, and Research Leave Fellowship (to G. A. R.) as well as grants from the BBSRC and MRC (UK), and the European Union (FP6, Save Beta).

The on-line version of this article (available at http://www.jbc.org) contains supplemental Figs. S1–S3 and Table S1.
- FOX
- Forkhead box
- DBE
- Daf-16 binding element
- GSK3
- glycogen synthase kinase-3
- IRE
- insulin response element
- MafA
- v-maf musculoaponeurotic fibrosarcoma oncogene homolog A
- NeuroD
- neurogenic differentiation 1
- PI3K
- phosphatidylinositol 3-kinase
- PKB
- protein kinase B/Akt.
REFERENCES
- 1. Rutter G. A., Tavare J. M., Palmer D. G. (2000) News Physiol. Sci. 15, 149–154 [DOI] [PubMed] [Google Scholar]
- 2. Melloul D., Marshak S., Cerasi E. (2002) Diabetologia 45, 309–326 [DOI] [PubMed] [Google Scholar]
- 3. Kulkarni R. N., Brüning J. C., Winnay J. N., Postic C., Magnuson M. A., Kahn C. R. (1999) Cell 96, 329–339 [DOI] [PubMed] [Google Scholar]
- 4. Leibiger B., Moede T., Schwarz T., Brown G. R., Köhler M., Leibiger I. B., Berggren P. O. (1998) Proc. Natl. Acad. Sci. U.S.A. 95, 9307–9312 [DOI] [PMC free article] [PubMed] [Google Scholar]
- 5. Rutter G. A. (1999) Curr. Biol. 9, R443–R445 [DOI] [PubMed] [Google Scholar]
- 6. da Silva, Xavier G., Varadi A., Ainscow E. K., Rutter G. A. (2000) J. Biol. Chem. 275, 36269–36277 [DOI] [PubMed] [Google Scholar]
- 7. Andreolas C., da Silva, Xavier G., Diraison F., Zhao C., Varadi A., Lopez-Casillas F., Ferré P., Foufelle F., Rutter G. A. (2002) Diabetes 51, 2536–2545 [DOI] [PubMed] [Google Scholar]
- 8. da Silva, Xavier G., Qian Q., Cullen P. J., Rutter G. A. (2004) Biochem. J. 377, 149–158 [DOI] [PMC free article] [PubMed] [Google Scholar]
- 9. Bouche C., Lopez X., Fleischman A., Cypess A. M., O'Shea S., Stefanovski D., Bergman R. N., Rogatsky E., Stein D. T., Kahn C. R., Kulkarni R. N., Goldfine A. B. (2010) Proc. Natl. Acad. Sci. U.S.A. 107, 4770–4775 [DOI] [PMC free article] [PubMed] [Google Scholar]
- 10. Lantz K. A., Kaestner K. H. (2005) Clin. Sci. 108, 195–204 [DOI] [PubMed] [Google Scholar]
- 11. Nakae J., Biggs W. H., 3rd, Kitamura T., Cavenee W. K., Wright C. V., Arden K. C., Accili D. (2002) Nat. Genet. 32, 245–253 [DOI] [PubMed] [Google Scholar]
- 12. Cahill C. M., Tzivion G., Nasrin N., Ogg S., Dore J., Ruvkun G., Alexander-Bridges M. (2001) J. Biol. Chem. 276, 13402–13410 [DOI] [PubMed] [Google Scholar]
- 13. Trümper A., Trümper K., Trusheim H., Arnold R., Göke B., Hörsch D. (2001) Mol. Endocrinol. 15, 1559–1570 [DOI] [PubMed] [Google Scholar]
- 14. Rena G., Guo S., Cichy S. C., Unterman T. G., Cohen P. (1999) J. Biol. Chem. 274, 17179–17183 [DOI] [PubMed] [Google Scholar]
- 15. Matsuzaki H., Daitoku H., Hatta M., Tanaka K., Fukamizu A. (2003) Proc. Natl. Acad. Sci. U.S.A. 100, 11285–11290 [DOI] [PMC free article] [PubMed] [Google Scholar]
- 16. Brunet A., Bonni A., Zigmond M. J., Lin M. Z., Juo P., Hu L. S., Anderson M. J., Arden K. C., Blenis J., Greenberg M. E. (1999) Cell 96, 857–868 [DOI] [PubMed] [Google Scholar]
- 17. McKinnon C. M., Ravier M. A., Rutter G. A. (2006) J. Biol. Chem. 281, 39358–39369 [DOI] [PubMed] [Google Scholar]
- 18. Xuan S., Kitamura T., Nakae J., Politi K., Kido Y., Fisher P. E., Morroni M., Cinti S., White M. F., Herrera P. L., Accili D., Efstratiadis A. (2002) J. Clin. Invest. 110, 1011–1019 [DOI] [PMC free article] [PubMed] [Google Scholar]
- 19. Buteau J., Shlien A., Foisy S., Accili D. (2007) J. Biol. Chem. 282, 287–293 [DOI] [PubMed] [Google Scholar]
- 20. Kitamura T., Nakae J., Kitamura Y., Kido Y., Biggs W. H., 3rd, Wright C. V., White M. F., Arden K. C., Accili D. (2002) J. Clin. Invest. 110, 1839–1847 [DOI] [PMC free article] [PubMed] [Google Scholar]
- 21. Martinez S. C., Cras-Méneur C., Bernal-Mizrachi E., Permutt M. A. (2006) Diabetes 55, 1581–1591 [DOI] [PubMed] [Google Scholar]
- 22. Ainscow E. K., Rutter G. A. (2001) Biochem. J. 353, 175–180 [DOI] [PMC free article] [PubMed] [Google Scholar]
- 23. Kennedy H. J., Viollet B., Rafiq I., Kahn A., Rutter G. A. (1997) J. Biol. Chem. 272, 20636–20640 [DOI] [PubMed] [Google Scholar]
- 24. Rafiq I., da Silva, Xavier G., Hooper S., Rutter G. A. (2000) J. Biol. Chem. 275, 15977–15984 [DOI] [PubMed] [Google Scholar]
- 25. Dhand R., Hara K., Hiles I., Bax B., Gout I., Panayotou G., Fry M. J., Yonezawa K., Kasuga M., Waterfield M. D. (1994) EMBO J. 13, 511–521 [DOI] [PMC free article] [PubMed] [Google Scholar]
- 26. Miyazaki J., Araki K., Yamato E., Ikegami H., Asano T., Shibasaki Y., Oka Y., Yamamura K. (1990) Endocrinology 127, 126–132 [DOI] [PubMed] [Google Scholar]
- 27. Cross S. E., Hughes S. J., Partridge C. J., Clark A., Gray D. W., Johnson P. R. (2008) Transplantation 86, 907–911 [DOI] [PubMed] [Google Scholar]
- 28. Ravier M. A., Rutter G. A. (2005) Diabetes 54, 1789–1797 [DOI] [PubMed] [Google Scholar]
- 29. Meur G., Simon A., Harun N., Virally M., Dechaume A., Bonnefond A., Fetita S., Tarasov A. I., Guillausseau P. J., Boesgaard T. W., Pedersen O., Hansen T., Polak M., Gautier J. F., Froguel P., Rutter G. A., Vaxillaire M. (2010) Diabetes 59, 653–661 [DOI] [PMC free article] [PubMed] [Google Scholar]
- 30. Noordeen N. A., Khera T. K., Sun G., Longbottom E. R., Pullen T. J., da Silva, Xavier G., Rutter G. A., Leclerc I. (2010) Diabetes 59, 153–160 [DOI] [PMC free article] [PubMed] [Google Scholar]
- 31. Elayat A. A., el-Naggar M. M., Tahir M. (1995) J. Anat. 186, 629–637 [PMC free article] [PubMed] [Google Scholar]
- 32. da Silva, Xavier G., Leclerc I., Varadi A., Tsuboi T., Moule S. K., Rutter G. A. (2003) Biochem. J. 371, 761–774 [DOI] [PMC free article] [PubMed] [Google Scholar]
- 33. Briaud I., Lingohr M. K., Dickson L. M., Wrede C. E., Rhodes C. J. (2003) Diabetes 52, 974–983 [DOI] [PubMed] [Google Scholar]
- 34. Lingohr M. K., Dickson L. M., McCuaig J. F., Hugl S. R., Twardzik D. R., Rhodes C. J. (2002) Diabetes 51, 966–976 [DOI] [PubMed] [Google Scholar]
- 35. Coghlan M. P., Culbert A. A., Cross D. A., Corcoran S. L., Yates J. W., Pearce N. J., Rausch O. L., Murphy G. J., Carter P. S., Roxbee C. L., Mills D., Brown M. J., Haigh D., Ward R. W., Smith D. G., Murray K. J., Reith A. D., Holder J. C. (2000) Chem. Biol. 7, 793–803 [DOI] [PubMed] [Google Scholar]
- 36. Lee C. S., Sund N. J., Vatamaniuk M. Z., Matschinsky F. M., Stoffers D. A., Kaestner K. H. (2002) Diabetes 51, 2546–2551 [DOI] [PubMed] [Google Scholar]
- 37. Kitamura Y. I., Kitamura T., Kruse J. P., Raum J. C., Stein R., Gu W., Accili D. (2005) Cell Metab. 2, 153–163 [DOI] [PubMed] [Google Scholar]
- 38. Finlay D., Patel S., Dickson L. M., Shpiro N., Marquez R., Rhodes C. J., Sutherland C. (2004) BMC. Mol. Biol. 5, 15. [DOI] [PMC free article] [PubMed] [Google Scholar]
- 39. Shih D. Q., Heimesaat M., Kuwajima S., Stein R., Wright C. V., Stoffel M. (2002) Proc. Natl. Acad. Sci. U.S.A. 99, 3818–3823 [DOI] [PMC free article] [PubMed] [Google Scholar]
- 40. Rafiq I., Kennedy H. J., Rutter G. A. (1998) J. Biol. Chem. 273, 23241–23247 [DOI] [PubMed] [Google Scholar]
- 41. Guillemain G., da, Silva, Xavier G., Rafiq I., Leturque A., Rutter G. A. (2004) Biochem. J. 378, 219–227 [DOI] [PMC free article] [PubMed] [Google Scholar]
- 42. Leroux L., Desbois P., Lamotte L., Duvillié B., Cordonnier N., Jackerott M., Jami J., Bucchini D., Joshi R. L. (2001) Diabetes. 50, S150–S153 [DOI] [PubMed] [Google Scholar]
- 43. Leibiger I. B., Leibiger B., Moede T., Berggren P. O. (1998) Mol. Cell 1, 933–938 [DOI] [PubMed] [Google Scholar]
- 44. Hettiarachchi K. D., Zimmet P. Z., Myers M. A. (2006) Cell Biol. Toxicol. 22, 169–181 [DOI] [PubMed] [Google Scholar]
- 45. Furuyama T., Nakazawa T., Nakano I., Mori N. (2000) Biochem. J. 349, 629–634 [DOI] [PMC free article] [PubMed] [Google Scholar]
- 46. Durham S. K., Suwanichkul A., Scheimann A. O., Yee D., Jackson J. G., Barr F. G., Powell D. R. (1999) Endocrinology 140, 3140–3146 [DOI] [PubMed] [Google Scholar]
- 47. Boam D. S., Clark A. R., Docherty K. (1990) J. Biol. Chem. 265, 8285–8296 [PubMed] [Google Scholar]
- 48. German M., Ashcroft S., Docherty K., Edlund H., Edlund T., Goodison S., Imura H., Kennedy G., Madsen O., Melloul D., Moss L., Olson K., Permutt M. A., Philippe J., Robertson R. P., Rutter W. J., Serup P., Stein R., Steiner D. (1995) Diabetes 44, 1002–1004 [DOI] [PubMed] [Google Scholar]
- 49. Soares M. B., Schon E., Henderson A., Karathanasis S. K., Cate R., Zeitlin S., Chirgwin J., Efstratiadis A. (1985) Mol. Cell. Biol. 5, 2090–2103 [DOI] [PMC free article] [PubMed] [Google Scholar]
- 50. Deltour L., Vandamme J., Jouvenot Y., Duvillié B., Kelemen K., Schaerly P., Jami J., Paldi A. (2004) Gene Expr. Patterns 5, 297–300 [DOI] [PubMed] [Google Scholar]
- 51. Bengtsson M., Ståhlberg A., Rorsman P., Kubista M. (2005) Genome Res. 15, 1388–1392 [DOI] [PMC free article] [PubMed] [Google Scholar]
- 52. Gannon M., Shiota C., Postic C., Wright C. V., Magnuson M. (2000) Genesis 26, 139–142 [DOI] [PubMed] [Google Scholar]
- 53. Wicksteed B., Brissova M., Yan W., Opland D. M., Plank J. L., Reinert R. B., Dickson L. M., Tamarina N. A., Philipson L. H., Shostak A., Bernal-Mizrachi E., Elghazi L., Roe M. W., Labosky P. A., Myers M. M., Jr., Gannon M., Powers A. C., Dempsey P. J. (2010) Diabetes 59, 3090–3098 [DOI] [PMC free article] [PubMed] [Google Scholar]