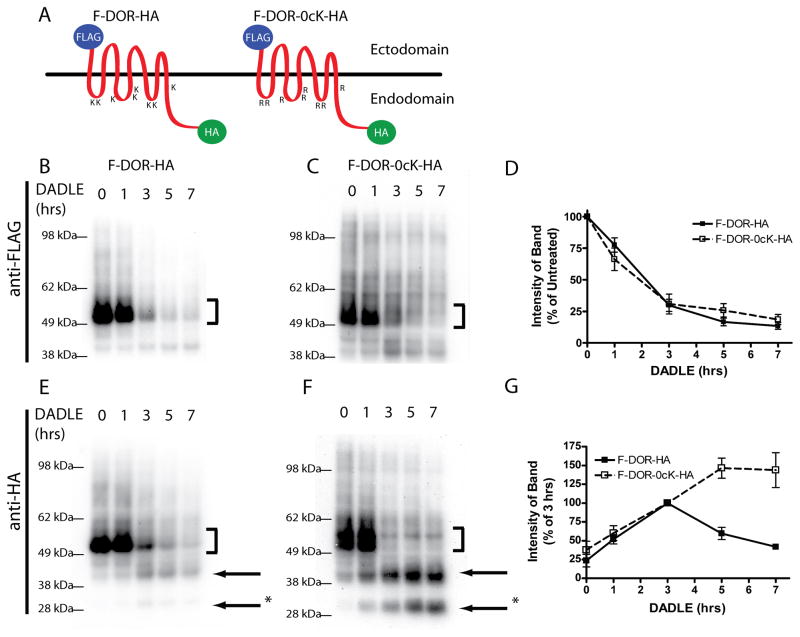
Figure 5. Differential proteolysis of N and C-terminal fragments of DOR and DOR-0cK.
A) Schematic representation of doubly-tagged receptor constructs of F-DOR-HA and F-DOR-0cK-HA indicating the N-terminal and C-terminal locations of the FLAG and HA epitope tags, respectively. HEK293 cells stably expressing F-DOR-HA (C and F) or F-DOR-0cK-HA (D and G) were incubated with 10μM DADLE for the indicated time period before lysis and division into two identical samples. Shown are representative anti-FLAG blots (C and D) and anti-HA blots (F and G) as indicated. Bracket indicates position of the full-length receptor species. Arrows denote major proteolytic cleavage products. E) Blots generated in multiple experiments were scanned to estimate the amount of FLAG-tagged receptor remaining at each time point after incubation in the presence of 10μM DADLE, expressed as a percentage of that in cells not exposed to agonist, results were pooled and averaged across multiple experiments (shown are mean and SEM, n=5). H) Anti-HA blots were scanned and the relative immunoreactivity of one proteolytic product (denoted *) was measured and expressed as a percentage of density at 3 hrs, where the band for DOR was most intense. Closed symbols indicate the degradation curve measured for F-DOR-HA, open symbols indicate the degradation curve measured in cells transfected with F-DOR-0cK-HA (mean and SEM, n=5)

