Abstract
This study investigated the application of an acquisition that selectively excites the [1-13C]lactate resonance and allows dynamic tracking of the conversion of 13C-lactate from hyperpolarized 13C-pyruvate at a high spatial resolution. In order to characterize metabolic processes occurring in a mouse model of prostate cancer, 20 sequential 3D images of 13C-lactate were acquired 5 s apart using a pulse sequence that incorporated a spectral–spatial excitation pulse and a flyback echo-planar readout to track the time course of newly converted 13C-lactate after injection of prepolarized 13C-pyruvate. The maximum lactate signal (MLS), full-width half-maximum (FWHM), time to the peak 13C-lactate signal (TTP) and area under the dynamic curve were calculated from the dynamic images of 10 TRAMP mice and two wild-type controls. The regional variation in 13C-lactate associated with the injected pyruvate was demonstrated by the peak of the 13C-lactate signal occurring earlier in the kidney than in the tumor region. The intensity of the dynamic 13C-lactate curves also varied spatially within the tumor, illustrating the heterogeneity in metabolism that was most prominent in more advanced stages of disease development. The MLS was significantly higher in TRAMP mice that had advanced disease.
Keywords: DNP, Hyperpolarized 13C, Lactate imaging, TRAMP, Prostate cancer
1. Introduction
A number of recent studies have observed higher lactate levels in prostate cancer than in normal tissue [1–3]. The concentration of lactate involves a complicated interplay among hemodynamics, cellular proliferation and energetics. As the end product of nonoxidative glycolysis, elevated lactate levels may be a valuable marker of reduced cellular oxygenation and hypoxia in cancer lesions. Even in the presence of oxygen, increased glucose uptake and conversion to lactic acid, known as the Warburg effect, are often observed due to glycolytic cells adapting to withstand a hypoxic environment [1,4]. Elevated levels of lactate have been observed in prostate cancer compared to normal prostatic tissue in proton MR spectroscopic studies that were performed on extracts of transurethral resection specimens [5] and in high-resolution magic angle spinning (HR-MAS) spectroscopic studies of both biopsy and intact surgical samples from human prostate tissue [3,6].
The TRansgenic Adenocarcinoma of Mouse Prostate (TRAMP) is a well-characterized model of prostate cancer that mimics the rapid disease progression, histopathology and metabolic changes observed in human disease [7–9]. These mice are widely used in the identification of novel biomarkers and molecular mechanisms associated with disease progression, as well as in the investigation of new strategies for characterizing and treating human prostate cancers. The use of histopathology as the definitive end point in evaluating disease progression and treatment efficacy is subjective, with significant differences between individual pathologists interpretation, and prevents the serial assessment of the associated cellular bioenergetic pathways over time. TRAMP studies would therefore greatly benefit from in vivo metabolic imaging using MR spectroscopic imaging (MRSI) with 13C nuclei. The low natural abundance and sensitivity of 13C compared to the proton pose a technical challenge using conventional approaches.
The development of dynamic nuclear polarization (DNP) techniques and a rapid dissolution procedure [10–12] has recently enabled a more than 10,000-fold enhancement of 13C NMR signals in solution. This method not only facilitates the detection of the prepolarized agent in vivo, but also the rapid imaging of cellular metabolism, with the downstream products being differentiated from the injected 13C-labeled substrate based on a change in chemical shift. [1-13C]Pyruvate is a good substrate for these studies due to its long longitudinal relaxation time and its key role in several important energy and biosynthesis pathways that are altered in cancer and other pathologies. Preliminary DNP studies in healthy rats, rat xenograft tumors and TRAMP mice have demonstrated more than 15% polarization of 13C pyruvate in solution at 3 T [11–14]. This results in a greater than 50,000-fold signal enhancement in metabolic imaging of the substrate and its metabolic products.
Time-resolved MRS acquisitions employing specialized pulse sequences were initially implemented to track the dynamic uptake of hyperpolarized 13C-pyruvate and its conversion to 13C-lactate, 13C-alanine and 13C-bicarbonate using a 3-T MR scanner [13,14]. More recently, hyperpolarized 13C-pyruvate studies of a TRAMP model using a rapid 3D MRSI technique [15] demonstrated significantly higher levels of 13C-lactate in tumor voxels compared to noncancer regions [13], and a high correlation of the 13C-lactate/(total 13C) ratio with disease progression [16]. These 3D MRSI acquisitions were acquired in 10–14 s starting at 35 s after the initiation of the hyperpolarized 13C-pyruvate bolus and provided valuable spatially resolved information. These techniques are relatively slow compared to the kinetics of the delivery and metabolism of pyruvate and do not easily allow the acquisition of multiple volumes over time.
Another approach to analyzing the time course of changes in 13C metabolism is to tailor the acquisition to excite a single resonance of interest and obtain serial images with high spatial and temporal resolution. Utilizing a new pulse sequence that incorporates a spectral–spatial rf pulse to excite a single resonance in the carbon spectrum, along with a flyback echo-planar readout trajectory for rapid imaging, can allow the acquisition of high-resolution, 3D images of 13C-lactate in 3.5 s [17]. This strategy can be used to track the time course of 13C-lactate in vivo after injection of prepolarized 13C-pyruvate with a temporal resolution of 5 s. In the current study, we demonstrated the feasibility of using dynamic 13C-lactate imaging for further characterization of prostate cancer in TRAMP mice.
2. Methods
2.1. Animal preparation and polarization methods
Two B6SJL male wild-type and 10 TRAMP mice with varying disease stages were examined in this study. Four of the TRAMP mice were classified with earlier stage disease (21–28 weeks old, 0.59 cm3 median tumor volume, 44.3 median 13C-lac/total-13C ratio) and six had more advanced disease (27–40 weeks old, 2.3 cm3 median tumor volume, 59.5 median 13C-lac/total-13C ratio). The classification was based on tumor size and appearance, and verified by the ratio of 13C-lactate to total 13C signal from 13C hyperpolarized 3D MRSI datasets that were acquired in the same animal with a separate bolus of prepolarized [1-13C]pyruvate [16]. A catheter was surgically implanted in the jugular vein of each mouse prior to the MR exam for intravenous injection of the hyperpolarized agent. All experiments were performed under a protocol approved by the UCSF Institutional Animal Care and Use Committee.
The DNP and dissolution method [10] were used to achieve 17–21% polarization for [1-13C]pyruvate in the solution state using a commercially available DNP polarizer (Oxford Instrument, Abingdon, UK) that was situated in a room adjacent to the MR scanner. The experimental setup and method for polarization and dissolution used in this study have been described previously by Chen et al. [13]. Briefly, a sample composed of [1-13C]pyruvic acid and trityl radical was cooled to 1.4 K, irradiated with microwaves for over 1 h in the presence of a 3.35-T magnetic field and then rapidly dissolved to a final substrate concentration of 80 mM. The level of polarization in the liquid state was estimated from a small aliquot of the dissolved solution using a custom-designed low-field NMR spectrometer.
The polarized solution was immediately transferred to the anesthetized animal placed on a 37°C heated pad inside the scanner via an extension tubing that was connected to the jugular vein port on the catheter. A syringe containing a 13C-lactate reference was placed adjacent to the animal. At the start of each dynamic scan, 0.3–0.35 ml of the hyperpolarized solution was injected intravenously over a period of 12 s, resulting in a blood concentration of approximately 9 mM pyruvate. The injection was immediately followed by a 150-μl saline flush to clear the 13C-pyruvate solution from the tubing.
2.2. MR Imaging protocol and parameters
The mice were scanned on a 3-T GE EXCITE MR system (Waukesha, WI, USA) equipped with multinuclear spectroscopic capabilities and a broadband amplifier, using a custom-designed 1H/13C dual-tuned mouse birdcage coil for signal transmission and reception. T2-weighted proton anatomical imaging was performed in axial, sagittal and coronal planes using a fast spin-echo (FSE) sequence with TE/TR=102/4000 ms, 192×192 image matrix, FOV=10 cm (12 cm for coronal), slice thickness=2 mm (1.5 mm for coronal), NEX=6 (8 for coronal) and 10-min scan time. An additional series of axial T2-FSE proton images were acquired at the same slice locations and FOV as the lactate imaging and used to manually define anatomical regions of interests (ROIs).
The dynamic 13C-lactate imaging employed a pulse sequence incorporating selective excitation and a flyback echo-planar readout to acquire data from a 10×10×6.4-cm FOV 3D volume in 3.5 s, with TE/TR=9.9/53.8 ms, 10° nominal flip angle and 32×32×16 spatial matrix (3.125×3.125×4 mm voxel size). The sequence incorporated a spectral–spatial excitation pulse (180 Hz pass band, 440 Hz stop band) that selectively excited 13C-lactate while keeping the magnetization of 13C-pyruvate, 13C-alanine and 13C-pyruvate hydrate along Mz [17]. The center frequency of the pass band was set on the expected frequency of lactate, based on 13C MRSI studies that were acquired in the same animal. The flip angle was experimentally selected to yield the maximum signal-to-noise ratio (SNR) in the lactate images while removing most of the residual lactate signal from the previous time-point image. This means that the lactate observed over time using this technique is not cumulative and primarily reflects the amount of new lactate converted since the previous time point. A baseline scan was acquired immediately before the dynamic lactate imaging studies for normalization of quantified parameters. Dynamic imaging was started at the beginning of the injection of prepolarized 13C-pyruvate solution. Three-dimensional lactate images were acquired with 5-s temporal resolution and 20 time points resulting in a total acquisition time of 100 s.
As part of the same hyperpolarized MR study, the mice also underwent either 1D spatially resolved dynamic MRS or 3D 13C MRSI. In the wild-type control mice, a 1D dynamic spectroscopic imaging scan was performed using a flyback echo-planar readout trajectory along the z-axis (without phase encoding) to attain sixteen 10-mm slabs of spectra every 3 s [18]. A 5° flip angle, TE of 35 ms and 588-Hz bandwidth for 288 points per spectrum were utilized. The 1D dynamic MRS acquisition began at the same time as the injection of 0.35 ml of prepolarized [1-13C]pyruvate, and each set of spectra was acquired 64 times for a total of 189 s. For the 10 TRAMP mice, 3D 13C MRSI studies were performed using a double spin-echo pulse sequence [15] with a small, variable flip-angle excitation pulse [19] and adiabatic refocusing pulses. An 8×8×1 phase-encoding matrix with flyback echo-planar readout trajectory on the z-axis (8×8×16 effective matrix) was employed to cover the mouse torso and abdomen in 13.76 s at a 5×5×5.4-mm (0.135 cm3) spatial resolution and a 40×40×86.4-mm FOV, with 59 points per spectrum, and a 581-Hz bandwidth [13]. A TE/TR of 140/215 ms was utilized to symmetrically acquire the second spin echo [20]. The acquisition began 35 s after initiating the pyruvate injection because the hyperpolarized lactate signal has been shown to be relatively constant from 35 to 49 s [16].
2.3. Data processing and analysis
All imaging and spectroscopic data were transferred offline to a UNIX workstation and processed using in-house programs created in C, IDL (Research Systems, Boulder, CO, USA) or Matlab 7.1 software (MathWorks, Natick, MA, USA). The 1D dynamic spectra and 3D MRSI data were postprocessed using custom software developed in our laboratory [21,22]. Each 1D dynamic spectrum was apodized with a 10-Hz Gaussian filter and zero filled from 288 to 512 points [18], while the 3D MRSI data were apodized by a 16-Hz Gaussian filter in the time domain and zero filled from 59 to 128 points prior to Fourier transformation [13,16].
The lactate images were reconstructed offline at two spatial resolutions: the acquired resolution (3.125×3.125 mm in-plane) for quantification of the dynamic curves and a 256×256-point, sinc-interpolated image (0.39×0.39 mm in-plane resolution) for display of the individual lactate images at each time point. The dynamic curves were intensity corrected and normalized on a voxel-by-voxel basis with respect to the mean and standard deviation of the baseline acquisition, respectively. The maximum lactate signal (MLS) or peak of the dynamic curve, full-width half-maximum (FWHM) and time to the peak 13C-lactate signal (TTP) were measured directly from the dynamic data. The area under the dynamic curve (A) was obtained by iteratively fitting the gamma-variate function
| (1) |
where the area under the curve is given by A, t0 is the bolus arrival time, α defines the skewness of the function shape and β defines the time scaling. The peak regions of the dynamic curves were fitted over five intervals (each one incrementally shifted from the previous iteration) in a nonlinear least-squares sense using a trust-region reflective Newton algorithm from Matlab for minimization. The fitting was performed on each of the five intervals three times using four, five and six points surrounding the peak. The fit coefficients that yielded the best-adjusted R2 value were used in calculating the final area value. The MLS and area parameters were then normalized by both the percent polarization and the amount of hyperpolarized solution injected.
ROIs outlining the kidney and tumor or kidney and prostate regions were manually defined on the axial T2-FSE anatomical scans for the TRAMP and wild-type control mice, respectively. Regions that appeared necrotic on the T2-FSE images were avoided in the tumor ROIs. Due to the small size of these anatomical regions compared to the resolution of the dynamic lactate curves, a lactate imaging voxel was only included in a given region if 10%, 20% or 50% of the voxel lay within the normal prostate, kidney and tumor region, respectively. In addition, only voxels with lactate signal greater than three times the standard deviation of the baseline noise were included in the analysis.
Median values of each parameter (as well as the 95th percentile for MLS and area) were determined for regions containing prostate/tumor and kidney voxels. Statistical significance between parameters in the tumor and kidney regions within the same animal was determined through the use of a Wilcoxon signed rank test, while testing for significance between tumor stages employed a Wilcoxon rank sum test. Spearman rank correlation coefficients were calculated to compare 13C-lactate values between acquisitions.
3. Results
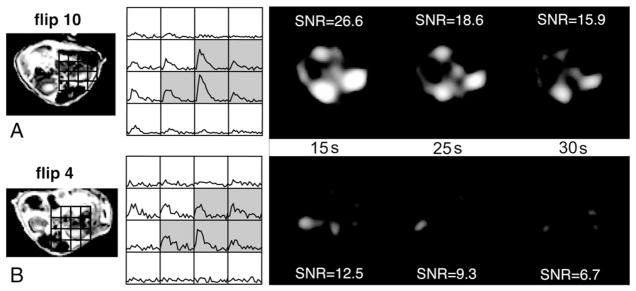
The optimized acquisition scheme for dynamic imaging of 13C-lactate provided ample SNR for measuring the time course of 13C-lactate production in vivo. Fig. 1 shows representative images of the kidney region at three time points (15, 25 and 30 s) and corresponding dynamic curves for two control mice scanned with either a 4° or a 10° flip angle. The SNR was reduced by a factor of 2 at 4°, resulting in images of poor contrast and dynamic curves that were difficult to quantify. A 25° flip angle yielded images and dynamic curves of nearly identical appearance as the 10° flip-angle data with similar SNR values.
Fig. 1.
T2-FSE image, dynamic lactate curves and lactate images at three time points (15, 25 and 30 s) of the kidney region for two control mice scanned with either a 4° (A) or a 10° (B) flip angle. For the 25° flip angle, SNR values were 26.4, 17.8 and 11.8 for the 15-, 25- and 30-s time points, respectively. The gray shading represents the voxels considered part of the kidney region.
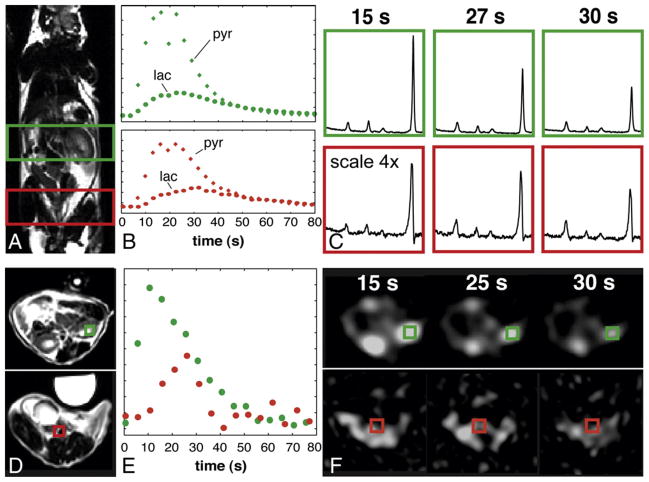
Hyperpolarized 13C-lactate was observed almost immediately following the injection of the labeled pyruvate and continued to be converted over time. The 1D dynamic spectroscopic data for the control mouse displayed in Fig. 2 illustrate the effect of 13C-pyruvate concentration on the measured 13C-lactate signal. From these data, it is evident that the hyperpolarized pyruvate signal consistently reached a maximum 15 s postinjection in both the kidney and prostate regions, and by 30 s the 13C-pyruvate levels were nearly halved. Both the 1D dynamic spectra and dynamic lactate imaging showed maximum 13C-lactate levels at 10–15 s postinjection within the kidney region; where there is maximum 13C-pyruvate for the prostate/tumor region the maximum 13C-lactate was observed after 27–33 s when 13C-pyruvate levels were lower.
Fig. 2.
Comparison between data obtained from 1D dynamic 13C MRS acquisition (A–C) and 3D dynamic 13C lactate imaging acquisition (D–F) in a male wild-type mouse. (A) A coronal T2-FSE proton image with green and red boxes delineating two of the slabs from the 1D dynamic MRS containing the kidney and healthy prostate, respectively. The plots in (B) show the change in lactate and pyruvate levels over time for these slabs, while (C) demonstrates exemplary spectra at three time points. (D) Axial T2-FSE images of the kidneys (top) and prostate (bottom). The plot in (E) depicts the lactate signal over time for the two voxels shown in (D), while (F) displays the individual lactate images for comparable time points as (C). Similar 13C-lactate time-to-peak values were observed from dynamic lactate imaging as compared to 1D dynamic MRS in voxels and slabs containing the same tissues. The syringe seen anteriorly to the mouse in (D) contained a 13C-lactate reference, but became saturated after a few time points (F).
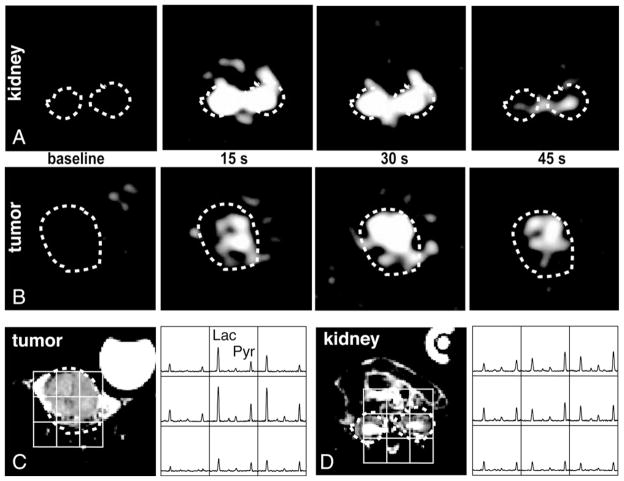
Fig. 3 displays dynamic 13C-lactate imaging and 3D 13C MRSI for a representative TRAMP mouse with an advanced-stage tumor. Similarly to the control mice, the maximum intensity of the 13C-lactate signal was observed after ~15 s in the kidney region (Fig. 3A), but the maximum intensity of lactate was observed at ~30 s postinjection in the tumor (Fig. 3B). These images were consistent with spectral data from 3D 13C MRSI that were acquired between ~35 and 49 s after starting injection as shown in Fig. 3C–D, when the lactate signal from the tumor was much higher than that from the kidney. Similarly, the signal intensity of the 13C-lactate images acquired at 45 s was nearly three times higher in the tumor than in the kidney.
Fig. 3.
Interpolated lactate images at baseline, 15, 30 and 45 s after 13C-pyruvate injection for slices containing (A) tumor and (B) kidney regions. The corresponding T2-FSE proton image and 13C 3D MRSI data are shown in (C) and (D) for the tumor and kidney, respectively. The 3D 13C MRSI is acquired between ~35 and 49 s after 13C pyruvate injection and shows similar variations in lactate as the 45-s lactate images.
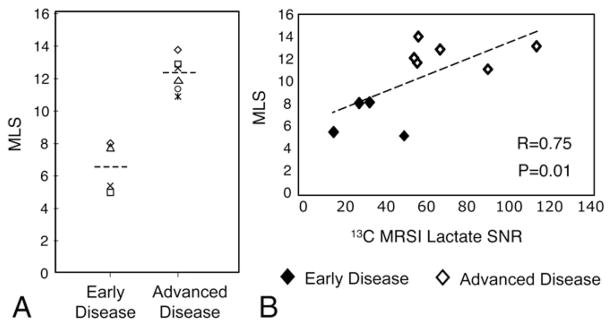
Variations in lactate signal intensities were apparent for different stages of disease development (Table 1). Fig. 4 demonstrates the elevated lactate levels observed with more advanced disease. As expected, only trace amounts of 13C lactate were seen in the normal mouse prostate. TRAMP mice in earlier stages of disease development exhibited a trend towards larger MLS and area parameters compared to the wild-type controls. TRAMP mice with more advanced-stage tumors had 60% and 86% higher median and 95th percentile MLS, respectively (P<.05), and trended towards heightened areas compared to TRAMP mice in earlier stages of disease development (Fig. 4C–D). Fig. 5A depicts the range of differences in MLS values for the individual mice, while Fig. 5B shows the tight correlation (R=0.75, Spearman rank correlation coefficient with P=.01) between MLS and 13C-lactate SNR from the 3D MRSI for all disease states. No significant differences in TTP or FWHM parameters were observed between the early and advanced groups. Normal mice showed a trend towards slightly lower FWHM and TTP values when compared to the TRAMP mice at all disease stages, but this difference was not statistically significant. Although parameters in the kidney region were not significantly affected by the tumor, the two healthy control mice exhibited slightly lower MSL values (17.9 and 14.1).
Table 1.
Summary of parameters (median±S.D.) for wild-type (n=2), early-disease (n=4) and advanced-disease (n=6) mice
| Median MLS | 95th % MLS | Area | FWHM (s) | TTP (s) | No. of voxels | R2 fit | Tumor volume | 13C-Lactate/(total 13C) | |
|---|---|---|---|---|---|---|---|---|---|
| Wild type | 6.08±0.3 | 7.54±2.3 | 33.0±4.9 | 25.0±0.0 | 26.3±5.3 | 3.5±2.1 | 0.72±0.08 | N/A | N/A |
| Early disease | 6.56±1.6 | 13.9±7.4 | 37.1±34 | 26.3±8.3 | 28.8±6.3 | 10.5±3.3 | 0.83±0.04 | 0.59±0.14 | 44.3±3.6 |
| Advanced disease | 12.2±1.1 | 31.3±8.1 | 89.3±27 | 28.8±3.0 | 30±2.6 | 33.5±30 | 0.89±0.05 | 3.55±5.75 | 62.4±8.6 |
Fig. 4.
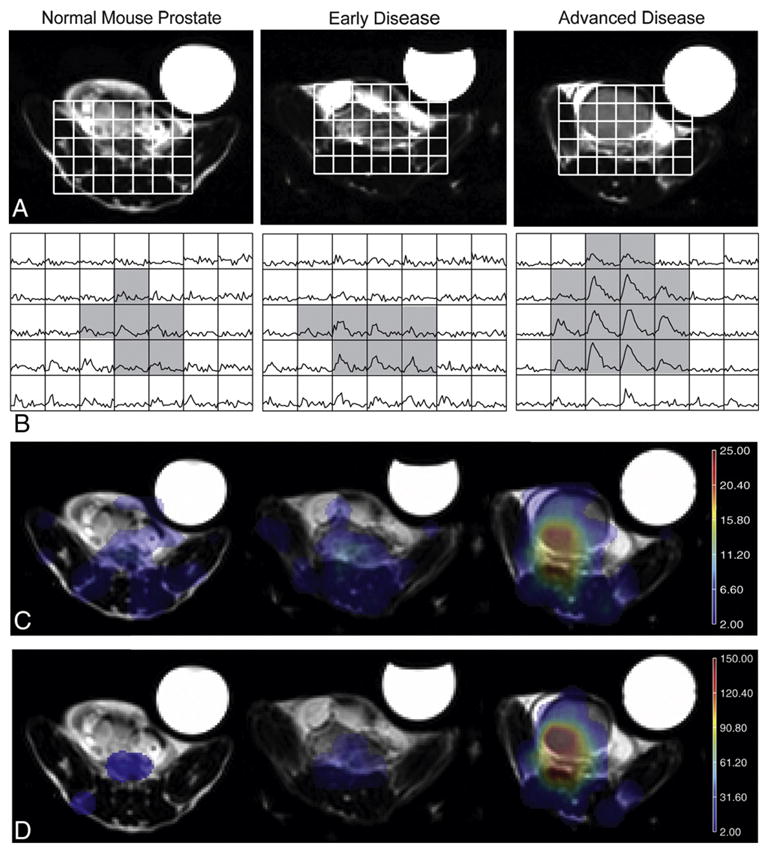
Variations in 13C-lactate production with disease progression compared to a wild-type mouse prostate (on left). (A, B) T2-FSE images of the pelvic region which contains prostatic and/or tumor tissue (A) and corresponding dynamic lactate curves (B). The gray shading in (B) denotes the voxels used in the quantification of parameters for normal prostate or tumor regions. (C, D) Maps of peak lactate signal and area under the curve, respectively.
Fig. 5.
MLS values for individual TRAMP mice grouped by disease development (A) and plotted as a function of 13C MRSI lactate SNR (B).
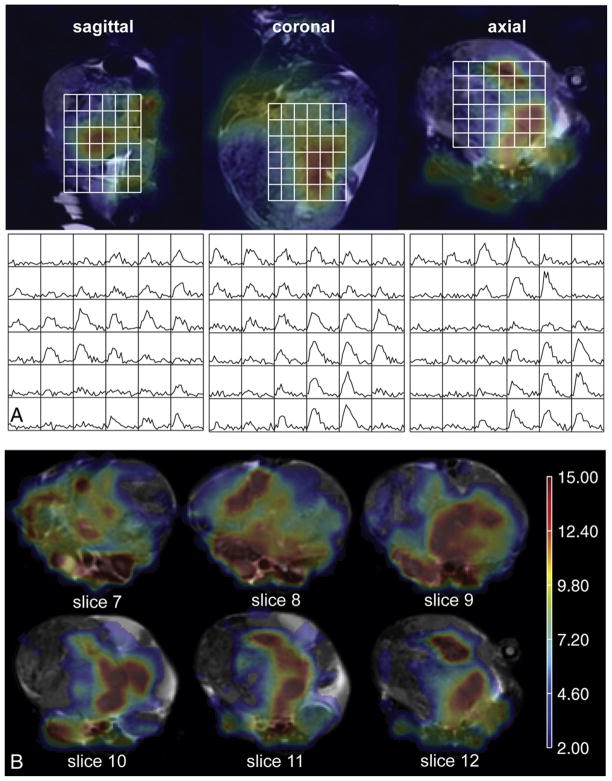
The distribution of lactate in a heterogeneous, advanced tumor is illustrated in Fig. 6. The intensity of the lactate curves varied spatially within the tumor (Fig. 6A), consistent with the known heterogeneity of this disease [3,9,16,20]. From the MLS maps in Fig. 6B, it is evident that 13C- lactate was generated at various locations throughout the tumor, both peripherally and adjacent to what appeared to be necrotic regions based on the anatomical images. The standard deviation of MLS values within a given tumor was 1.5 times larger for more advanced disease compared to that of earlier stage disease (6.8±2.2 vs. 2.8±1.7, respectively; P<.05).
Fig. 6.
Heterogeneous distribution of lactate in a TRAMP mouse with advanced disease. (A, left to right) Sagittal, coronal and axial planes of 13C lactate images 25 s after 13C pyruvate injection overlaid on T2-FSE anatomical images and corresponding dynamic lactate curves. (B) Multiple axial slices through various depths of the tumor with MLS overlay.
The dynamic lactate curves also differed between regions in the tumor and kidney for these mice as exhibited in Fig. 7 and the parameters quantified in Table 2. Note that one of the mice with more advanced disease had to be excluded from this analysis because the tumor had invaded both kidneys. The kidneys demonstrated a 1.8-fold higher median MLS value compared to the tumor region with P<.005 (2.4-fold and 1.2-fold increases for the early and advanced disease groups, respectively). Median area values in the kidney region were on average 49% higher than within the tumor with P<.005 (2.6-fold and 45% increases for tumors in early and advanced disease, respectively). The MLS was observed in the kidney 10 s before the MLS in the tumor for all mice (P=.01). Trends of 25% narrower FWHM existed in the kidneys (P=.08), although this parameter did not reach statistical significance due to one outlier (P<.05 when removed).
Fig. 7.
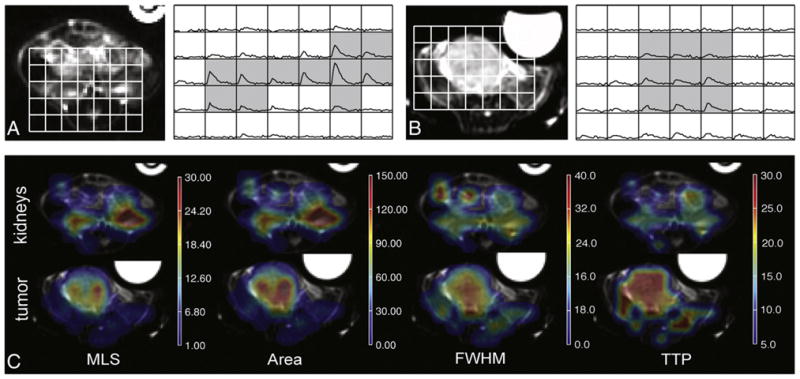
Differences in 13C dynamic lactate curves between kidney and tumor regions. (A, B) Axial T2-FSE anatomical images and corresponding dynamic curves of the kidneys (A) and the tumor (B) for a representative TRAMP mouse with advanced-stage disease. The gray shading demonstrates the voxels from which parameters were calculated for each region. (C) MSL, area, FWHM and TTP maps for the same kidney region (top) and tumor region (bottom). The asymmetry in MSL and area maps between the two kidneys is due to the positioning of the mouse within the scan plane and to partial voluming effects, as the majority of the left kidney and most elevated lactate signal are located in a superior slice.
Table 2.
Regional analysis of parameters (median±S.D.) in TRAMP mice
| Median MLS | 95th % MLS | Area | FWHM (s) | TTP (s) | No. of voxels | R2 fit | |
|---|---|---|---|---|---|---|---|
| Kidney (n=9) | 24.0±11.7 | 61.4±19.3 | 136±46.5 | 20.0±3.5 | 20±2.6 | 11±3.0 | 0.90±0.0 |
| Tumor — all (n=9) | 10.8±3.2 | 28.9±12.5 | 87.2±41.4 | 27.5±5.7 | 30±4.3 | 14±14.5 | 0.87±0.05 |
| Tumor — advanced (n=5) | 12.2±1.1 | 31.3±8.1 | 89.3±27.3 | 28.8±3.0 | 30±2.6 | 33.5±29.7 | 0.89±0.05 |
4. Discussion
The serial 3D images of [1-13C]lactate acquired after injection of prepolarized [1-13C]pyruvate clearly demonstrated the feasibility of dynamically measuring real-time changes in the formation of 13C-lactate in a TRAMP mouse model in vivo. Through quantitative assessment of parameters obtained from the dynamic 13C-lactate curves that do not rely on any prior model assumptions, we were able to characterize regional, intratumoral and disease-related variations in lactate formation in the TRAMP mouse model. While the presence of such heterogeneity is not surprising based on the histological characteristics of these tumors, this strategy for noninvasive metabolic imaging, which covers the majority of the murine body at a high spatial resolution, could be useful in determining the more aggressive part of the tumor for planning and monitoring novel experimental therapies in TRAMP mice, as well as in differentiating stages of disease that are more or less likely to respond to a given treatment. Although still preliminary, these encouraging results in the TRAMP mouse model demonstrate the potential application of this technique to improve the characterization of human prostate cancers noninvasively.
The acquisition scheme utilized in this study demonstrated the feasibility of detecting changes in pyruvate to lactate conversion in real time at a spatial resolution of 3.125×3.125×4 mm in only 3.5 s. The advantage of this technique lies in the fact that frequency selecting for only the lactate resonance preserves the amount of hyperpolarized pyruvate signal available that would have otherwise been depleted from multiple excitations. This allows for the acquisition of multiple time points at a high resolution. A flyback echo-planar readout trajectory was implemented to acquire eight lines of k-space per excitation, therefore requiring only 64 excitations for the entire volume of 16,384 voxels. For the 10° flip angle utilized in these experiments, this resulted in consumption of at least 63% of the initial available 13C-lactate magnetization and provided enough signal for the duration of the imaging volume. Smaller flip angles (<5°) would preserve >80% of the signal, resulting in a dynamic time course that is proportional to the total amount of lactate accumulation. The images from these low flip-angle acquisitions, however, did not possess sufficient SNR as shown in Fig. 1. Employing larger flip angles (20–25°) should, theoretically, both fully saturate the signal from the previous time point and increase SNR; however, we observed similar SNR values between acquisitions acquired with 10° and 25° flip angles, probably because the slightly lower expected SNR due to the 10° flip angle was balanced by some residual 13C-lactate signal from the previous time point.
The data from this study showed that the maximum amount of lactate produced was increased for more advanced disease in these TRAMP mouse tumors. The interpretation of lactate levels in the prostate region in the wild-type mouse, however, was complicated by the small size of the normal mouse prostate (~0.029 cm3) and the potential for partial voluming of surrounding tissues, as well as the low SNR in this region. In contrast, prostate tumors in TRAMP mice were significantly larger than the lactate imaging voxels, and an array of voxels could be obtained from even the smaller-size tumors. The levels of lactate observed in most tumors appeared to be elevated compared to both normal mouse prostate and the surrounding anatomy, indicating that hyperpolarized lactate has the potential to be a very sensitive biomarker for prostate cancer detection and staging, with much higher levels of 13C-lactate present in mice with more advanced disease. There was no overlap between tumors classified as early-stage and advanced-stage disease using the MLS parameter derived from the curves. Not only were the MLS levels stage dependent, but also the values varied substantially within the tumor, with increases in the standard deviation of MLS values for more advanced-stage disease compared to that of earlier stage disease. This supported the heightened heterogeneity that was visually observed and quantified (in terms of standard deviation) with disease progression. The lower 13C-lactate SNR in mice with earlier disease development may have limited the accuracy of the FWHM parameter measurement. Nonetheless, FWHM values were similar between tumor stages when removing voxels that did not reach a certain noise criteria, as were time-to-peak values, indicating comparable kinetics and time course of conversion between stages. Consequently, the increase in areas observed with tumor stage was driven mostly by the heightened MLS.
There are several main factors affecting the observed 13C-lactate signal, including the residual magnetization due to the flip angle, the amount of 13C-pyruvate present, the T1 relaxation times of the labeled pyruvate and lactate, the conversion rate of 13C-pyruvate to 13C-lactate, as well as hemodynamics. The MLS in the kidney region was both higher and occurred earlier than the lactate signal from the tumor region in all TRAMP mice, although the different time courses observed in these regions make it difficult to directly compare the amount of lactate formed. Early arrival may be due to a number of factors including higher levels of 13C-pyruvate present for conversion to 13C-lactate at earlier time points, an increased rate of conversion from 13C-pyruvate to 13C-lactate and/or a faster arrival time of the bolus due to elevated blood flow in the kidneys. The location of maximum lactate in the kidney region corresponded to the central bright region on the T2-FSE image where the long T2 signal is indicative of high fluid content. This suggests that the heightened lactate levels we see early on may be due to washout of lactate from the blood and/or other tissues such as heart and muscle. The conversion of labeled pyruvate to lactate in normal mice followed a time course that was very similar to previous data from similar experiments conducted in TRAMP mice and rat kidneys [16,23]. The timing of the MLS in the kidney from the dynamic lactate imaging data coincided within a few seconds of the maximum 13C-pyruvate concentration from the 1D dynamic spectroscopic data, while the slower time course of 13C-lactate production in the tumor region peaked when the 13C-pyruvate concentration has nearly halved (Fig. 2). Therefore, the lactate signal observed in the kidney region was most likely dominated by the arrival of pyruvate, whereas the local conversion of new lactate most likely influenced the observed signal in the prostate/tumor region. This further suggests that the labeled lactate observed in the kidneys was closely related to the blood flow into the organ, while labeled lactate observed within the tumor region was converted from the uptake of 13C-pyruvate by tumor cells where LDH activity is elevated [24]. Although it was not the aim of this work to study the metabolism of murine kidneys, the comparison of the dynamic lactate curves between different organ tissues highlights the wealth of information provided by this technique for investigating real-time metabolism.
In conclusion, this study demonstrated the feasibility of using 3D dynamic 13C-lactate imaging to characterize lactate formation in vivo at a high spatial and temporal resolution in a transgenic mouse model of prostate cancer. Parameters quantified from the dynamic 13C-lactate curves elucidated differences within individual tumors as well as between tumors with varying levels of disease progression. This new acquisition offers novel spatially resolved dynamic data of 13C-lactate and may improve our understanding of in vivo lactate formation in these disease models. Further studies will attempt to model the effect of hyperpolarized pyruvate concentration on this data and investigate whether the differences that were seen in the dynamic 13C-lactate imaging data were related to blood supply, substrate uptake and/or the rate of conversion of pyruvate to lactate.
Acknowledgments
We thank Peder Larson, Jason Crane and Vicki Zhang of the Department of Radiology and Biomedical Imaging at UCSF for their assistance with data acquisition or processing regarding this manuscript.
Footnotes
This article was presented in part at the 16th Annual Meeting of ISMRM, Toronto, Ontario, Canada, 2008.
This research was supported by NIH grants R01-EB007588, R21-EB005363 and R01-CA111291, and UC Discovery grants LSIT01–10107 and ITL-BIO04–10148 in conjunction with GE Healthcare.
References
- 1.Gillies RJ, Robey I, Gatenby RA. Causes and consequences of increased glucose metabolism of cancers. J Nucl Med. 2008;49(Suppl 2):24S–42S. doi: 10.2967/jnumed.107.047258. [DOI] [PubMed] [Google Scholar]
- 2.Kurhanewicz J, Bok R, Nelson SJ, Vigneron DB. Current and potential applications of clinical 13C MR spectroscopy. J Nucl Med. 2008;49(3):341–4. doi: 10.2967/jnumed.107.045112. [DOI] [PMC free article] [PubMed] [Google Scholar]
- 3.Swanson MG, Zektzer AS, Tabatabai ZL, Simko J, Jarso S, Keshari KR, et al. Quantitative analysis of prostate metabolites using 1H HR-MAS spectroscopy. Magn Reson Med. 2006;55(6):1257–64. doi: 10.1002/mrm.20909. [DOI] [PubMed] [Google Scholar]
- 4.Gatenby RA, Gillies RJ. Why do cancers have high aerobic glycolysis? Nat Rev Cancer. 2004;4(11):891–9. doi: 10.1038/nrc1478. [DOI] [PubMed] [Google Scholar]
- 5.Cornel EB, Smits GA, Oosterhof GO, Karthaus HF, Deburyne FM, Schalken JA, et al. Characterization of human prostate cancer, benign prostatic hyperplasia and normal prostate by in vitro 1H and 31P magnetic resonance spectroscopy. J Urol. 1993;150(6):2019–24. doi: 10.1016/s0022-5347(17)35957-8. [DOI] [PubMed] [Google Scholar]
- 6.Tessem MB, Swanson MG, Keshari KR, et al. Evaluation of lactate and alanine as metabolic biomarkers of prostate cancer using 1H HR-MAS spectroscopy of biopsy tissues. Magn Reson Med. 2008;60(3):510–6. doi: 10.1002/mrm.21694. [DOI] [PMC free article] [PubMed] [Google Scholar]
- 7.Gingrich JR, Barrios RJ, Morton RA, Boyce BF, DeMayo FJ, Finegold MJ, et al. Metastatic prostate cancer in a transgenic mouse. Cancer Res. 1996;56(18):4096–102. [PubMed] [Google Scholar]
- 8.Greenberg NM, DeMayo F, Finegold MJ, Medina D, Tilley WD, Aspinall JO, et al. Prostate cancer in a transgenic mouse. Proc Natl Acad Sci USA. 1995;92(8):3439–43. doi: 10.1073/pnas.92.8.3439. [DOI] [PMC free article] [PubMed] [Google Scholar]
- 9.Kaplan-Lefko PJ, Chen TM, Ittmann MM, Barrios RJ, Ayala GE, Huss WJ, et al. Pathobiology of autochthonous prostate cancer in a pre-clinical transgenic mouse model. Prostate. 2003;55(3):219–37. doi: 10.1002/pros.10215. [DOI] [PubMed] [Google Scholar]
- 10.Ardenkjaer-Larsen JH, Fridlund B, Gram A, Hansson G, Hansson L, Lerche MH, et al. Increase in signal-to-noise ratio of >10,000 times in liquid-state NMR. Proc Natl Acad Sci USA. 2003;100(18):10158–63. doi: 10.1073/pnas.1733835100. [DOI] [PMC free article] [PubMed] [Google Scholar]
- 11.Golman K, Zandt RI, Lerche M, Pehrson R, Ardenkjaer-Larsen JH. Metabolic imaging by hyperpolarized 13C magnetic resonance imaging for in vivo tumor diagnosis. Cancer Res. 2006;66(22):10855–60. doi: 10.1158/0008-5472.CAN-06-2564. [DOI] [PubMed] [Google Scholar]
- 12.Mansson S, Johansson E, Magnusson P, Chai CM, Hansson G, Petersson JS, et al. 13C Imaging—a new diagnostic platform. Eur Radiol. 2006;16(1):57–67. doi: 10.1007/s00330-005-2806-x. [DOI] [PubMed] [Google Scholar]
- 13.Chen AP, Albers MJ, Cunningham CH, Kohler SJ, Yen YF, Hurd RE, et al. Hyperpolarized C-13 spectroscopic imaging of the TRAMP mouse at 3T—initial experience. Magn Reson Med. 2007;58(6):1099–106. doi: 10.1002/mrm.21256. [DOI] [PubMed] [Google Scholar]
- 14.Kohler SJ, Yen Y, Wolber J, Chen AP, Albers MJ, Bok R, et al. In vivo 13 carbon metabolic imaging at 3T with hyperpolarized 13C-1-pyruvate. Magn Reson Med. 2007;58(1):65–9. doi: 10.1002/mrm.21253. [DOI] [PubMed] [Google Scholar]
- 15.Cunningham CH, Chen AP, Albers MJ, Kurhanewicz J, Hurd RE, Yen YF, et al. Double spin-echo sequence for rapid spectroscopic imaging of hyperpolarized 13C. J Magn Reson. 2007;187(2):357–62. doi: 10.1016/j.jmr.2007.05.014. [DOI] [PubMed] [Google Scholar]
- 16.Albers M, Bok R, Chen AP, Cunningham CH, Zierhut ML, Zhang VY, et al. Hyperpolarized 13C lactate, pyruvate, and alanine — non-invasive biomarkers for prostate cancer detection and staging. Cancer Res. 2008;68(20):8607–15. doi: 10.1158/0008-5472.CAN-08-0749. [DOI] [PMC free article] [PubMed] [Google Scholar]
- 17.Cunningham CH, Chen AP, Lustig M, Hargreaves BA, Lupo J, Xu D, et al. Pulse sequence for dynamic volumetric imaging of hyperpolarized metabolic products. J Magn Reson. 2008;193(1):139–46. doi: 10.1016/j.jmr.2008.03.012. [DOI] [PMC free article] [PubMed] [Google Scholar]
- 18.Chen AP, Hurd RE, Cunningham CH, Li Y, Ziehurt ML, Bok R, et al. Spatially resolved 13C hyperpolarized dynamic MRS using a flyback echo-planar readout trajectory. Experimental Nuclear Magnetic Resonance Conference; Pacific Grove, CA. March 9–14; 2008; p. 60. [Google Scholar]
- 19.Zhao L, Mulkern R, Tseng CH, Williamson D, Patz S, Kraft R, et al. Gradient-echo imaging considerations for hyperpolarized 129Xe MR. J Magn Reson B. 1996;113:179–83. [PubMed] [Google Scholar]
- 20.Chen AP, Hurd RE, Cunningham CH, Albers M, Zierhut ML, Yen YF, et al. Symmetric echo acquisition of hyperpolarized C-13 MRSI data in the TRAMP mouse at 3T. Proceedings of the International Society of Magnetic Resonance in Medicine; Berlin, Germany. May 19–26; 2007; p. 538. [Google Scholar]
- 21.Nelson SJ. Analysis of volume MRI and MR spectroscopic imaging data for the evaluation of patients with brain tumors. Magn Reson Med. 2001;46(2):228–39. doi: 10.1002/mrm.1183. [DOI] [PubMed] [Google Scholar]
- 22.Cunningham CH, Vigneron DB, Chen AP, Xu D, Nelson SJ, Hurd RE, et al. Design of flyback echo-planar readout gradients for magnetic resonance spectroscopic imaging. Magn Reson Med. 2005;54(5):1286–9. doi: 10.1002/mrm.20663. [DOI] [PubMed] [Google Scholar]
- 23.Kohler SJ, Yen Y, Wolber J, Chen AP, Albers MJ, Bok R, et al. In vivo (13)carbon metabolic imaging at 3T with hyperpolarized (13)C-1-pyruvate. Magn Reson Med. 2007;58(1):65–9. doi: 10.1002/mrm.21253. [DOI] [PubMed] [Google Scholar]
- 24.Day SE, Kettunen MI, Gallagher FA, Hu DE, Lerche M, Wolber J, et al. Detecting tumor response to treatment using hyperpolarized 13C magnetic resonance imaging and spectroscopy. Nat Med. 2007;13(11):1382–7. doi: 10.1038/nm1650. [DOI] [PubMed] [Google Scholar]


