

Abstract
TNF-α (tumor necrosis factor-α) is a potent pro-inflammatory cytokine that regulates the permeability of blood and lymphatic vessels. The plasma concentration of TNF-α is elevated (> 1 pg/mL) in several pathologies, including rheumatoid arthritis, atherosclerosis, cancer, pre-eclampsia; in obese individuals; and in trauma patients. To test whether circulating TNF-α could induce similar alterations in different districts along the vascular system, three endothelial cell lines, namely HUVEC, HPMEC, and HCAEC, were characterized in terms of 1) mechanical properties, employing atomic force microscopy; 2) cytoskeletal organization, through fluorescence microscopy; and 3) membrane overexpression of adhesion molecules, employing ELISA and immunostaining. Upon stimulation with TNF-α (10 ng/mL for 20 h), for all three endothelial cells, the mechanical stiffness increased by about 50% with a mean apparent elastic modulus of E ~5 ± 0.5 kPa (~3.3 ± 0.35 kPa for the control cells); the density of F-actin filaments increased in the apical and median planes; and the ICAM-1 receptors were overexpressed compared with controls. Collectively, these results demonstrate that sufficiently high levels of circulating TNF-α have similar effects on different endothelial districts, and provide additional information for unraveling the possible correlations between circulating pro-inflammatory cytokines and systemic vascular dysfunction.
Keywords: endothelial cells, atomic force microscopy, cytokines, elastic modulus
Introduction
Along the circulatory system, endothelial cells (ECs) line the walls of blood and lymphatic vessels and finely regulate the exchange of nutrients and waste products between the vascular compartment and the surrounding tissue. The solute exchange is accomplished through two pathways: transcellular and paracellular.1 The first pathway is associated with the active transport of macromolecules (plasma proteins)and particulate agents across the endothelial layer, mediated by cellular vesicles following a process known as transcytotis. The second pathway is associated with the convective and diffusive transport across the inter-endothelial gaps within adjacent cells. Depending on the organ and vascular district, the proportion of paracellular to transcellular transport varies. In organs of the reticulo-endothelial system (RES), such as the liver, spleen, and bone marrow, the discontinuous and highly fenestrated endothelium favors the paracellular transport across vascular openings, which can be as large as several hundreds of nanometers.2 Differently, the vasculature in non-RES organs is characterized, under physiological conditions, by a continuous endothelium which does not allow the extravasation of solute molecules larger than 3–5 nm.2
The integrity of the vessel walls and the regulation of the transvascular transport are of fundamental importance in preserving tissue–fluid homeostasis. Several factors are known to alter the paracellular and transcellular transport and eventually lead to unbalance homeostasis and major vascular dysfunctions. These include physical factors such as the trans-endothelial hydrostatic fluid pressure;3 biochemical factors such as the pro-angiogenic cytokine vascular endothelial growth factor (VEGF);4 the pro-inflammatory cytokines tumor necrosis factor-α (TNF-α),5 histamine,6 and thrombin;7 and bacterial toxins such as lipopolysaccharide (LPS).8 All these circulating molecules and agents can recognize counter-molecules(receptors) expressed on the ECs and trigger an increase in vessel permeability favoring the paracellular transport.
The continuum endothelium in healthy vessels can become hyperpermeable during an inflammatory process. This is a normal response to external injury and pathogens in which TNF-α plays a major role being involved in the activation and maturation of leukocytes and in the overexpression of specific adhesion molecules on the endothelium(E-selectin, intracellular adhesion molecules-1 [ICAM-1], vascular cell adhesion molecules-1 [VCAM-1]), which eventually favor the local recruitment of circulating leukocytes. A large number of diseases, not associated with any external stimuli or injury, are known to induce high plasma levels of several cytokines including TNF-α. In healthy patients, the plasma level of TNF-α is generally smaller than 1 pg/mL, but its concentration can be abnormally high in the presence of atherosclerosis,9–12 during tumorigenesis and tumor growth,13 in patients with rheumatoid arthritis,14 in women undergoing pre-eclamptic pregnancies,15 and in obese individuals.16 In incidences of acute trauma, elevated circulating levels of TNF-α have also been reported, including, but not limited to, traumatic brain injury17 and hemorrhagic shock.18,19 Also, others have reported that soluble forms of membrane receptors(TNFR) rather than TNF-α are initially released following trauma (based on serum levels one hour after arrival at a trauma center) and may serve as an indirect indicator that TNF-α associates with trauma.20 Significantly elevated TNF-α levels have also been linked to the onset of multiple organ failure (MOF) in trauma patients, where elevated cytokine levels, as early as one hour post admission to atrauma center, are indicative of risk of developing MOF.18
In this study, three ECs originating from different vascular districts, namely coronary (human coronary artery ECs[HCAECs]), pulmonary (human pulmonary microvascular ECs [HPMECs]), and umbilical (human umbilical vascular ECs [HUVECs]), were analyzed upon stimulation with TNF-α in terms of mechanical properties and cytoskeletal re-organization. In particular, the apparent elastic modulus, the viscoelastic response and the nonspecific adhesion force for the three ECs were estimated using atomic force microscopy(AFM). This technique has been successfully used in characterizing the mechanical response of several cell types in different species.21–23 In addition, the biological response of the three ECs to the pro-inflammatory stimulus was characterized by observing the re organization of the F-actin filaments within the cytoskeleton, through fluorescence microscopy, and by quantifying the level of membrane expression of adhesion molecules, such as ICAM-1, through ELISA and immunostaining. The main objective of the present analysis is under standing how and if the response to TNF-α would depend on the vascular district.
Materials and methods
Cell culture and TNF-α treatment
Supplies were purchased from the following sources: human coronary artery endothelial cells (HCAEC, CC-2585 Lot #EN000307), endothelial cell basal medium-2 (EBM-2), and the endothelial cell growth medium (EGM-2). BulletKits (SingleQuots) were purchased from Lonza (Walkersville, MD, USA). Human pulmonary microvascular endothelial cells (HPMEC, C-12281 Lot # 9030501) were ordered from PromoCell (Heidelberg, Germany). Human umbilical vein endothelial cells (HUVEC, Lot # EN000307) were purchased from GlycoTech (Gaithersburg, MD). TNF-α was purchased from Biosource (Camarillo, MD). Treated cell culture dishes (60 × 15 mm) were provided by Corning Incorporated (Corning, NY). Precleaned glass microscope slides (3” × 1” × 1.0 mm) were obtained from Fisher Scientific(Pittsburgh, PA). Triton X-100 was ordered from ICN Biomedicals, Inc (Aurora, OH). Anti-ICAM antibody was purchased from NeoMarkers (Fremont, CA). Anti-mouse IgG 2b(γ-2b)-peroxidase and 2,2′-azino-bis(3-ethylbenzthiazoline-6-sulphonic acid) (ABTS) were purchased from Roche (India-napolis, IN). Tween 20 was purchased from Fisher Scientific. Anti-ICAM-1 fluorescein isothiocynate (anti-ICAM-1-FITC)was purchased from Biosource(Camarillo, MD). Alexa Fluor 488 Phalloidin was obtained from Molecular Probes Invitrogen (Detection Technologies (Carlsbad, CA)).
In order to investigate the influence of TNF-α on the cell membrane elasticity, HCAEC, HUVEC, and HPMEC were seeded in a 60 mm culture dish to 80% confluence, with EBM-2 medium supplemented with an EGM-2 BulletKit and incubated for 24 h at 37°C in a 5% CO2 atmosphere. International Journal of Nanomedicine 2011:6 TNF-α stimulated endothelial cell The cells were then treated with 3 mL of TNF-α (10 ng/mL)for 20 h to promote an inflammatory response.24 Culture dishes were later rinsed with EBM-2 media to wash out the TNF-α solution. Data were taken at room temperature in a liquid atmosphere
ELISA and immunofluorescence analysis
Cells (2.5 × 10⁴ cells/well) were grown in EBM media supplemented with an EGM-2 Bullet Kit (Cambrex) at 37°C in 5% CO2. ICAM-1 was expressed on the surface of the HCAEC, HUVEC, and HPMEC by activating the cells with 10 ng/mL TNF-α for 20 h, and the extent of ICAM-1 expression was assessed by ELISA. For ELISA, the cells were incubated with TNF-α (10 ng/mL) for 20 h at 37°C and 5% CO2 in a 96-well plate. The next day, the cells were washed with PBS, fixed with Formalin for 20 minutes at room temperature, incubated with 3% BSA and 0.1% Tween 20 for 1 h, and then incubated with anti-ICAM antibody(1:1,000 dilution in PBS, v/v) for 2 h at 25°C. The unbound anti-ICAM antibody was removed from the activated cells by washing with PBS and then the cells were incubated with anti-mouse IgG 2b (γ-2b)-peroxidase (1:2,000 dilution in PBS, v/v) for 1 h at room temperature. The excess of secondary antibody was washed away with PBS and then ABTS substrate (100 μL) was added. After 30 minutes of incubation, the absorbance at 405 nm was measured with a Tecan plate reader. Nonactivated cells were also subjected to ELISA as controls.
For fluorescence microscopy measurements, cells(2.5 × 10⁴ cells/chamber) were incubated in 8-chamber tissue culture slides overnight at 37°C in 5% CO2. The next day, the cells were activated with TNF-α (10 ng/mL in EBM-2 media) for 20 h at 37°C in 5% CO2. Next, the cells were washed with PBS and fixed with 4% paraformaldehyde for 15 minutes at room temperature. The cells were then washed two more times with PBS and incubated with a solution of 0.1% Triton X-100 in PBS for 5 minutes. The unreacted sites were blocked with 1% BSA for 20 minutes. To stain actin filaments, the cells were then incubated with Alexa Fluor 488 phalloidin (5 units/mL[0.16 μM]) for 30 minutes at room temperature and washed two times with PBS before the chamber partitions were removed and the slides were dried in air. The cells’ nuclei were labeled with DAPI and then the images were captured with an Olympus IX71 inverted microscope equipped with TRITC and DAPI filters for epifluorescence measurements. Note that the same cell density was used for both ELISA and fluorescence microscopy assays. The same exposure time and acquisition settings were used for the images in Figure 3.
Figure 3.

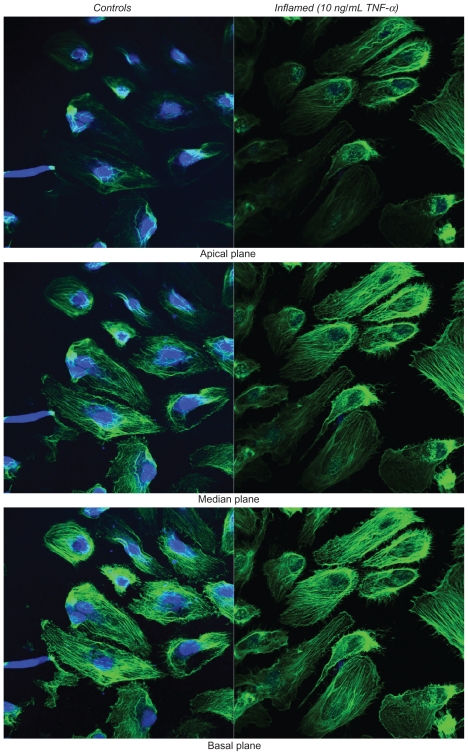
Fluorescence microscopy analysis of F-actin organization. The left column shows the unstimulated HPMECs (control) and the right column the HPMECs stimulated with 10 ng/mL TNF-α for 20 h, over three different confocal planes, namely apical, median, and basal. In green are the actin filaments (Alexa Fluor 488 phallodin staining) and in blue the cell nuclei (TO-PRO-3 staining). All scale bars are 50 μm.
Atomic force microscopy
A Bioscope II Atomic force microscope (Veeco, Santa Barbara, CA) combined with a fluorescence microscope(TE-2000; Nikon, Melville, NY) was used for testing and imaging the cells. The AFM probe consisted of a 5 μm diameter silica particle (colloidal probe) attached at the edge of silicon nitride V-shaped cantilevers (Novascan, Ames, IA) (Figure 1). Data were acquired with NanoScope software (version 7.30; Veeco). A schematic representation of the cantilever tip interacting with a cell membrane and the geometrical features of the colloidal probe are shown in Figure 1. The relatively large particle size led to larger contact areas and more evenly distributed contact pressures, which limit the penetration depth upon contact and provide average information.21 The cantilever spring constant was calibrated using thermal tuning and resulted in values from 0.1 to 0.3 N/m with less than ~8% of error25 in EBM-2 cell culture media (nominal value of 0.32 N/m).
Figure 1.

Atomic force microscopy for the mechanical characterization of live cells. a) Schematic of the colloidal probe (spherical particle attached at the tip of a cantilever beam) interacting with the cell membrane adhering over a rigid substrate. b) A representative force-displacement curve with a measurable force of adhesion Fa and area ratio Av. c) Microscopy image and geometrical data for the V-shaped cantilever beam with a colloidal probe of d = 5 μm in diameter; d) AFM micrograph of a HCAEC scanned alive to 120 μm (X-Y) in EBM-2 media at room temperature. Contact mode in liquid (DNP-S fo = 12–24 kHz, k = 0.06 N/m).
Abbreviations: N, nucleus; C, contact area; E, edge.
Analysis of the force-distance curve
The force F applied over the cell membrane by the colloidal probe is expressed as
| (1) |
where k and d are, respectively, the spring constant and deflection of the cantilever (Figure 1). Following the Hertzian theory,26 the contact radius a at the interface between the cell and the colloidal probe is expressed as
| (2) |
where E is the effective elastic modulus of the system (cell membrane-colloidal probe) defined as
| (3) |
depending on the elastic moduli and Poisson’s ratios of the cell membrane (E1, ν1) and colloidal probe (E2, ν2); R is the effective radius of the system defined as
| (4) |
depending on the radi R1 and R2 of the cell membrane and colloidal probe, respectively. Introducing the penetration depth δ(Figure 1), eq (2) is rephrased as , and combining eq (1) and (2), the relationship between the deflection of the cantilever d and the indentation depth δ of the probe is derived as
| (5) |
The parameters directly measured by operating the AFM are the cantilever beam deflection d (or equivalently the force F = kd) and the relative vertical scanner position Z. Using simple geometrical considerations (Figure 1), the parameter Z is related to the penetration depth δ as
| (6) |
where Z0 is defined as the vertical scanner position where the slope of the F-Z curves changes abruptly and d0 is the corresponding cantilever beam deflection.27 By using eq (1) and (6), the force-displacement curves F-Z directly acquired through the AFM was turned into displacement-penetration depth curves (d-δ), and through eq (5), the parameter η was derived by fitting the (d-δ) curves. Because the spring constant k of the cantilever, the radius R2 of the colloidal probe, and the Poisson’s ratio ν1 of the cell (ν1 = 0.5) were fixed, the elastic modulus E1 was readily derived from η.
For the measurement of the elastic modulus, three different approaching/retracting velocities (0.25 μm/s, 0.5 μm/s, and 1.0 μm/s) and three different forces (0.5 nN, 1.0 nN, and 2.0 nN) were used. The approaching curves (solid line in Figure 1b) were considered for calculating the elastic modulus of the cell membrane. The maximum force applied was determined by the trigger mode of the Bioscope-II. The adhesion force at the interface between the cell membrane and the colloidal probe was also measured using the Bioscope-II, fixing the approaching velocity to va = 1 μm/sand using two different retracting velocities (vr = 1 μm/s and 40 μm/s). The energy losses associated with the viscoelastic deformation of the cell membrane were estimated by dividing the area between the approaching and retracting curves by the area associated with the approaching curve, giving the area ratio Av.
For each group, no less than 50 measurements were taken for determining the F-Z curves.
Statistical analysis
The Student’s t-test was used to compare two groups. One-way ANOVA with repeated measures was used for multiple comparisons. Significance was assumed for P < 0.01. The data and errors are expressed as means ± SD.
Results
Effects of TNF-α stimulation on the apparent elastic modulus
The apparent compressive elastic moduli were calculated by analyzing the force-displacement curves obtained through AFM following the Hertzian contact theory, as described in Materials and methods. The same procedures were applied to all three ECs in both the unstimulated (control) and stimulated conditions. A typical force-displacement curve is shown in Figure 1b, where the dashed line corresponds to the approaching curve and the solid line to the retracting curve. The curves were measured over relatively flat regions of the cell membrane (point C in Figure 1d), always sufficiently far from the cell nucleus(point N in Figure 1c) and edge (point E in Figure 1c). The force-displacement curves were recorded in the same location of the cell, and the apparent elastic modulus were very consistent, exhibiting small standard deviations over multiple measurements. All the force-displacement curves were obtained for an indentation force Find of 0.5 nN and an approaching/retracting probe velocity vind of 0.25 μm/sec. For such small values of Find and vind, the assumptions of the Hertzian theory are fully satisfied:23 the indentation depth was always smaller than 200 nm (sufficiently smaller than the thickness of the cell) and the viscoelastic response of the cell membrane was negligible. The presence of a cell under the probe was monitored in situ through an optical microscope.
The apparent elastic moduli for the three cell lines are presented in the bar chart of Figure 2 (and in Supporting information Table S1), for both unstimulated (white bars)and stimulated (dark bars) conditions. E = 3.44 ± 0.64 kPa for the HUVECs, E = 3.07 ± 0.36 kPa for the HCAECs, and E = 3.42 ± 0.77 kPa were measured for the HPMECs in the unstimulated condition. The apparent elastic modulus of the three ECs were statistically identical (P > 0.1), giving an average E = 3.31 ± 0.35 kPa. These results are in good agreement with other analysis available in the literature, conducted on human ECs following the same procedures used here.23,28,29 Slightly larger values for E were measured by Kang and colleagues.30 Also, these results confirm that cells performing similar functions (endothelial cells) but located in different organs do exhibit the same apparent elastic modulus and, consequently, similar cytoskeletal organization.
Figure 2.

Apparent elastic modulus for three different endothelial cell lines. Bar chart presenting the apparent elastic modulus E for HUVEC, HCAEC, and HPMEC under unstimulated (control) and stimulated (20 h with 10 ng/mL TNF-α) conditions.(Find = 0.5 nN; vind = 0.25 μm/s; *P < 0.05; number of cells n = 3; repetitions per cell N > 30).
About 20 h after stimulation with TNF-α, force-displacement curves were recorded and analyzed to derive the apparent elastic moduli E = 5.39 ± 0.63 kPa for the HUVECs, 4.72 ± 1.15 kPa for the HCAECs, and 4.84 ± 0.89 kPa for the HPMECs. Compared with the unstimulated cells a statistically significant increase (P < 0.01) in the apparent modulus was observed for all cell lines with a ratio (Es/Eu) between stimulated (Es) and unstimulated (Eu) cells of 1.54, 1.42, and 1.56, respectively, for HCAECs, HPMECs, and HUVECs. In other words, an increase in cell stiffness of about 50% was observed upon stimulation with 10 ng/mL of TNF-α over 20 h, leading to an average E = 4.98 ± 0.53 kPa.
The measurement of the apparent elastic modulus is influenced by the force applied over the cell membrane, the velocity of the probe, and, consequently, the depth of penetration of the probe. Therefore, a sensitivity analysis was performed on E by varying the indentation force Find between 0.5 and 2 nN and the indentation velocity vind between 0.25 and 0.1 μm/sec. The results of such analysis, summarized in Supporting information (Figure S1), confirmed the importance of reducing Find and vind for accurately estimating the compressive modulus. The penetration depth in all the experiments was smaller than 200 nm. Different methods have been proposed, in addition to atomic force microscopy, to extract the mechanical properties of cells, such as magnetic31 and optical32 tweezers, and micropipettes.33 Generally, the methods and the procedures affect the final measure, giving different values for the mechanical stiffness for even the same cell. Nonetheless, it is important to emphasize that the present work aims at a comparative analysis rather than an absolute measurement of the cellular mechanical properties.
The response to TNF-α stimulation was also documented by analyzing the reorganization of the actin filaments within the cytoskeleton and the overexpression of the adhesive molecules ICAM-1. The staining of the actin filaments with Alexa Fluor 488 phalloidin was observed over three different planes, namely apical, median, and basal, using confocal fluorescent microscopy. For the unstimulated HPMECs, dense and thick actin filaments were observed on the basal and median plane transversing the whole cell, whereas on the apical plane the filaments were mostly located at the edge of the cell (Figure 3, left column). Upon stimulation with TNF-α, the fluorescence intensity associated with the actin filaments increased over the median and mostly over the apical plane where dense and thick filaments crossing the whole cells were clearly visible (Figure 3, right column). Similar results were observed in the case of the HCAEC and HUVEC, as shown in Supporting information (Figure S2). The actin filaments are known to form a network under the cell membrane providing mechanical strength and to undergo extensive remodeling and reorganization upon TNF-α stimulation.34–36 The observed increase in filament density could explain the higher stiffness of the stimulated cells as compared with the controls. Also, the level of expression of ICAM-1 was measured through ELISA, demonstrating a statistically significant increase in the surface density for these adhesive molecules (Figure 4), normally overexpressed on the inflamed endothelium.24 The increased expression of ICAM-1 molecules was also shown through immunostaining (Supporting information, Figure S3).
Figure 4.

Expression of adhesive molecules ICAM-1 measured through ELISA. Bar chart presenting the expression of ICAM-1 molecules in unstimulated cells (white bar) and cells stimulated with 10 ng/mL TNF-α for 20 h (grey bar). *P < 0.01.
Effects of TNF-α stimulation on the force of adhesion and viscoelastic response
In addition to the apparent elastic modulus, the adhesive force at the interface between the colloidal probe and the cell membrane and the viscoelastic response of the cell were recorded.37 The force of adhesion Fa was estimated as the maximum force measured along the retracting curve(Figure 1b), whereas the viscoelastic response was quantified as the ratio (Av) between the energy dissipated due to viscoelastic losses (area between the approaching and retracting curves – dashed area in Figure 1b) and the overall mechanical work performed (area under the approaching curve).
Because the AFM probe was not decorated with any ligand molecules, interfacial adhesion was only associated with weak nonspecific interactions. This was reflected by the negligibly small values of Fa (<1 nN) measured with low indentation forces Find (= 0.5 nN) and velocities vind(= 0.25 μm/s). In all experiments, the retracting curves appeared as continuous with no noticeable abrupt jumps, generally associated with the breakage of specific molecular bonds, thus confirming the nonspecific nature of the forces at the probe-cell interface. Therefore, in order to generate appreciable adhesive forces and viscoelastic losses, the indentation force and the retracting velocity were increased up to Find = 5.0 nN and vret = 40.0 μm/s, respectively.
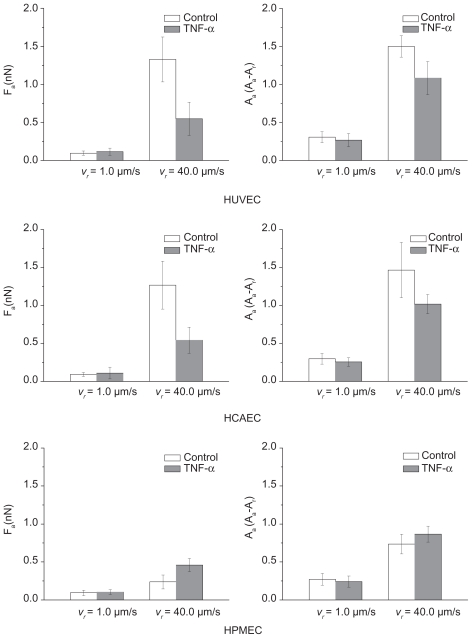
Figure 5 shows the force of adhesion Fa and the area ratio Av, defined as above, for the three ECs under unstimulated(white bars) and stimulated (black bars) conditions. For the unstimulated HUVECs and HCAECs an adhesion force (area ratio Av) of 1.32 ± 0.30 nN (1.50 ± 0.14) and 1.26 ± 0.31 nN(1.47 ± 0.37) was measured, respectively. These data were statistically identical (P > 0.03) and significantly larger than the adhesion force (area ratio) estimated for the unstimulated HPMECs with a value of 0.24 ± 0.10 nN (0.74 ± 0.13). In the Supporting information, the data are listed in Table S2. It is interesting to observe that under physiological conditions, the viscoelastic losses associated with the endothelial cells of the pulmonary microvasculature are about 50% smaller than those associated with the umbilical and coronary endothelial cells. Indeed, the lung microvasculature is continuously subjected to compressions and expansions, following the respiratory cycle, and a smaller area ratio Av would imply lower viscoelastic losses.
Figure 5.

Adhesion force and viscoelastic response of three different endothelial cell lines. The force of adhesion Fa a) and the area ratio Av b) for three different cell lines (HUVEC, HCAEC, and HPMEC) under unstimulated (control) and stimulated (20 h with 10 ng/mL TNF-α) conditions. (Find = 5 nN; vret = 40 μm/s; *P < 0.05; number of cells n = 3; repetitions per cell N > 30).
More interestingly, for the stimulated ECs, the force of adhesion Fa (area ratio Av) was similar for all cell lines(P > 0.01) being, respectively, 0.55 ± 0.22 nN (1.08 ± 0.22)for the HUVECs, 0.54 ± 0.17 nN (1.02 ± 0.13) for the HCAECs, and 0.46 ± 0.09 nN (0.74 ± 0.13) for the HPMECs. The force of adhesion and viscoaelastic losses for the HUVECs and HCAECs decreased significantly (50%) upon stimulation with TNF-α, whereas an opposite trend was observed for the HPMECs. In the Supporting information (Figure S4), a sensitivity analysis is presented elucidating the effect of the retracting velocity on the force of adhesion and viscoelastic losses. It is confirmed that the viscoelastic response of the cell membrane decreases as the retracting velocity reduces.
Discussion
TNF-α is a pro-inflammatory cytokine secreted primarily by macrophages and endothelial cells during an inflammatory response.38 However, it is becoming clear that other cells can also release in the tissue and eventually in the circulation large amounts of TNF-α, including lymphoid cells, mast cells, cardiac myocytes, adipose tissue, fibroblasts, and neuronal tissue.38,39 The physiological plasma concentration of TNF-α is smaller than 1 pg/mL. However under pathological conditions, a substantial increase was documented depending on the patient, and type and stage of the pathology. In Table 1, the TNF-α plasma concentrations are listed for several different pathologies. Indeed, high plasma levels of TNF-α are known to be toxic40 and could lead to vascular dysfunction.
Table 1.
List of the most common pathologies presenting higher levels of circulating TNF-α and corresponding concentration
| Pathology | Plasma level of TNF-α [pg/mL] | Ref. |
|---|---|---|
| Physiological conditions | <1.0 | |
| Rheumatoid arthritis | 1000 | [8] |
| Atherosclerosis | 1000–2000 | [40] |
| Colorectal cancer | 2 | [18] |
| Pancreatic adenocarcinoma | 30 | [42] |
| Non-small cell lung cancer | 10 | [9] |
| Chronic lymphocytic leukemia | 20 | [12] |
| Prostate cancer | 4 | [29] |
| Metastatic prostate cancer | 6 | [29] |
| Breast cancer | 5 | [44] |
| Pre-eclampsia | 200 | [23] |
| Obesity | 10 | [36] |
| Hemorrhagic shock alone | 60 | [37] |
| Hemorrhagic shock with subsequent MOF | 160 | [37] |
Based on the presented AFM characterization and cytokine response of three different ECs, it is tempting to speculate that relatively low, nonphysiological concentrations of circulating TNF-α (<1–10 ng/mL, much lower than the maximum tolerable dose) over a sufficiently long time (from months to years) could be responsible for a progressive systemic alteration of the endothelium with an increase in cell stiffness and vascular permeability. Systemic vascular dysfunction could be the minimum common denominator for several apparently unrelated diseases, such as rheumatoid arthritis, atherosclerosis, tumor progression and metastatization, pre-eclampsia, obesity, and trauma, which are associated with high circulating levels of TNF-α.
Additional studies are needed to better characterize the response of the endothelial cells to TNF-α, including, in particular, the contribution of continuous blood flow. ECs exposed to continuous hydrodynamic shear stresses increase their stiffness over time,41 and this has been associated with an increase in actin fiber density primarily on the basal plane. Differently, TNF-α stimulation was here observed to alter the actin density mainly at the apical and median planes. These observations would support a cooperative contribution of hydrodynamic shear stresses and TNF-α in cell stiffening. However, specific experiments should be designed to better analyze this issue.
Conclusions
The mechanical properties of three different cell lines(HUVEC, HCAEC, and HPMEC) were analyzed before and after stimulation with the pro-inflammatory cytokine TNF-α. The analysis revealed that (1) before stimulation with TNF-α, no significant difference exists in terms of apparent compressive modulus among the three vascular districts tested with E = 3.30 ± 0.35 kPa; (2) upon stimulation with TNF-α, the stiffness of the ECs increases by about 50%, reaching E = 5 ± 0.5 kPa; (3) before stimulation with TNF-α, the viscoelastic losses in the pulmonary microvasculature are about 50% lower than in the other two districts considered, for which no significant statistical difference was observed; and (4) upon stimulation with TNF-α, the viscoelastic losses become statistically similar in all three vascular districts.
To the author’s knowledge, this is the first work analyzing the effect of pro-inflammatory cytokines on three different EC types and demonstrating that the response to TNF-α simulation is independent of the vascular district. The observed increase in mechanical stiffness could be related to the larger density and thickness of the actin fibers observed mainly on the apical and median cell planes. These results provide additional information for unraveling the possible correlations between circulating pro-inflammatory cytokines, such as TNF-α, and systemic vascular dysfunction.
Acknowledgments
This work has been partially supported by the Telemedicine and Advanced Technology Research Center (TATRC) of the US Army Medical Research Acquisition Activity (USAMRAA) through the pre-Center Grant entitled “Rational design of particulate systems for the imaging and hyperthermia treatment of an inflamed endothelium”. At the University of Texas, this work has also been partially supported through the grants DODW81XWH-09-1-0212, NIH U54CA143837 and by the State of Texas, Emerging Technology Fund. The work developed at CeTIR was supported by W81XWH-07-2-0031 and 81XWH- 04-2-0067 TexSHIELD (Texas Science, Humanitarian Intervention, Education, and Leadership in Disaster) grants.
Supporting information
The measurement of the apparent cell elastic modulus E is influenced by the force applied over the cell membrane, the velocity of the probe, and, consequently, the depth of penetration of the probe. Therefore, a sensitivity analysis was performed on E by varying the indentation force Find between 0.5 and 2 nN and the indentation velocity vind between 0.25 and 0.1 μm/sec. The results of such analysis are summarized in Figure S1 below and confirm the importance of reducing Find and vind for accurately estimating the compressive modulus. The penetration depth in all the experiments was smaller than 200 nm.
The staining of the actin filaments with Alexa Fluor 488 phalloidin was observed over three different planes, namely apical, median, and basal, using confocal fluorescent microscopy. Figure S2a and b show the results for the HUVECs and HCAECs, respectively, in the unstimulated (left columns)and TNF-α stimulated (right columns) conditions. Upon stimulation with TNF-α, the fluorescence intensity associated with the actin filaments increases over the median and apical cell planes.
The increased expression of ICAM-1 molecules upon stimulation with TNF-α is also observed through immunostaining. Figure S3 below shows the immunostaining for ICAM-1 for the three ECs considered.
A sensitivity analysis is presented in Figure S4 below, elucidating the effect of the retracting velocity vret on the force of adhesion and viscoelastic losses for the three ECs considered. It is confirmed that the viscoelastic response of the cell membrane decreases as the retracting velocity reduces.
The apparent elastic modulus E for the three ECs, presented in the bar chart of Figure 2, is explicitly listed in Table S1 below. Results are presented as mean ± SD and the number of repetitions n is also listed
The force of adhesion Fa and the area ratio Av for the three ECs, presented in the bar chart of Figure 5, are explicitly listed in Table S2 below. Results are presented as mean ± SD and the number of repetitions n is also listed..
Figure S1.
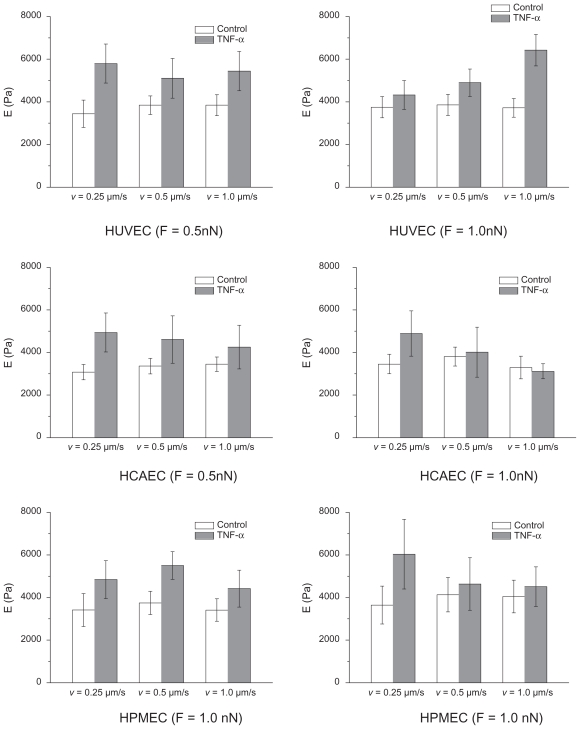
Effect of the indenting velocity and force on the apparent elastic modulus (Find = 0.5 and 1.0 nN; vind = 0.25, 0.5, 1.0 μm/s)
Figure S2a.
Actin staining for the HUVECs.
Figure S2b.
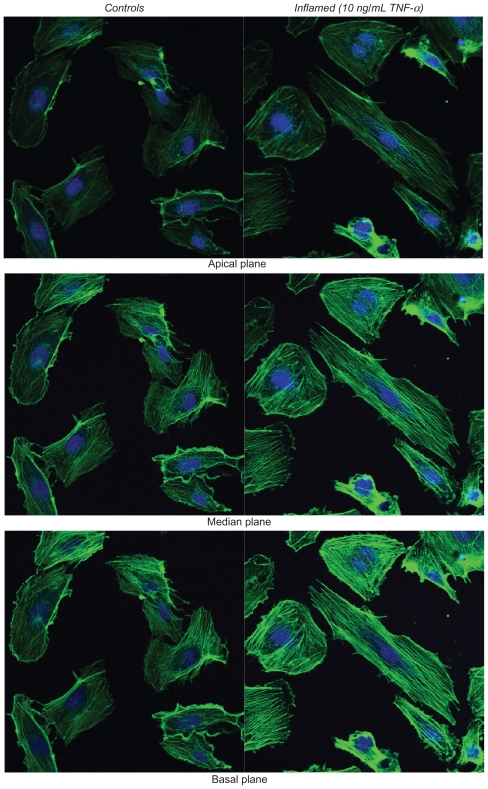
Actin staining for the HCAECs.
Figure S3.
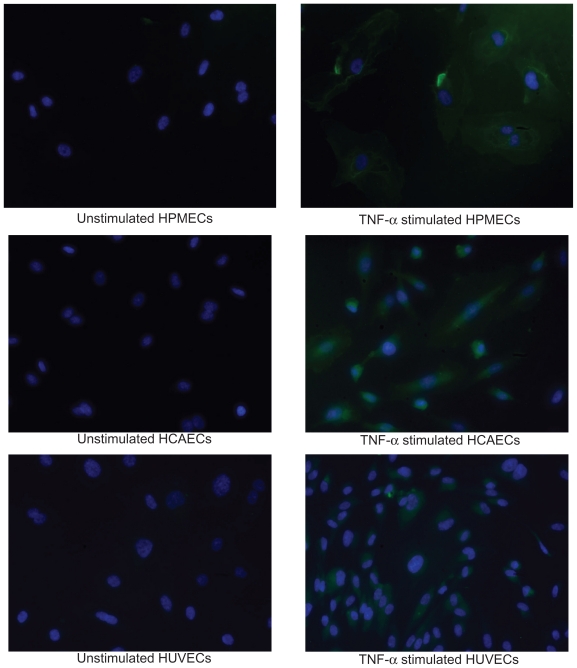
Immunostaining for the ICAM-1 molecules.
Figure S4.
Effect of the retracting velocity (vr) on the force of adhesion (Fa = 5 nN; va = 1 μm/s and 40 μm/s).
Table S1.
| Cell type and condition | Apparent elastic modulus [kPa] | ||
|---|---|---|---|
| HUVEC | Unstimulated | n = 42 | 3.44 ± 0.64 |
| TNF-α stimulated | n = 46 | 5.39 ± 0.63 | |
| HCAEC | Unstimulated | n = 20 | 3.07 ± 0.36 |
| TNF-α stimulated | n = 21 | 4.94 ± 0.92 | |
| HPMEC | Unstimulated | n = 38 | 3.42 ± 0.77 |
| TNF-α stimulated | n = 20 | 4.84 ± 0.89 |
Table S2.
| Cell type and condition | Force of adhesion Fa [nN] | Area ratio Av | ||
|---|---|---|---|---|
| HUVEC | Unstimulated | 1.32 ± 0.30 nN | n = 146 | 1.50 ± 0.14 |
| TNF-α stimulated | 0.55 ± 0.22 nN | n = 150 | 1.08 ± 0.22 | |
| HCAEC | Unstimulated | 1.26 ± 0.31 nN | n = 150 | 1.47 ± 0.37 |
| TNF-α stimulated | 0.54 ± 0.17 nN | n = 150 | 1.02 ± 0.13 | |
| HPMEC | Unstimulated | 0.24 ± 0.09 nN | n = 150 | 0.74 ± 0.13 |
| TNF-α stimulated | 0.46 ± 0.09 nN | n = 150 | 0.87 ± 0.10 |
Footnotes
Disclosure
No conflicts of interest were declared in relation to this paper.
References
- 1.Komarova YA, Malik AB. Regulation of endothelial permeability via paracellular and transcellular transport pathways. Ann Rev Physiol. 2001;12:463–493. doi: 10.1146/annurev-physiol-021909-135833. [DOI] [PubMed] [Google Scholar]
- 2.Michiels C. Endothelial cell functions. J Cell Physiol. 2003;196(3):430–443. doi: 10.1002/jcp.10333. [DOI] [PubMed] [Google Scholar]
- 3.Tokuda S, Miyazaki H, Nakajima K, et al. Hydrostatic pressure regulates tight junctions, actin cytoskeleton and transcellular ion transport. Biochem Biophys Res Commun. 2009;390(4):315–321. doi: 10.1016/j.bbrc.2009.10.144. [DOI] [PubMed] [Google Scholar]
- 4.Dvorak HF. Discovery of vascular permeability factor (VPF) Exp Cell Res. 2006;312:522–526. doi: 10.1016/j.yexcr.2005.11.026. [DOI] [PubMed] [Google Scholar]
- 5.Worrall NK, Chang K, LeJeune WS, et al. TNF-alpha causes reversible in vivo systemic vascular barrier dysfunction via NO-dependent and - independent mechanisms. Am J Physiol. 1997;273:LH2565–2574. doi: 10.1152/ajpheart.1997.273.6.H2565. [DOI] [PubMed] [Google Scholar]
- 6.Pober JS, Sessa WC. Evolving functions of endothelial cells in inflammation. Nat Rev Immunol. 2007;7:803–815. doi: 10.1038/nri2171. [DOI] [PubMed] [Google Scholar]
- 7.Komarova YA, Mehta D, Malik AB. Dual regulation of endothelial junctional permeability. Sci STKE. 2007;412:re8. doi: 10.1126/stke.4122007re8. [DOI] [PubMed] [Google Scholar]
- 8.Wu SW, Aird WC. Thrombin, TNF-alpha, and LPS exert overlapping but nonidentical effects on gene expression in endothelial cells and vascular smooth muscle cells. Am J Physiol Heart Circ Physiol. 2005;289:H873–885. doi: 10.1152/ajpheart.00993.2004. [DOI] [PubMed] [Google Scholar]
- 9.Bozkurt B, Mann DL, Deswal A. Biomarkers of inflammation in heart failure. Heart Fail Rev. 2010;15(4):331–341. doi: 10.1007/s10741-009-9140-3. [DOI] [PubMed] [Google Scholar]
- 10.Feldman AM, Combes A, Wagner D, et al. The role of tumor necrosis factor in the pathophysiology of heart failure. J Am Coll Cardiol. 2000;35(3):537–544. doi: 10.1016/s0735-1097(99)00600-2. [DOI] [PubMed] [Google Scholar]
- 11.Libby P, Aikawa M, Jain MK. Vascular endothelium and atherosclerosis. Handb Exp Pharmacol. 2006;176:285–306. doi: 10.1007/3-540-36028-x_9. [DOI] [PubMed] [Google Scholar]
- 12.McKellar GE, McCarey DW, Sattar N, et al. Role for TNF in atherosclerosis? Lessons from autoimmune disease. Nat Rev Cardiol. 2009;6(6):410–417. doi: 10.1038/nrcardio.2009.57. [DOI] [PubMed] [Google Scholar]
- 13.Kim JA, Montagnani M, Koh KK, et al. Reciprocal relationships between insulin resistance and endothelial dysfunction: molecular and pathophysiological mechanisms. Circulation. 2006;113(15):1888–1904. doi: 10.1161/CIRCULATIONAHA.105.563213. [DOI] [PubMed] [Google Scholar]
- 14.McInnes IB, Schett G. Cytokines in the pathogenesis of rheumatoid arthritis. Nat Rev Immunol. 2007;7(6):429–442. doi: 10.1038/nri2094. [DOI] [PubMed] [Google Scholar]
- 15.Laskowska M, Leszczyńska-Gorzelak B, Laskowska K, et al. Evaluation of maternal and umbilical serum TNF-alpha levels in pre-eclamptic pregnancies in the intrauterine normal and growth-restricted fetus. J Matern Fetal Neonatal Med. 2006;19(6):347–351. doi: 10.1080/14767050600637937. [DOI] [PubMed] [Google Scholar]
- 16.Rocha VZ, Libby P. Obesity, inflammation, and atherosclerosis. Nat Rev Cardiol. 2009;6(6):399–409. doi: 10.1038/nrcardio.2009.55. [DOI] [PubMed] [Google Scholar]
- 17.Harting MT, Jimenez F, Adams SD, et al. Acute, regional inflammatory response after traumatic brain injury: Implications for cellular therapy. Surgery. 2008;144(5):803–813. doi: 10.1016/j.surg.2008.05.017. [DOI] [PMC free article] [PubMed] [Google Scholar]
- 18.Roumen RM, Hendriks T, van der Ven-Jongekrijg J, et al. Cytokine patterns in patients after major vascular surgery, hemorrhagic shock, and severe blunt trauma. Relation with subsequent adult respiratory distress syndrome and multiple organ failure. Ann Surg. 1993;218(6):769–776. doi: 10.1097/00000658-199312000-00011. [DOI] [PMC free article] [PubMed] [Google Scholar]
- 19.Suter PM, Suter S, Giradin E, et al. High bronchoalveolar levels of tumour necrosis factor and its inhibitors, interleukin-1, interferon and elastase, in patients with adult respiratory distress syndrome after trauma, shock or sepsis. Am Rev Resp Dis. 1992;145:1016–1022. doi: 10.1164/ajrccm/145.5.1016. [DOI] [PubMed] [Google Scholar]
- 20.Tan LR, Waxman K, Scannell G, et al. Trauma causes early release of soluble receptors for tumor necrosis factor. J Trauma. 1993;34:634–638. doi: 10.1097/00005373-199305000-00004. [DOI] [PubMed] [Google Scholar]
- 21.Iyer S, Gaikwad RM, Subba-Rao V, et al. Atomic force microscopy detects differences in the surface brush of normal and cancerous cells. Nat Nanotech. 2009;4:389–393. doi: 10.1038/nnano.2009.77. [DOI] [PMC free article] [PubMed] [Google Scholar]
- 22.Mahaffy RE, Park S, Gerde E, Käs J, Shih CK. Quantitative analysis of the viscoelastic properties of thin regions of fibroblasts using atomic force microscopy. Biophys J. 2004;86(3):1777–1793. doi: 10.1016/S0006-3495(04)74245-9. [DOI] [PMC free article] [PubMed] [Google Scholar]
- 23.Mathur AB, Collinsworth AM, Reichert WM, et al. Endothelial, cardiac muscle and skeletal muscle exhibit different viscous and elastic properties as determined by atomic force microscopy. J Biomech. 2001;34(12):1545–1553. doi: 10.1016/s0021-9290(01)00149-x. [DOI] [PubMed] [Google Scholar]
- 24.Danila D, Partha R, Elrod DB, et al. Antibody-labeled liposomes for CT imaging of atherosclerotic plaques: in vitro investigation of an anti-ICAM antibody-labeled liposome containing iohexol for molecular imaging of atherosclerotic plaques via computed tomography. Tex Heart Inst J. 2009;36(5):393–403. [PMC free article] [PubMed] [Google Scholar]
- 25.Butt HJ, Jaschke M. Calculation of thermal noise in atomic force microscopy. Nanotechnology. 1995;6:1–7. [Google Scholar]
- 26.Shigley J. Mechanical Engineering Design. New York, NY: McGraw-Hill; 1983. [Google Scholar]
- 27.Touhami A, Nysten B, Dufrene YF. Nanoscale mapping of the elasticity of microbial cells by atomic force microscopy. Langmuir. 2003;19:4539–4543. [Google Scholar]
- 28.Mathur AB, Truskey GA, Reichert WM. Atomic force and total internal reflection fluorescence microscopy for the study of force transmission in endothelial cells. Biophys J. 2000;78(4):1725–1735. doi: 10.1016/s0006-3495(00)76724-5. [DOI] [PMC free article] [PubMed] [Google Scholar]
- 29.Kataoka N, Iwaki K, Hashimoto K, et al. Measurements of endothelial cell-to-cell and cell-to-substrate gaps and micromechanical properties of endothelial cells during monocyte adhesion. PNAS. 2002;99(24):15638–15643. doi: 10.1073/pnas.242590799. [DOI] [PMC free article] [PubMed] [Google Scholar]
- 30.Kang I, Panneerselvam D, Panoskaltsis VP, Eppell SJ, Marchant RE, Doerschuk CM. Changes in the hyperelastic properties of endothelial cells induced by tumor necrosis factor-α. Biophy J. 2008;94:3273–3285. doi: 10.1529/biophysj.106.099333. [DOI] [PMC free article] [PubMed] [Google Scholar]
- 31.Bausch AR, Möller W, Sackmann E. Measurement of local viscoelasticity and forces in living cells by magnetic tweezers. Biophys J. 1999;76:573–579. doi: 10.1016/S0006-3495(99)77225-5. [DOI] [PMC free article] [PubMed] [Google Scholar]
- 32.Wei MT, Zaorski A, Yalcin HC, et al. A comparative study of living cell micromechanical properties by oscillatory optical tweezers. Opt Express. 2008;16(12):8594–8603. doi: 10.1364/oe.16.008594. [DOI] [PubMed] [Google Scholar]
- 33.Sato M, Theret DP, Wheeler LT, et al. Application of the micropipette technique to the measurement of cultured porcine aortic endothelial cell viscoelastic properties. J Biomech Eng. 1990;112(3):263–268. doi: 10.1115/1.2891183. [DOI] [PubMed] [Google Scholar]
- 34.Campos SB, Ashworth SL, Wean S, et al. Cytokine-induced F-actin reorganization in endothelial cells involves RhoA activation. Am J Physiol Renal Physiol. 2009;296(3):F487–495. doi: 10.1152/ajprenal.00112.2008. [DOI] [PMC free article] [PubMed] [Google Scholar]
- 35.Petrache I, Birukova A, Ramirez SI, et al. The role of the microtubules in tumor necrosis factor-alpha-induced endothelial cell permeability. Am J Respir Cell Mol Biol. 2003;28(5):574–581. doi: 10.1165/rcmb.2002-0075OC. [DOI] [PubMed] [Google Scholar]
- 36.Wójciak-Stothard B, Entwistle A, Garg R, et al. Regulation of TNF-alpha-induced reorganization of the actin cytoskeleton and cell-cell junctions by Rho, Rac, and Cdc42 in human endothelial cells. J Cell Physiol. 1998;176(1):150–165. doi: 10.1002/(SICI)1097-4652(199807)176:1<150::AID-JCP17>3.0.CO;2-B. [DOI] [PubMed] [Google Scholar]
- 37.Attard P. Measurement and interpretation of elastic and viscoelastic properties with the atomic force microscope. J Phys Condens Matter. 2007;19:473201. [Google Scholar]
- 38.Old LJ. Tumor necrosis factor (TNF) Science. 1985;230(4726):630–632. doi: 10.1126/science.2413547. [DOI] [PubMed] [Google Scholar]
- 39.Pennica D, Nedwin GE, Hayflick JS, et al. Human tumour necrosis factor: precursor structure, expression and homology to lymphotoxin. Nature. 1984;312(5996):724–729. doi: 10.1038/312724a0. [DOI] [PubMed] [Google Scholar]
- 40.Lejeune FJ, Liénard D, Matter M, et al. Efficiency of recombinant human TNF in human cancer therapy. Cancer Immun. 2006;22:6. [PubMed] [Google Scholar]
- 41.Mathur AB, Reichert WM, Truskey GA. Flow and high affinity binding affect the elastic modulus of the nucleus, cell body and the stress fiber of endothelial cells. Ann Biomed Eng. 2007;35(7):1120–1130. doi: 10.1007/s10439-007-9288-8. [DOI] [PubMed] [Google Scholar]
Associated Data
This section collects any data citations, data availability statements, or supplementary materials included in this article.
Supplementary Materials
The measurement of the apparent cell elastic modulus E is influenced by the force applied over the cell membrane, the velocity of the probe, and, consequently, the depth of penetration of the probe. Therefore, a sensitivity analysis was performed on E by varying the indentation force Find between 0.5 and 2 nN and the indentation velocity vind between 0.25 and 0.1 μm/sec. The results of such analysis are summarized in Figure S1 below and confirm the importance of reducing Find and vind for accurately estimating the compressive modulus. The penetration depth in all the experiments was smaller than 200 nm.
The staining of the actin filaments with Alexa Fluor 488 phalloidin was observed over three different planes, namely apical, median, and basal, using confocal fluorescent microscopy. Figure S2a and b show the results for the HUVECs and HCAECs, respectively, in the unstimulated (left columns)and TNF-α stimulated (right columns) conditions. Upon stimulation with TNF-α, the fluorescence intensity associated with the actin filaments increases over the median and apical cell planes.
The increased expression of ICAM-1 molecules upon stimulation with TNF-α is also observed through immunostaining. Figure S3 below shows the immunostaining for ICAM-1 for the three ECs considered.
A sensitivity analysis is presented in Figure S4 below, elucidating the effect of the retracting velocity vret on the force of adhesion and viscoelastic losses for the three ECs considered. It is confirmed that the viscoelastic response of the cell membrane decreases as the retracting velocity reduces.
The apparent elastic modulus E for the three ECs, presented in the bar chart of Figure 2, is explicitly listed in Table S1 below. Results are presented as mean ± SD and the number of repetitions n is also listed
The force of adhesion Fa and the area ratio Av for the three ECs, presented in the bar chart of Figure 5, are explicitly listed in Table S2 below. Results are presented as mean ± SD and the number of repetitions n is also listed..
Figure S1.
Effect of the indenting velocity and force on the apparent elastic modulus (Find = 0.5 and 1.0 nN; vind = 0.25, 0.5, 1.0 μm/s)
Figure S2a.
Actin staining for the HUVECs.
Figure S2b.
Actin staining for the HCAECs.
Figure S3.
Immunostaining for the ICAM-1 molecules.
Figure S4.
Effect of the retracting velocity (vr) on the force of adhesion (Fa = 5 nN; va = 1 μm/s and 40 μm/s).
Table S1.
| Cell type and condition | Apparent elastic modulus [kPa] | ||
|---|---|---|---|
| HUVEC | Unstimulated | n = 42 | 3.44 ± 0.64 |
| TNF-α stimulated | n = 46 | 5.39 ± 0.63 | |
| HCAEC | Unstimulated | n = 20 | 3.07 ± 0.36 |
| TNF-α stimulated | n = 21 | 4.94 ± 0.92 | |
| HPMEC | Unstimulated | n = 38 | 3.42 ± 0.77 |
| TNF-α stimulated | n = 20 | 4.84 ± 0.89 |
Table S2.
| Cell type and condition | Force of adhesion Fa [nN] | Area ratio Av | ||
|---|---|---|---|---|
| HUVEC | Unstimulated | 1.32 ± 0.30 nN | n = 146 | 1.50 ± 0.14 |
| TNF-α stimulated | 0.55 ± 0.22 nN | n = 150 | 1.08 ± 0.22 | |
| HCAEC | Unstimulated | 1.26 ± 0.31 nN | n = 150 | 1.47 ± 0.37 |
| TNF-α stimulated | 0.54 ± 0.17 nN | n = 150 | 1.02 ± 0.13 | |
| HPMEC | Unstimulated | 0.24 ± 0.09 nN | n = 150 | 0.74 ± 0.13 |
| TNF-α stimulated | 0.46 ± 0.09 nN | n = 150 | 0.87 ± 0.10 |