Abstract
In addition to acquiring a better understanding of foods that may have intrinsic health benefits, increasing our knowledge of dietary components that may adversely impact health and wellness, and the levels of consumption at which these adverse effects may occur, should also be an important priority for the Foods for Health initiative. This review discusses the evidence that additional research is needed to determine the adverse effects of consuming added sugars containing fructose. Current guidelines recommend limiting sugar consumption in order to prevent weight gain and promote nutritional adequacy. However recent data suggests that fructose consumption in humans results in increased visceral adiposity, lipid dysregulation, and decreased insulin sensitivity, all of which have been associated with increased risk for cardiovascular disease and type 2 diabetes. A proposed model for the differential effects of fructose and glucose is presented. The only published study to directly compare the effects of fructose with those of commonly consumed dietary sweeteners, high fructose corn syrup and sucrose, indicates that high fructose corn syrup and sucrose increase postprandial triglycerides comparably to pure fructose. Dose-response studies investigating the metabolic effects of prolonged consumption of fructose by itself, and in combination with glucose, on lipid metabolism and insulin sensitivity in both normal weight and overweight/obese subjects are needed.
Keywords: Fructose, glucose, visceral adiposity, insulin sensitivity, cardiovascular disease, postprandial hypertriglyceridemia, small dense low density lipoprotein
Implicit in the Foods for Health Institute goal of improving health and wellness, in addition to discovering new information regarding the health benefits of specific foods and food components, is acquiring a better understanding of foods that may adversely impact health and wellness and the levels of consumption at which these adverse effects may occur. Certainly much progress has been made in the last century toward decreasing the potential for adverse impacts associated with various aspects of safe food handling and processing, food toxins, and food allergies. However, at the same time, advances and growth in both the food processing and food service industries have made available for everyday consumption a staggering array of palatable, but nutrient-deficient foods that are high in fat and sugar.
It has been suggested that consumers choose to buy these foods at the grocery stores over healthier items due to their being more available [1, 2], lower in cost [3], and simply because they are more preferred [4]. Consumption of meals outside of the home has been associated with increased energy, fat and sugar intake [5–7] and strong associations between fast food consumption and BMI have been reported [8–10]. Profit margins are a primary determinant of why restaurants do or do not add and continue to serve healthier food options [11]. Several of the fast food chains have made attempts over the years to include healthier selections in their menus that were lower in fat and sugar, however these options were eventually withdrawn due to consumer preference for the more palatable, higher fat and sugar-containing versions [12, 13]. Since it is likely that high fat and high sugar foods will continue to be widely available, it is important that research be conducted to obtain information regarding the health impact of their specific dietary components, and the levels at which they can be consumed without adversely impacting health. It may be argued that this has already been accomplished. The US Dietary Guidelines, 2002 Dietary References Intakes, and American Heart Association (AHA) Diet and Lifestyle Recommendations provide information based on the results of years of research in which the objectives were identification of the diet(s) to best promote optimal health in the most people and to identify foods that can have an adverse impact on health. The purpose of this review is to discuss the evidence indicating that additional research is needed to achieve these objectives, particularly with regards to the consumption of added sugars containing fructose.
Guidelines for consumption of added sugar
The Institute of Medicine of the National Academies in the 2002 Dietary References Intakes concluded that there was insufficient evidence to set an upper intake level for added sugars since there were not specific adverse health outcomes associated with excessive intake [14]. Therefore, they suggest a maximal intake level of 25% of energy intake from added sugars. The 2005 U.S. Dietary Guidelines recommend a much more conservative level of intake, limiting discretionary calories (which includes both added sugar and solid fat) to 13% of energy requirement [15]. However, the rationale for this restriction consists of prevention of weight gain, dental caries, and nutritional deficiencies. In their Diet and Lifestyle Recommendations Revision 2006, the American Heart Association Nutrition Committee also stated that the primary reasons for reducing the intake of beverages and foods containing added sugars are to lower total calorie intake and promote nutrient adequacy[16].
Recent data on sugar consumption
Recent research suggests that these guidelines and the rationales may need to be re-evaluated. Consumption of sugar-sweetened beverages has been shown to be associated with the development of insulin resistance [17], fatty liver [18], type 2 diabetes [19, 20] and cardiovascular disease [21]. Consumption of a high fructose diet was reported to be associated with smaller LDL particle size in children [22]. Fructose overfeeding caused hepatic insulin resistance, reduced lipid oxidation, and increases triglycerides in healthy male subjects [23, 24]. A more moderate level of fructose decreased expression of glucose transporter, type 4 and increased expression of stearoyl-CoA desaturase-1 in muscle, changes that may represent early molecular markers for dietary fructose-induced insulin resistance in skeletal muscle [25].
Comparing the effects of fructose and glucose consumption
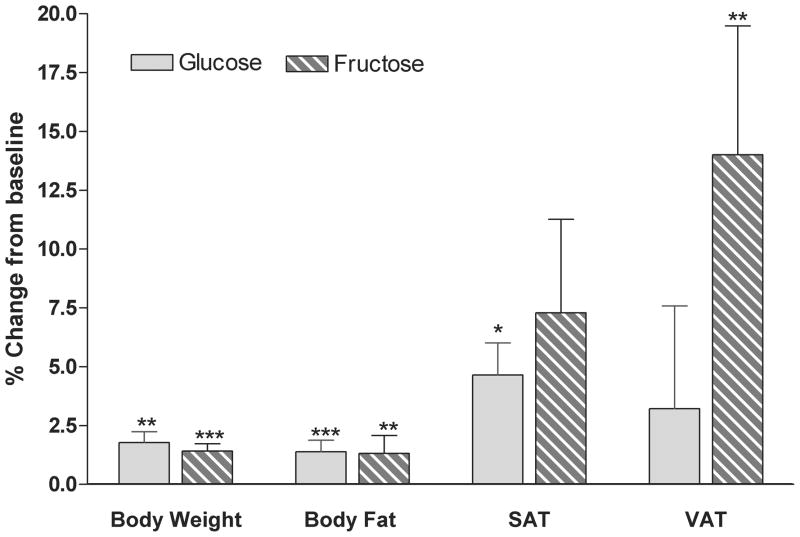
We have recently compared the effects of consuming fructose-sweetened beverages at 25% of energy requirement with those of consuming glucose-sweetened beverages over a 10 week period in older, overweight/obese (BMI: 25–35 kg/m2) adults [26]. For 8 weeks of the 10-week intervention, the subjects lived at home and consumed the sugar-sweetened beverages as 3 servings a day with meals. The only other dietary instructions provided to the subjects during this period were to consume their usual diet ad libitum and to not consume any other sugar-containing beverages. The increases of body weight during this period validate the stated rationale in the US Diet Guidelines and the AHA Recommendations for limiting added sugar intake to avoid weight gain. Both subjects consuming glucose-sweetened beverages and those consuming fructose-sweetened beverages exhibited significant increases of body weight (~1.4 kg) and fat mass (~0.8 kg) (Figure 1). However, despite the comparable weight and fat gain, visceral adipose tissue (VAT) was significantly increased only in subjects consuming fructose, whereas increased adipose deposition in subjects consuming glucose was mainly distributed in subcutaneous adipose tissue (SAT) (Figure 1) [26]. There is considerable data suggesting that visceral adipose deposition is more closely associated with metabolic disease, such as cardiovascular disease and type 2 diabetes, compared with subcutaneous adipose tissue [27].
Figure 1. Body weight and body fat.
Percent changes from baseline of body weight, total body fat measured by dual energy X-ray absorptiometry (DEXA), and SAT and VAT measured by computed tomography (CT) in subjects after 10 weeks of consuming glucose- or fructose- sweetened beverages. *P < 0.05, **P < 0.01, ***P < 0.001 t test 10 wk vs 0 wk. Glucose: n=15; Fructose: n=17. Mean ± SEM. (Data summarized from Stanhope et al, J. Clin. Invest., 2009)
Lipid dysregulation
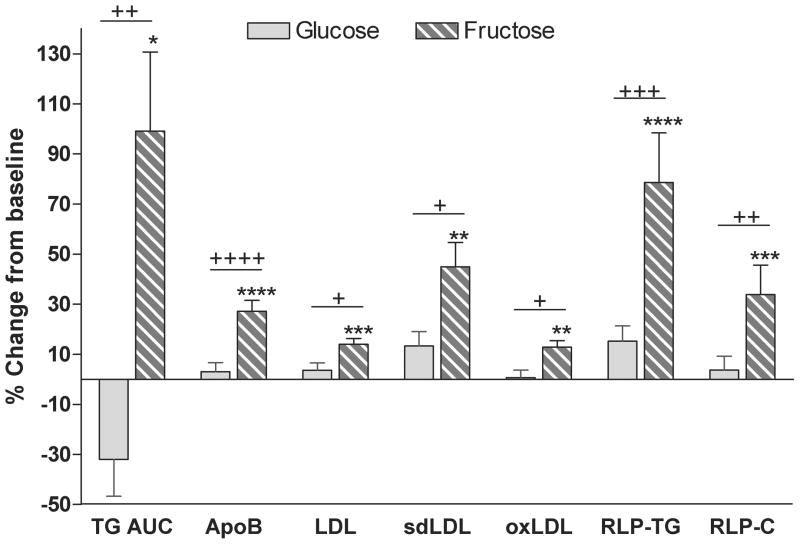
There were a number of other important differences between the effects of fructose and glucose consumption in this study. 24-h postprandial triglyceride (TG) profiles were increased after 10 weeks of fructose consumption, but tended to decrease after glucose consumption. The rate of hepatic de novo lipogenesis (DNL) was higher and postheparin lipoprotein lipase activity (LPL) was lower in subjects consuming fructose compared with those consuming glucose, suggesting that both increased very low density lipoprotein (VLDL) secretion and decreased TG clearance contributed to the effects of fructose to increase postprandial triglycerides. Fasting plasma concentrations of low density lipoprotein (LDL) cholesterol, apolipoprotein B (apoB), small dense LDL (sdLDL), oxidized LDL and postprandial concentrations of remnant-like particle lipoprotein (RLP)-TG and of RLP-cholesterol were also significantly increased in subjects consuming fructose-sweetened beverages, but not in subjects consuming glucose beverages (Figure 2) [26]. These changes may also be associated with increased risk of cardiovascular disease [28–33].
Figure 2. Lipids and lipoproteins.
Percent changes from baseline of 24-h TG AUC, fasting concentrations of apoB, LDL, sdLDL and oxidized (oxLDL), and postprandial concentrations of remnant-like particle lipoprotein (RLP)-TG and RLP-Cholesterol (RLP-C) in subjects after 10 weeks of consuming glucose- or fructose- sweetened beverages. +P < 0.05, ++P < 0.01, +++P < 0.001, ++++P < 0.0001 4-factor (sugar, gender, metabolic syndrome risk factors, time) Mixed Procedures Repeated Measures ANOVA for effect of sugar. *P < 0.05, **P < 0.01,***P < 0.001,****P < 0.0001 Tukey's multiple comparison test 10 wk vs 0 wk. Glucose: n=15; Fructose: n=17. Mean ± SEM. (Data summarized from Stanhope et al, J. Clin. Invest., 2009)
Glucose tolerance and insulin sensitivity
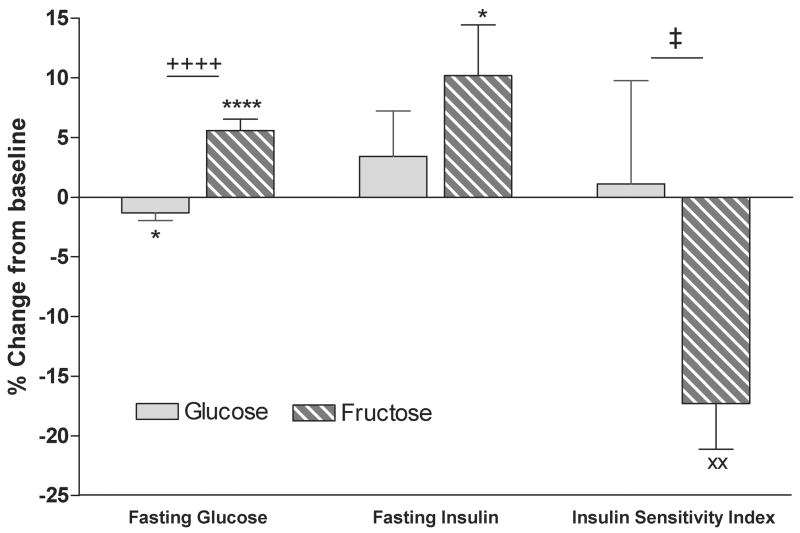
In addition, fasting glucose concentrations decreased significantly in subjects consuming glucose, but increased in subjects consuming fructose. Fasting insulin concentrations were unchanged during glucose consumption, but were increased during consumption of fructose beverages. Insulin sensitivity, as assessed by deuterated glucose disposal [34], was significantly decreased after 10 weeks of fructose consumption, but was unchanged after 10 weeks of glucose consumption (Figure 3) [26].
Figure 3. Glucose tolerance and insulin sensitivity.
Percent change from baseline of fasting glucose and insulin, and insulin sensitivity as assessed by deuterated glucose disposal in subjects after 10 weeks of consuming glucose- or fructose- sweetened beverages. ++++P < 0.0001 4-factor (sugar, gender, metabolic syndrome risk factors, time) Mixed Procedures Repeated Measures ANOVA for effect of sugar. *P < 0.05, ****P < 0.0001 Tukey's multiple comparison test 10 wk vs 0 wk. ‡P < 0.05 3-factor (sugar, gender, metabolic syndrome risk factors) General Linear Model ANOVA for effect of sugar. xxP < 0.01 t test 10 wk vs 0. Glucose: n=15; Fructose: n=17. Mean ± SEM. (Data summarized from Stanhope et al, J, Clin. Invest., 2009)
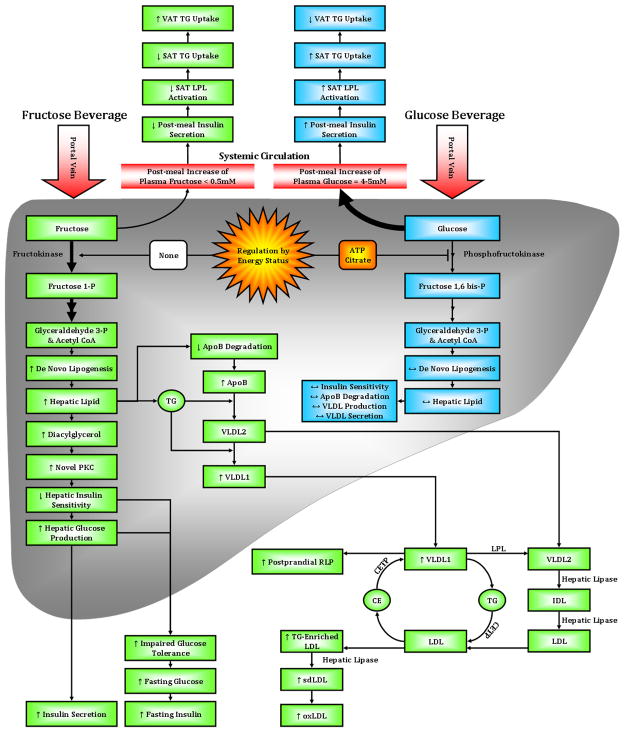
Thus, consumption of 25% of energy requirements from fructose for 10 weeks, results in increased visceral adiposity, lipid dysregulation, and decreased insulin sensitivity, all of which have been associated with increased risk for cardiovascular disease and type 2 diabetes [35]. These adverse effects of fructose consumption cannot be attributed solely to weight gain or positive energy balance, because they were not observed in subjects consuming glucose. As summarized in Figure 4, we have proposed the following model for the the differential effects of fructose and glucose consumption on regional adipose distribution, lipid regulation and insulin sensitivity.
Figure 4.
Proposed pathways and mechanisms underlying the differential effects of fructose compared with glucose consumption on adipose deposition, postprandial lipid metabolism glucose tolerance/insulin sensitivity.
Model – Hepatic fructose and glucose uptake
Hepatic glucose metabolism is regulated by phosphofructokinase, which is inhibited by ATP and citrate when energy status is high, thus limiting hepatic uptake of dietary glucose. This allows much of the glucose arriving via the portal vein to bypass the liver and reach the systemic circulation. Thus, following the consumption of glucose-sweetened beverages with meals, plasma glucose and insulin concentrations increase by 4–5 mM and 70–100 μU/ml, respectively [36–38]. Dietary fructose is largely metabolized via fructokinase, which is not regulated by energy status. This results in greater fructose uptake by the liver with little of the consumed fructose reaching the circulation. Plasma fructose concentrations only increase by 0.2–0.5 mM following consumption of fructose-sweetened beverages with meals [38] (Figure 4). In addition, post-meal increases of plasma glucose and insulin concentrations are substantially lower in subjects consuming fructose, 1–2 mM and 20–30 μU/ml respectively, than in those consuming glucose [36–38].
Insulin-mediated LPL activity and TG uptake
Insulin increases LPL expression and activity, and it has been shown that LPL in SAT is more responsive to the effects of insulin than LPL in VAT [39]. Thus, increases of insulin after consumption of glucose-sweetened beverages with meals leads to greater LPL activity in SAT and increased TG uptake by SAT. Conversely, decreased insulin responses to fructose consumption lead to decreased insulin-mediated LPL activity in SAT, allowing for greater TG uptake by VAT (Figure 4).
DNL and VLDL secretion
In the liver, the unregulated hepatic uptake of fructose results in increased production of the lipogenic substrates, glyceraldehydes 3-P and acetyl CoA, thereby leading to increased DNL. The increased rate of DNL following consumption of fructose generates fatty acids for production of hepatic TG. Increased hepatic lipid is associated with decreased apoB degradation and increased VLDL synthesis and secretion, specifically TG-rich VLDL1 [40]. Increased secretion of VLDL1, reduced LPL activation by insulin, and competition for LPL-mediated TG hydrolysis by chlylomicrons all contribute to a longer VLDL residence time, allowing for augmented lipoprotein remodeling (Figure 4).
Lipoprotein remodeling
Cholesterol ester transfer protein (CETP) is involved in lipoprotein remodeling, and its activity is positively associated with plasma TG levels [41]. CETP exchanges cholesterol ester from LDL with TG from VLDL, resulting in increased postprandial levels of RLP and TG-enriched LDL. The TG-enriched LDL has reduced affinity for the LDL receptor, and therefore a longer residence time in the circulation compared with LDL that has a higher cholesterol ester content [42]. This allows TG-enriched LDL to be hydrolyzed by hepatic lipase, thus generating sdLDL. SdLDL is more easily oxidized than larger LDL particles [32], therefore subjects consuming fructose have increased plasma concentrations of oxidized LDL (Figure 4). After an overnight fast, DNL is no longer elevated and VLDL and chylomicrons remnants have been cleared, and accordingly fasting plasma TG levels are not elevated following fructose consumption. However, fasting apoB and sdLDL concentrations are increased suggesting that in the postprandial state, the increment of plasma apoB levels is associated with VLDL particles, whereas in the fasting state, it is associated with sdLDL. Circulating sdLDL exhibits a distinct diurnal pattern in which sdLDL levels are approximately 30% higher after an overnight fast than during the postprandial period in the late evening [26, 43].
Hepatic insulin resistance
An increase of the hepatic lipid supply may also induce hepatic insulin resistance [44, 45], possibly through increased intrahepatic levels of diacylglycerol, which activates novel-PKC [46, 47]. Novel-PKC decreases tyrosine phosphorylation and/or increases serine phosphorylation of the insulin receptor and IRS-1, resulting in decreased insulin sensitivity, increased hepatic glucose production, and increased fasting glucose and insulin concentrations, and impaired glucose tolerance (Figure 4).
Postprandial glucose and insulin excursions
Much additional research is needed to test this model. The hypothesis that the lowered insulin excursions in response to meals in subjects consuming fructose contribute to increased postprandial TG and reduced TG uptake by SAT and increased uptake by VAT via lowered LPL activity especially merits investigation. Other investigators have proposed that essentially the opposite occurs; i.e., that consumption of high glycemic foods increases the risk of chronic lifestyle-relateddiseases, specifically because they do result in increased postprandial glucose and insulin excursions [48, 49]. It has been suggested that the adverse effects of chronic consumption of sugar-sweetened beverages result from increased circulating glucose and insulin excursions induced by the glucose component of the beverages [50, 51]. Data from our recent studies, which were designed to functionally separate the metabolic effects of fructose from those of glucose [26, 52], provide evidence that any adverse effects associated with drinking commercially available sugar-sweetened beverages (which contain both fructose and glucose), are largely attributable to the fructose component which does not increase postprandial circulating glucose or insulin concentrations [36–38].
High fructose corn syrup, sucrose, fructose & glucose
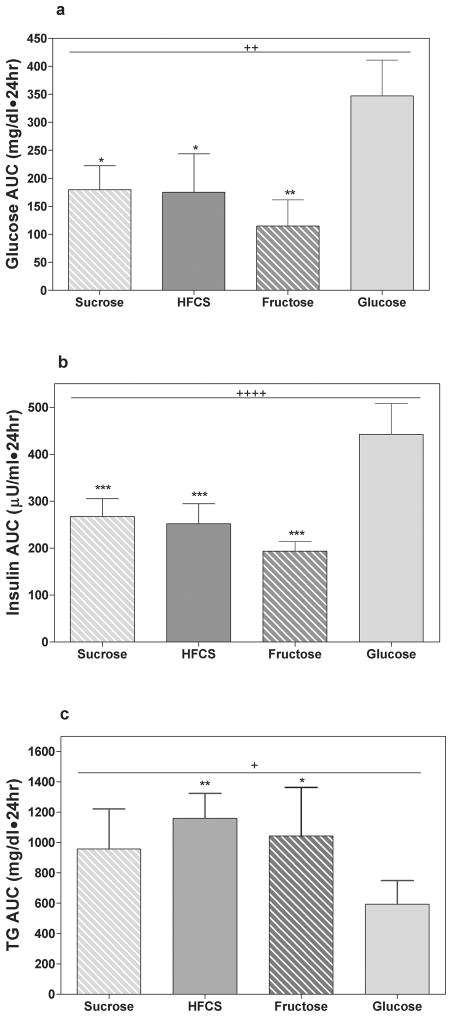
New studies are needed to compare the effects of fructose consumption with the effects of the commonly consumed sweeteners, sucrose and high fructose corn syrup (HFCS). At this time, the only study to directly compare the effects of fructose and glucose with those of HFCS and sucrose is a short-term study conducted by our laboratory. On four different days, 8 male subjects consumed 25% of energy as fructose-, glucose-, HFCS- or sucrose-sweetened beverages with 3 meals and blood samples were collected over 24 hours. As would be expected, when the men consumed HFCS- or sucrose-sweetened beverages, 24-h postprandial glucose and insulin profiles were intermediate to responses induced by pure fructose and pure glucose (Figures 5a & 5b). However, unexpectedly postprandial TG responses to consumption of sucrose and HFCS were comparable to 100% fructose in both peak concentrations and 24-h areas under the curve (Figures 5c). Long-term studies are needed and we are currently conducting a study to compare the 2-week effects of consuming fructose, glucose and HFCS at several different levels on lipid metabolism and insulin sensitivity in a large number of adult men and women, age 18–40 years, BMI 18–35 kg/m2. When these studies are completed, we will have a better understanding of the metabolic effects of consuming fructose by itself, and in combination with glucose, on metabolic outcomes in both normal weight and overweight obese subjects.
Figure 5. Effects of sucrose, HFCS, fructose and glucose consumption.
24-h (A) glucose, (B) insulin, (C) TG area under the curve (AUC) in 8 men consuming sucrose-, HFCS-, fructose- and glucose-sweetened beverages with meals on 4 different days. +P < 0.05, ++P < 0.01, ++++P < 0.0001 Repeated Measures ANOVA. *P < 0.05, **P < 0.01, ***P < 0.001 Bonferroni's multiple comparison test vs glucose. (Data summarized from Stanhope et al, AJCN, 2008)
Acknowledgments
This work was supported in part with research funding from National Institutes of Health grants HL-075675 and HL-091333 and from the U.C., Davis Clinical and Translational Science Center (Grant Number UL1 RR024146) from the National Center for Research Resources (NCRR).
References
- 1.Glanz K, Sallis JF, et al. Nutrition Environment Measures Survey in stores (NEMS-S): development and evaluation. Am J Prev Med. 2007;32:282–9. doi: 10.1016/j.amepre.2006.12.019. [DOI] [PubMed] [Google Scholar]
- 2.Glanz K, Yaroch AL. Strategies for increasing fruit and vegetable intake in grocery stores and communities: policy, pricing, and environmental change. Prev Med. 2004;39(Suppl 2):S75–80. doi: 10.1016/j.ypmed.2004.01.004. [DOI] [PubMed] [Google Scholar]
- 3.Block D, Kouba J. A comparison of the availability and affordability of a market basket in two communities in the Chicago area. Public Health Nutr. 2006;9:837–45. doi: 10.1017/phn2005924. [DOI] [PubMed] [Google Scholar]
- 4.Wang MC, Kim S, et al. Socioeconomic and food-related physical characteristics of the neighbourhood environment are associated with body mass index. J Epidemiol Community Health. 2007;61:491–8. doi: 10.1136/jech.2006.051680. [DOI] [PMC free article] [PubMed] [Google Scholar]
- 5.Kant AK, Graubard BI. Eating out in America, 1987–2000: trends and nutritional correlates. Prev Med. 2004;38:243–9. doi: 10.1016/j.ypmed.2003.10.004. [DOI] [PubMed] [Google Scholar]
- 6.Paeratakul S, Ferdinand DP, et al. Fast-food consumption among US adults and children: dietary and nutrient intake profile. J Am Diet Assoc. 2003;103:1332–8. doi: 10.1016/s0002-8223(03)01086-1. [DOI] [PubMed] [Google Scholar]
- 7.Schmidt M, Affenito SG, et al. Fast-food intake and diet quality in black and white girls: the National Heart, Lung, and Blood Institute Growth and Health Study. Arch Pediatr Adolesc Med. 2005;159:626–31. doi: 10.1001/archpedi.159.7.626. [DOI] [PubMed] [Google Scholar]
- 8.Boutelle KN, Fulkerson JA, et al. Fast food for family meals: relationships with parent and adolescent food intake, home food availability and weight status. Public Health Nutr. 2007;10:16–23. doi: 10.1017/S136898000721794X. [DOI] [PubMed] [Google Scholar]
- 9.French SA, Harnack L, et al. Fast food restaurant use among women in the Pound of Prevention study: dietary, behavioral and demographic correlates. Int J Obes Relat Metab Disord. 2000;24:1353–9. doi: 10.1038/sj.ijo.0801429. [DOI] [PubMed] [Google Scholar]
- 10.Pereira MA, Kartashov AI, et al. Fast-food habits, weight gain, and insulin resistance (the CARDIA study): 15-year prospective analysis. Lancet. 2005;365:36–42. doi: 10.1016/S0140-6736(04)17663-0. [DOI] [PubMed] [Google Scholar]
- 11.Glanz K, Resnicow K, et al. How major restaurant chains plan their menus: the role of profit, demand, and health. Am J Prev Med. 2007;32:383–8. doi: 10.1016/j.amepre.2007.01.003. [DOI] [PubMed] [Google Scholar]
- 12.Edwards C. The Milwaukee Journal Sentinel. 1996. Feb 6, McDonald's low-fat burger dropped due to lean sales. [Google Scholar]
- 13.Papiernik RL. Nation's Restaurant News. 1995. Oct 30, Taco Bell's Border Lights Fails to fatten sales. [Google Scholar]
- 14.Academies IoMotN. Dietary reference intakes for energy, carbohydrate, fiber, fat, fatty acids, cholesterol, protein, and amino acids. Washington, D.C: National Academies Press; 2002. [DOI] [PubMed] [Google Scholar]
- 15.U.S. Department of Health and Human Services, U.S.D.o.A. Dietary Guidelines for Americans 2005. 2005. [Google Scholar]
- 16.Lichtenstein AH, Appel LJ, et al. Diet and lifestyle recommendations revision 2006: a scientific statement from the American Heart Association Nutrition Committee. Circulation. 2006;114:82–96. doi: 10.1161/CIRCULATIONAHA.106.176158. [DOI] [PubMed] [Google Scholar]
- 17.Yoshida M, McKeown NM, et al. Surrogate markers of insulin resistance are associated with consumption of sugar-sweetened drinks and fruit juice in middle and older-aged adults. J Nutr. 2007;137:2121–7. doi: 10.1093/jn/137.9.2121. [DOI] [PubMed] [Google Scholar]
- 18.Assy N, Nasser G, et al. Soft drink consumption linked with fatty liver in the absence of traditional risk factors. Can J Gastroenterol. 2008;22:811–6. doi: 10.1155/2008/810961. [DOI] [PMC free article] [PubMed] [Google Scholar]
- 19.Montonen J, Jarvinen R, et al. Consumption of sweetened beverages and intakes of fructose and glucose predict type 2 diabetes occurrence. J Nutr. 2007;137:1447–54. doi: 10.1093/jn/137.6.1447. [DOI] [PubMed] [Google Scholar]
- 20.Palmer JR, Boggs DA, et al. Sugar-sweetened beverages and incidence of type 2 diabetes mellitus in African American women. Arch Intern Med. 2008;168:1487–92. doi: 10.1001/archinte.168.14.1487. [DOI] [PMC free article] [PubMed] [Google Scholar]
- 21.Dhingra R, Sullivan L, et al. Soft drink consumption and risk of developing cardiometabolic risk factors and the metabolic syndrome in middle-aged adults in the community. Circulation. 2007;116:480–8. doi: 10.1161/CIRCULATIONAHA.107.689935. [DOI] [PubMed] [Google Scholar]
- 22.Aeberli I, Zimmermann MB, et al. Fructose intake is a predictor of LDL particle size in overweight schoolchildren. Am J Clin Nutr. 2007;86:1174–8. doi: 10.1093/ajcn/86.4.1174. [DOI] [PubMed] [Google Scholar]
- 23.Abdel-Sayed A, Binnert C, et al. A high-fructose diet impairs basal and stress-mediated lipid metabolism in healthy male subjects. Br J Nutr. 2008;100:393–9. doi: 10.1017/S000711450789547X. [DOI] [PubMed] [Google Scholar]
- 24.Couchepin C, Le KA, et al. Markedly blunted metabolic effects of fructose in healthy young female subjects compared with male subjects. Diabetes Care. 2008;31:1254–6. doi: 10.2337/dc07-2001. [DOI] [PubMed] [Google Scholar]
- 25.Le KA, Faeh D, et al. Effects of four-week high-fructose diet on gene expression in skeletal muscle of healthy men. Diabetes Metab. 2008;34:82–5. doi: 10.1016/j.diabet.2007.08.004. [DOI] [PubMed] [Google Scholar]
- 26.Stanhope KL, Schwarz JM, et al. Effects of consuming fructose- or glucose-sweetened beverages for 10 weeks on lipids, insulin sensitivity and adiposity. J Clin Invest. 2009 doi: 10.1172/JCI37385. In Press. [DOI] [PMC free article] [PubMed] [Google Scholar]
- 27.Jensen MD. Role of body fat distribution and the metabolic complications of obesity. J Clin Endocrinol Metab. 2008;93:S57–63. doi: 10.1210/jc.2008-1585. [DOI] [PMC free article] [PubMed] [Google Scholar]
- 28.Hyson D, Rutledge JC, et al. Postprandial lipemia and cardiovascular disease. Curr Atheroscler Rep. 2003;5:437–44. doi: 10.1007/s11883-003-0033-y. [DOI] [PubMed] [Google Scholar]
- 29.Matsuura E, Hughes GR, et al. Oxidation of LDL and its clinical implication. Autoimmun Rev. 2008;7:558–66. doi: 10.1016/j.autrev.2008.04.018. [DOI] [PubMed] [Google Scholar]
- 30.Nakajima K, Nakano T, et al. The oxidative modification hypothesis of atherosclerosis: the comparison of atherogenic effects on oxidized LDL and remnant lipoproteins in plasma. Clin Chim Acta. 2006;367:36–47. doi: 10.1016/j.cca.2005.12.013. [DOI] [PubMed] [Google Scholar]
- 31.Olofsson SO, Boren J. Apolipoprotein B: a clinically important apolipoprotein which assembles atherogenic lipoproteins and promotes the development of atherosclerosis. J Intern Med. 2005;258:395–410. doi: 10.1111/j.1365-2796.2005.01556.x. [DOI] [PubMed] [Google Scholar]
- 32.Packard CJ. Small dense low-density lipoprotein and its role as an independent predictor of cardiovascular disease. Curr Opin Lipidol. 2006;17:412–7. doi: 10.1097/01.mol.0000236367.42755.c1. [DOI] [PubMed] [Google Scholar]
- 33.Walldius G, Jungner I. The apoB/apoA-I ratio: a strong, new risk factor for cardiovascular disease and a target for lipid-lowering therapy--a review of the evidence. J Intern Med. 2006;259:493–519. doi: 10.1111/j.1365-2796.2006.01643.x. [DOI] [PubMed] [Google Scholar]
- 34.Beysen C, Murphy EJ, et al. Whole-body glycolysis measured by the deuterated-glucose disposal test correlates highly with insulin resistance in vivo. Diabetes Care. 2007;30:1143–9. doi: 10.2337/dc06-1809. [DOI] [PubMed] [Google Scholar]
- 35.Rader DJ. Effect of insulin resistance, dyslipidemia, and intra-abdominal adiposity on the development of cardiovascular disease and diabetes mellitus. Am J Med. 2007;120:S12–8. doi: 10.1016/j.amjmed.2007.01.003. [DOI] [PubMed] [Google Scholar]
- 36.Stanhope KL, Griffen SC, et al. Twenty-four-hour endocrine and metabolic profiles following consumption of high-fructose corn syrup-, sucrose-, fructose-, and glucose-sweetened beverages with meals. Am J Clin Nutr. 2008;87:1194–203. doi: 10.1093/ajcn/87.5.1194. [DOI] [PMC free article] [PubMed] [Google Scholar]
- 37.Teff KL, Elliott SS, et al. Dietary fructose reduces circulating insulin and leptin, attenuates postprandial suppression of ghrelin, and increases triglycerides in women. J Clin Endocrinol Metab. 2004;89:2963–72. doi: 10.1210/jc.2003-031855. [DOI] [PubMed] [Google Scholar]
- 38.Teff KL, Grudziak J, et al. Endocrine and metabolic effects of consuming fructose- and glucose-sweetened beverages with meals in obese men and women: influence of insulin resistance on plasma triglyceride responses. J Clin Endocrinol Metab. 2009 doi: 10.1210/jc.2008-2192. [DOI] [PMC free article] [PubMed] [Google Scholar]
- 39.Fried SK, Russell CD, et al. Lipoprotein lipase regulation by insulin and glucocorticoid in subcutaneous and omental adipose tissues of obese women and men. J Clin Invest. 1993;92:2191–8. doi: 10.1172/JCI116821. [DOI] [PMC free article] [PubMed] [Google Scholar]
- 40.Adiels M, Taskinen MR, et al. Overproduction of large VLDL particles is driven by increased liver fat content in man. Diabetologia. 2006;49:755–65. doi: 10.1007/s00125-005-0125-z. [DOI] [PubMed] [Google Scholar]
- 41.Chajek T, Fielding CJ. Isolation and characterization of a human serum cholesteryl ester transfer protein. Proc Natl Acad Sci U S A. 1978;75:3445–9. doi: 10.1073/pnas.75.7.3445. [DOI] [PMC free article] [PubMed] [Google Scholar]
- 42.Krauss RM. Dietary and genetic probes of atherogenic dyslipidemia. Arterioscler Thromb Vasc Biol. 2005;25:2265–72. doi: 10.1161/01.ATV.0000186365.73973.f0. [DOI] [PubMed] [Google Scholar]
- 43.Ogita K, Ai M, et al. Circadian rhythm of serum concentration of small dense low-density lipoprotein cholesterol. Clin Chim Acta. 2007;376:96–100. doi: 10.1016/j.cca.2006.07.021. [DOI] [PubMed] [Google Scholar]
- 44.Morino K, Petersen KF, et al. Molecular mechanisms of insulin resistance in humans and their potential links with mitochondrial dysfunction. Diabetes. 2006;55(Suppl 2):S9–S15. doi: 10.2337/db06-S002. [DOI] [PMC free article] [PubMed] [Google Scholar]
- 45.Seppala-Lindroos A, Vehkavaara S, et al. Fat accumulation in the liver is associated with defects in insulin suppression of glucose production and serum free fatty acids independent of obesity in normal men. J Clin Endocrinol Metab. 2002;87:3023–8. doi: 10.1210/jcem.87.7.8638. [DOI] [PubMed] [Google Scholar]
- 46.Nagai Y, Yonemitsu S, et al. The role of peroxisome proliferator-activated receptor gamma coactivator-1 beta in the pathogenesis of fructose-induced insulin resistance. Cell Metab. 2009;9:252–64. doi: 10.1016/j.cmet.2009.01.011. [DOI] [PMC free article] [PubMed] [Google Scholar]
- 47.Samuel VT, Liu ZX, et al. Inhibition of protein kinase Cepsilon prevents hepatic insulin resistance in nonalcoholic fatty liver disease. J Clin Invest. 2007;117:739–45. doi: 10.1172/JCI30400. [DOI] [PMC free article] [PubMed] [Google Scholar]
- 48.Barclay AW, Petocz P, et al. Glycemic index, glycemic load, and chronic disease risk--a meta-analysis of observational studies. Am J Clin Nutr. 2008;87:627–37. doi: 10.1093/ajcn/87.3.627. [DOI] [PubMed] [Google Scholar]
- 49.Radulian G, Rusu E, et al. Metabolic Effects of Low Glycaemic Index Diets. Nutr J. 2009;8:5. doi: 10.1186/1475-2891-8-5. [DOI] [PMC free article] [PubMed] [Google Scholar]
- 50.Ding EL, Malik VS. Convergence of obesity and high glycemic diet on compounding diabetes and cardiovascular risks in modernizing China: An emerging public health dilemma. Global Health. 2008;4:4. doi: 10.1186/1744-8603-4-4. [DOI] [PMC free article] [PubMed] [Google Scholar]
- 51.Harrington S. The role of sugar-sweetened beverage consumption in adolescent obesity: a review of the literature. J Sch Nurs. 2008;24:3–12. doi: 10.1177/10598405080240010201. [DOI] [PubMed] [Google Scholar]
- 52.Swarbrick MM, Stanhope KL, et al. Consumption of fructose-sweetened beverages for 10 weeks increases postprandial triacylglycerol and apolipoprotein-B concentrations in overweight and obese women. Br J Nutr. 2008;100:947–952. doi: 10.1017/S0007114508968252. [DOI] [PMC free article] [PubMed] [Google Scholar]


