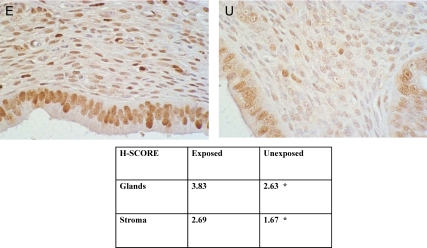
Fig. 7.
Immunohistochemical analysis reveals enhanced expression of PCNA in uterine cells from exposed mice. Top panel, Uterine section from exposed female (E) displayed greater stromal cell expression of PCNA at estrus than unexposed females (U). Bottom panel, H-Score was used to quantify PCNA expression in both endometrial glands and stroma (*, P < 0.03, exposed compared with unexposed).

