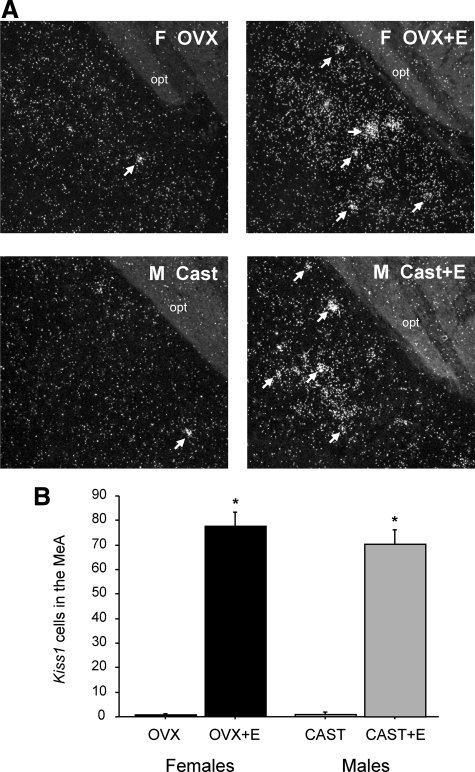
Fig. 5.
A, Representative photomicrographs of Kiss1 in the MeA of male and female mice treated with E2 for 1 wk. B, Mean number of Kiss1 cells in the MeA of male and female mice that were GDX and treated with E2. In each sex, there were more Kiss1 cells in the MeA in E2-treated mice compared with untreated GDX mice. *, Significantly different (P < 0.05) from GDX control in same sex. Cast, Castrated; opt, optic tract; OVX, ovariectomized.

