Abstract
The use of different scanners, acquisition protocols, and reconstruction algorithms has been identified as a problem that limits the use of PET in multicenter trials. The aim of this project was to aid standardization of data collection by developing a quality assurance method for measuring the spatial resolution achieved with clinical imaging protocols.
Methods
A commercially available 68Ge cylinder phantom (diameter, 20 cm) with a uniform activity concentration was positioned in the center of the PET field of view, and an image was acquired using typical clinical parameters. Spatial resolution was measured by artificially generating an object function (O) with uniform activity within a 20-cm-diameter cylinder, assuming no noise and perfect spatial resolution, centered on the original image (I); dividing F[I] by F[O], where F indicates a 2-dimensional Fourier transform, to produce a modulation transfer function; and taking the inverse Fourier transform of the modulation transfer function to produce a point-spread function in image space. The method was validated using data acquired on 4 different commercial PET systems.
Results
Spatial resolution on the Discovery LS was measured at 5.75 ±0.58 mm, compared with 5.54 ±0.19 mm from separate point source measurements. Variability of the resolution measurements differed between scanners and protocols, but the typical SD was approximately 0.15 mm when iterative reconstruction was used. The potential for predicting resolution recovery coefficients for small objects was also demonstrated.
Conclusion
The proposed method does not require elaborate phantom preparation and is practical to perform, and data analysis is fully automated. This approach is useful for evaluating clinical reconstruction protocols across varying scanners and reconstruction algorithms and should greatly aid standardization of data collection between centers.
Keywords: spatial resolution, quality assurance, multicenter trials, PET
Pet has great potential to be used in multicenter clinical trials to provide functional or molecular information that can serve as a marker of the effectiveness of cancer treatment. However, a lack of standardized acquisition protocols has been identified as a problem that currently limits this potential (1). Some of the variability between centers is due to the intrinsically different performance characteristics of the PET systems of different manufacturers, although there is also a significant component that can be attributed to operator-related factors, such as scanner calibration error and inconsistent selection of reconstruction parameters. Although the best possible spatial resolutions that can be achieved by modern commercial PET systems are often quite similar, these values are not usually realized in clinical practice because of the requirement to suppress image noise. Noise suppression is controlled by several different reconstruction and filter parameters and is obtained at the expense of degrading spatial resolution. The resolution that is achieved in clinical images is therefore dependent on the choice of reconstruction parameters, and a degree of variability exists between sites.
In an effort to standardize data collection, multicenter clinical trials (2) often require submission of cylinder phantom images as a prerequisite for study participation. These images, which should be reconstructed with the same protocol used for patient studies, are used to assess quantitative accuracy and other potential technical problems. No information about spatial resolution is obtained from these cylinder images, although such information would be extremely useful. Spatial resolution is generally measured with a small point source placed at various positions within the field of view (FOV) (3). Images are reconstructed, and the full width at half maximum (FWHM) of the resulting point-spread functions (PSFs) is measured. This procedure is not trivial, and trial organizers usually do not require such measurements because they may limit study participation. A method for measuring spatial resolution from cylinder phantom images would require little extra effort on the part of the participating site yet would provide important additional information that could be used to standardize data collection.
In this article, we propose and validate an analysis protocol that can be used to estimate spatial resolution from images of routinely available uniform cylinder phantoms. An important consideration was that the new method should be practical to perform and applicable to all scanner models. Transverse spatial resolution was assessed by measuring the extent of the blurring around the edge of the phantom in each of the transaxial images. This method assumed that the cylinder phantom was centrally located, had a sharp discontinuity at the edge, and that the blur observed in the images was a measure of the spatial resolution in the radial direction. This article describes the proposed method and evaluates its performance over a range of conditions.
MATERIALS AND METHODS
Data Acquisition
Our method involves acquiring images of a conventional cylinder phantom. In the present study, we used a commercially available phantom that consisted of a mixture of 68Ge uniformly distributed in resin. 68Ge has a 271-d half-life and decays to the positron emitter 68Ga. Such phantoms do not require any special preparation and can be reused from day to day, providing a consistent test object that differs only because of radioactive decay. The radioactive portion of the phantom (Sanders Medical Products) used in the present study had a diameter of 20.0 cm, a length of 19.0 cm, and a linear attenuation coefficient of 0.1029 cm−1 for 511-keV photons. The average CT Hounsfield number was 59.6 ±0.7 (mean ±SD). During the time over which data were acquired, the phantom had an activity concentration of 5–10 kBq/mL and a total activity of 30–60 MBq. The method is applicable to all scanner designs but was evaluated using data acquired on systems from GE Healthcare (Advance (4), Discovery LS, and Discovery RX (5)) and from Siemens Medical Solutions (ECAT HRRT dedicated brain PET scanner (6)).
The 68Ge cylinder was placed in a standard phantom holder mounted on the end of the bed of the scanner so that the axis of the phantom was parallel to the z-axis of the tomograph (Fig. 1). The positioning lasers of the scanner were used to center the phantom in the transverse and axial FOVs, and a CT scout image was also used where available. A single-bed-position emission scan was obtained for 15 min, a time that is typical for quality assurance studies of this kind (7). The acquisition and reconstruction parameters were slightly different for the 4 scanners used in this study because of the different capabilities of each system. However, they were held constant for a particular scanner to allow comparisons over time. Measured transmission data (either 137Cs, 68Ge, or CT, depending on the scanner) were used to attenuation-correct the emission datasets. Images were reconstructed into a 256 × 256 matrix to have approximately 1-mm pixels. The remaining parameters were selected so they were similar to those used for clinical studies. Unless stated otherwise in the text, the parameters shown in Table 1 were used. After reconstruction, the phantom images were transferred from the scanner console to a picture-archiving and communication system. These data were then analyzed using specially developed software running under IDL (ITT Visual Information Solutions) on a standard desktop computer.
FIGURE 1.
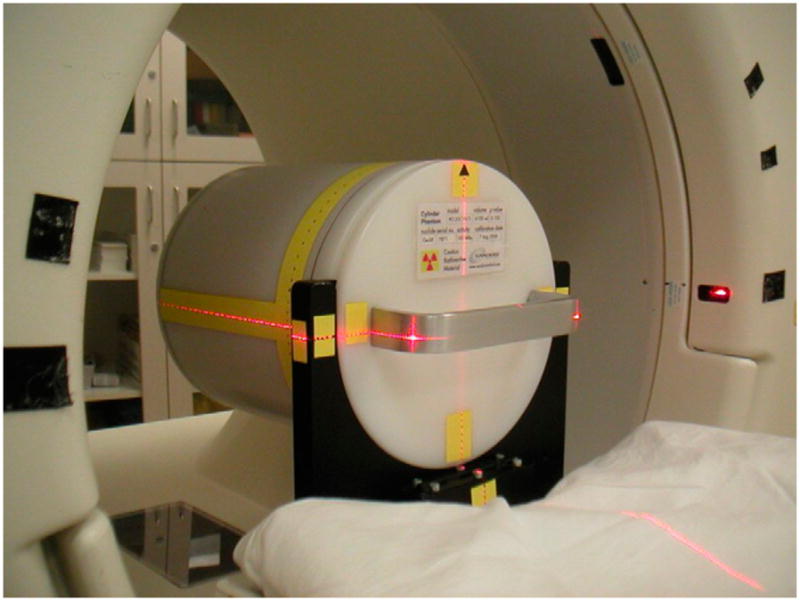
Cylindric 68Ge phantom was centered within FOV using scanner’s alignment lasers.
TABLE 1.
Default Acquisition and Processing Parameters Used in This Study
| Parameter | Discovery RX | Discovery LS | Advance | HRRT |
|---|---|---|---|---|
| Attenuation correction | 64-slice CT | 4-slice CT | 68Ge pin | 137Cs point |
| Scatter correction | Bergstrom (2D), single-scatter simulation (3D) | Bergstrom (2D), single-scatter simulation (3D) | Bergstrom (2D), single-scatter simulation (3D) | Single-scatter simulation |
| Randoms correction | Singles | Delayed events | Delayed events | Singles |
| Reconstruction algorithm | OSEM (2D), 3D OSEM (3D) | OSEM (2D), 3DRP (3D) | OSEM (2D), 3DRP (3D) | 3D OSEM |
| Reconstruction parameters | 2 iterations and 21 subsets (2D), 2 iterations and 21 subsets (3D) | 2 iterations and 21 subsets (2D); transaxial ramp, 4.0 mm (3D) | 2 iterations and 21 subsets (2D); transaxial ramp, 4.0 mm (3D) | 6 iterations and 16 subsets |
| Axial filter | Standard (2D), standard (3D) | Yes (2D); axial ramp, 8.5 mm (3D) | Yes (2D); axial ramp, 8.5 mm (3D) | None |
| Postprocessing filter (mm) | 5 (2D), 5 (3D) | 5 (2D), None (3D) | 5 (2D), None (3D) | 2 |
| Pixel size (mm) | 1 | 1 | 1 | 1.22 |
| Slice thickness (mm) | 3.27 | 4.25 | 4.25 | 1.22 |
Data Analysis
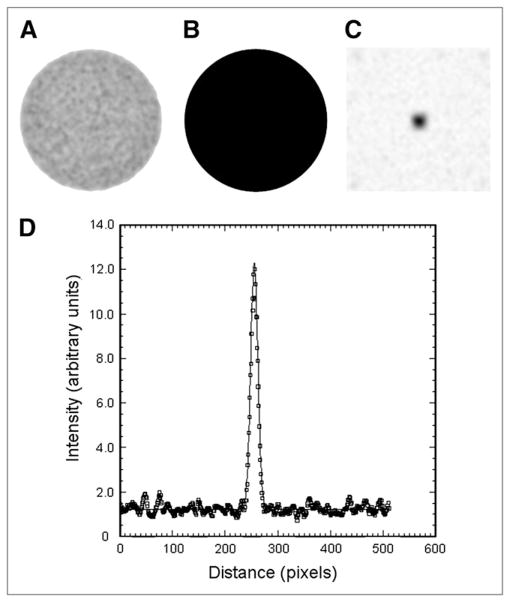
Circular regions of interest (ROIs; diameter, 20 cm) were used to measure spatial resolution. This ROI size was chosen to exactly match the known diameter of the radioactive portion of the cylinder phantom. The locations of the ROIs were automatically determined to be centered in the middle of the phantom in each slice. These 20-cm ROIs were used to create a secondary image volume in which all pixels within the ROI were assigned a value of 1, and all pixels outside were assigned a value of 0. In this way, an additional binary image was created that was spatially aligned with the original image volume but had perfect spatial resolution and no image noise (Fig. 2B). Both the original image and the binary image had the same matrix size and included surrounding pixels that extended beyond the edges of the phantom. We denote the original image I and the binary image, or object function, O, and we assume the two are related by a PSF.
FIGURE 2.
Measured image I (A), object function O (B), derived PSF (C), and profile through PSF image (D) showing results of 2D gaussian fit (solid line).
| Eq. 1 |
where ⊗ indicates 2-dimensional (2D) convolution. PSF is an unknown 2D function that characterizes the system spatial resolution in the transaxial plane (radial direction) and is dependent on several factors including positron range, noncolinearity of annihilation photons, detector material and size, and image reconstruction parameters.
To measure PSF, linear interpolation was used to rebin both I and O from their original 256 × 256 matrix size to a larger 512 × 512 array to produce a 0.5-mm sampling interval. Each slice of the 2 image volumes was 2D Fourier transformed, and data from corresponding slices of I were divided by O in the Fourier domain. The resulting data were inverse Fourier transformed to produce a PSF in real space.
| Eq. 2 |
where F indicates the 2D Fourier transform and F−1 indicates the inverse 2D Fourier transform. Spatial resolution was characterized by fitting a 2D gaussian function to the PSF image (Fig. 2D) and reporting the FWHM of the fitted function. The method was made particularly robust with respect to noise by averaging the PSF images for all slices before performing a single 2D gaussian fit. This approach not only reduced statistical noise but also suppressed parallel line artifacts that occasionally appeared in the PSF images as a result of dividing noisy data in Fourier space. For particularly noisy data, these artifacts may occur in more than 1 slice but, as the orientation of the lines appeared to be random, taking the average of all slices effectively suppressed this effect.
Method Evaluation
The proposed method of measuring transverse spatial resolution was compared with the more conventional approach using small point sources (3). 18F point sources (n = 4), less than 1 mm in all 3 dimensions, were prepared and positioned in air, 10 cm from the center of the FOV. A distance of 10 cm has been recommended (3) and is appropriate for comparison with a centrally located cylinder with a radius of 10 cm. Data were acquired on the Discovery LS in 3-dimensional (3D) mode. Images were reconstructed using the 3D reprojection (3DRP) algorithm (9), with a unapodized ramp filter and a 0.5-mm pixel size. The FWHM was measured in both the radial and the tangential directions, although only the radial direction is appropriate for comparison with the cylinder method, which has no capability to measure tangntial resolution in the present implementation. These data were compared with the spatial resolution estimates obtained using the cylinder method (n = 29). For consistency with the point source measurements, the cylinder images were reconstructed with the same algorithm and filter parameters (Table 1).
Next we tested the extent to which the proposed method could measure spatial resolution when different levels of postreconstruction smoothing were applied. A 2D gaussian filter would be expected to combine with the unsmoothed image in quadrature such that:
| Eq. 3 |
where FWHMMEASURED is the overall system FWHM and is the quantity measured using the cylinder method, FWHMFILTER is the FWHM of the postreconstruction gaussian filter function, and FWHMNO_SMOOTHING is the FWHM of the image in the absence of any smoothing. The same 2D sinogram was acquired on the Advance and used to reconstruct 8 different cylinder images. All reconstructions used ordered-subset expectation maximization (OSEM; 2 iterations, 21 subsets), but different postreconstruction gaussian smoothing filters were applied: FWHMFILTER = 0, 2, 3, 4, 5, 6, 7, and 8 mm. The proposed method was used to measure the spatial resolution (FWHMMEASURED) for each image and was compared with the known postreconstruction smoothing filter (FWHMFILTER).
Our typical protocol involved a 15-min emission acquisition. However, to evaluate the method over a range of noise levels, a series of acquisitions was performed with a predetermined number of counts, as opposed to a predetermined scan duration. Data were acquired on the Advance in 2D mode to have a total of 1, 2.5, 5, 10, 20, 30, 40, and 50 million true (plus scattered) coincidence events in each acquisition. Spatial resolution was measured using the proposed method, and its behavior was studied as a function of the total counts, N.
To assess performance over time, multiple measurements of spatial resolution were made over a 6-mo period as the phantom decayed. Data were acquired on the HRRT (3D mode), Discovery RX (2D and 3D modes), and Discovery LS (2D and 3D modes). The activity in the phantom fell from approximately 57.5 to approximately 34.5 MBq over this period. To further assess the dependence of the method on phantom activity, an additional cylinder phantom was used. This phantom was identical in all respects to the previously described phantom except that at the time of the experiment it had a total activity of 178 MBq.
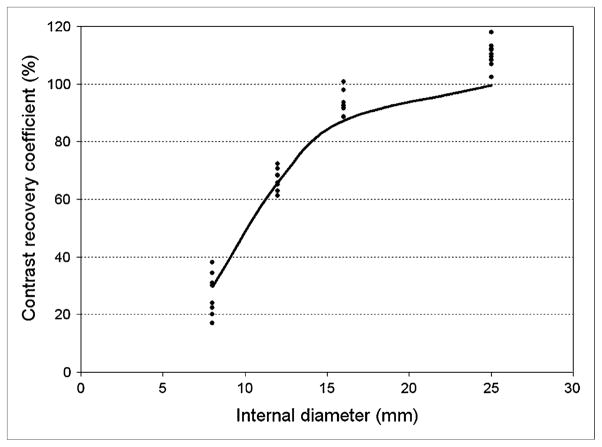
Finally, we assessed the extent to which the above spatial resolution measurements could be used to predict resolution recovery in an extended phantom. The Esser phantom (ACR) with 4 cylindric inserts was prepared to have a 2.5:1 source-to-background ratio. The cylindric inserts had internal diameters of 8, 12, 16, and 25 mm; each insert was mounted within the phantom at a distance of 67 mm from the center; the walls of the inserts were 1.5-mm thick; and each insert extended for 38 mm in the z-direction of the scanner. The long, cylindric shape of the inserts was deliberately chosen to minimize the effect of axial resolution, which is not measured in the current implementation of our method. This phantom was prepared on 9 separate occasions, and replicate experiments were performed with the Discovery RX in 2D mode. Images were reconstructed using OSEM (2 iterations, 21 subsets; 5-mm postreconstruction gaussian filter) and a 4.69-mm pixel size. All other parameters were the same as those in Table 1. Contrast recovery was determined using the following equation:
| Eq. 4 |
where CH is the image-derived activity concentration in the maximum pixel within the hot insert, CB is the activity concentration in the image background region, aH is the insert activity concentration measured with the dose calibrator, and aB is the background activity concentration measured with the dose calibrator. Experimentally determined contrast-recovery coefficients were compared with simulated data, derived using measurements of the spatial resolution made with the cylinder method.
Transverse spatial resolution measurements determined using the cylinder method were related to resolution recovery coefficients using the following procedure. Simulated transverse images (0.5-mm pixel size) were analytically generated with perfect spatial resolution and no noise. The inserts of the Esser phantom were simulated as disks (internal diameter, 8, 12, 16, and 25 mm) of uniform activity within a uniform background. A 2.5:1 source–to–background activity concentration ratio was chosen to match the experimental situation. The 1.5-mm-thick walls of the phantom inserts were simulated as rings of zero activity in the transverse plane. This simulated image was filtered using a 2D gaussian function with a FWHM set to match the (radial) FWHM measured by the cylinder method. Contrast recovery was determined in a way similar to how the experimental data were determined, by placing a 4.5 × 4.5 mm ROI over the highest part of the smoothed image to simulate the 4.69-mm pixels used in the phantom images.
RESULTS
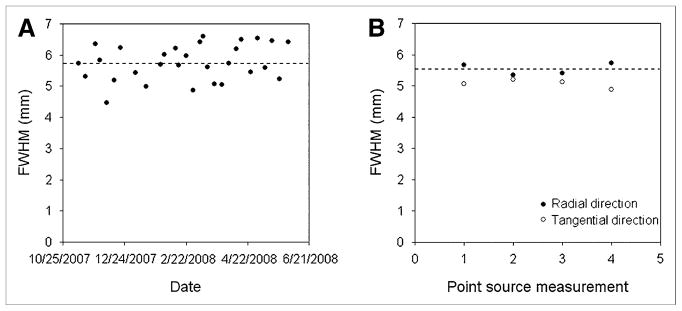
Figure 3 shows measurements of transverse spatial resolution obtained using the cylinder and conventional point source methods. The mean FWHM obtained with the cylinder and point source methods were in close agreement: 5.75 ±0.58 mm for the cylinder method and 5.54 ±0.19 mm for the point source method (radial direction). The FWHM in the tangential direction was 5.06 ±0.13 mm with the point source method.
FIGURE 3.
Transverse spatial resolution measured using cylinder method (A) and conventional point source method (B). Dashed line indicates average radial FWHM in each case: 5.75 ±0.58 mm in A and 5.54 ±0.19 mm in B. Images were reconstructed from data acquired on Discovery LS in 3 dimensions, using same analytic 3DRP reconstruction algorithm and unapodized filter.
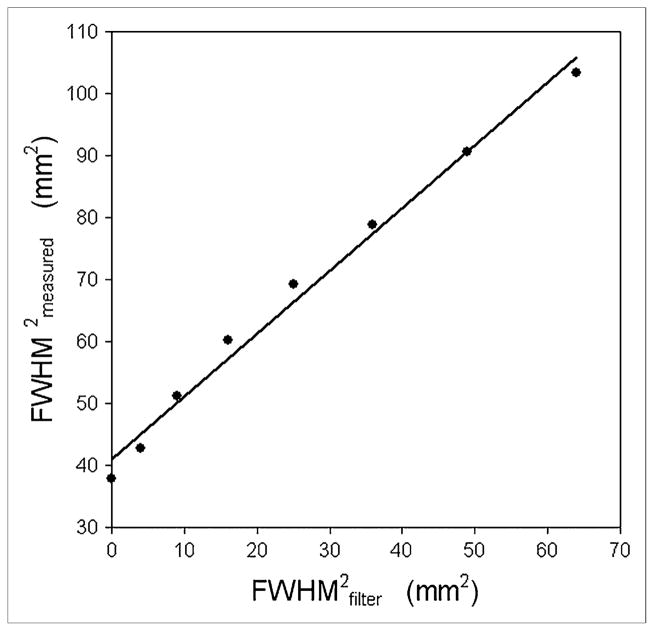
Figure 4 shows how the measured FWHM of the cylinder images increased as the FWHM of the postreconstruction smoothing filter increased. A linear fit to the data had the form: . The slope of the line is approximately equal to 1, suggesting that results from the cylinder method are behaving as predicted by Equation 3.
FIGURE 4.
Eight different images were reconstructed from single 2D sinogram acquired on Advance. Images were reconstructed with OSEM (2 iterations, 21 subsets) and 8 different postreconstruction gaussian filters (FWHMFILTER = 0, 2, 3, 4, 5, 6, 7, and 8 mm). Plot of square of measured FWHM vs. square of FWHM of postreconstruction gaussian filter is shown. Solid line represents linear fit to data and indicates that proposed measurement technique accurately tracked predictable changes in spatial resolution.
Figure 5 shows the effect of image noise on the measured FWHM of the cylinder images. The mean FWHM over all images (different noise levels) was 8.87 mm, and the SD was 0.26 mm (2.9% of the mean). The maximum and minimum FWHM values were 9.22 and 8.55 mm, respectively. These extreme data points differ from the mean by less than 4%.
FIGURE 5.
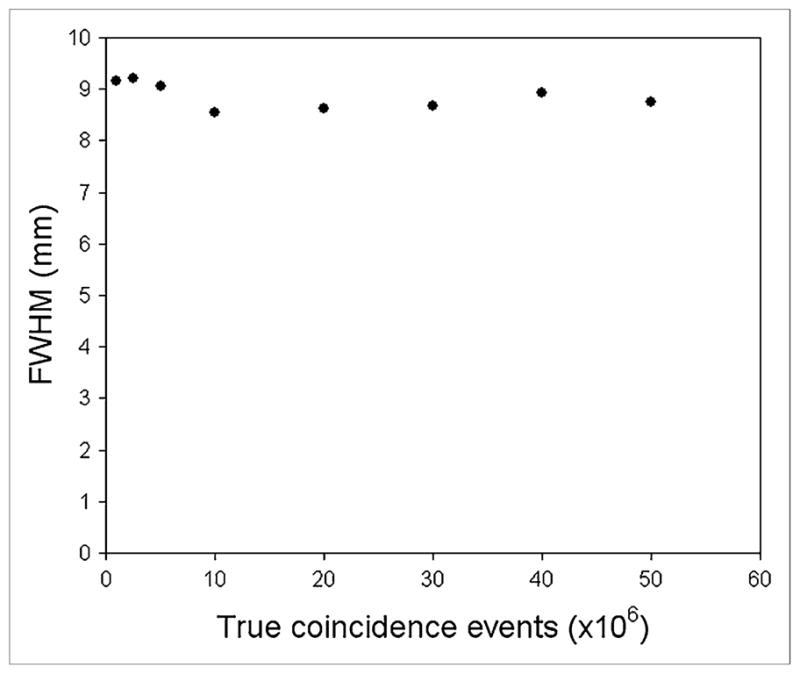
Transverse spatial resolution measured using cylinder method for images reconstructed from 1, 2.5, 5, 10, 20, 30, 40, and 50 million true counts. Data acquired on Advance in 2 dimensions and reconstructed with OSEM (2 iterations, 21 subsets; 5-mm postreconstruction gaussian filter).
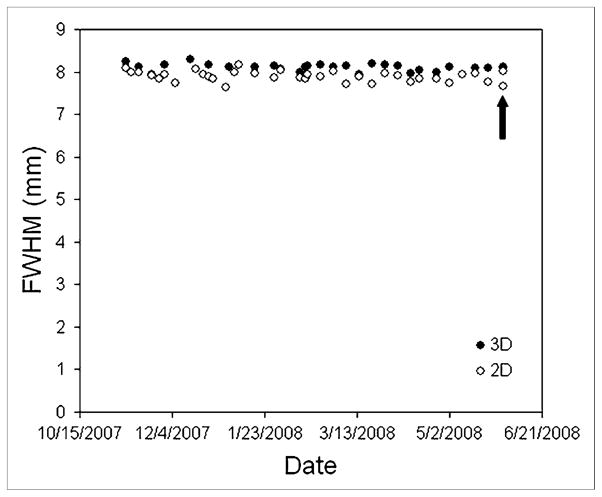
Figure 6 shows spatial resolution measurements made over a 6-mo period on the Discovery RX in both 2D and 3D acquisition modes. Although the phantom activity fell by a factor of 0.6 over this period, the measured FWHM did not change significantly. The arrow in Figure 6 indicates an occasion when the experiment was repeated twice on the same day: once with the original phantom used for all prior measurements and once with a higher-activity phantom (178 MBq). The data obtained with the higher-activity phantom (8.0 mm in 2D; 8.1 mm in 3D) were similar to the average of the previous measurements made with the original phantom (7.9 ±0.1 mm in 2D; 8.1 ±0.1 mm in 3D).
FIGURE 6.
Spatial resolution in both 2D and 3D images, measured over 6-mo period on Discovery RX using typical clinical reconstruction parameters (2D and 3D OSEM, 2 iterations, 21 subsets, 5-mm postreconstruction gaussian filter). Arrow indicates occasion when experiment was repeated twice: once with original phantom and once with higher-activity phantom. This resulted in 4 data points (two 2D and two 3D), although two 3D measurements are not distinguishable.
Table 2 shows the variability of the resolution measurement in terms of the SD derived from repeated measurements. The SD was dependent on the scanner, acquisition mode, reconstruction algorithm, and degree of smoothing. The average SD for the 4 protocols that involved iterative image reconstruction (Discovery RX 2D, Discovery RX 3D, Discovery LS 2D, and HRRT) was 0.15 mm.
TABLE 2.
Mean and SD of Spatial Resolution Measurements Derived from Repeated Cylinder Acquisitions
| Scanner | Acquisition mode | Mean FWHM (mm) | SD of FWHM (mm) | Reconstruction parameter |
|---|---|---|---|---|
| Discovery RX | 2D | 7.89 (n =35) | 0.12 | OSEM; 2 iterations, 21 subsets; 5-mm gaussian filter |
| Discovery RX | 3D | 8.10 (n =28) | 0.09 | 3D OSEM; 2 iterations, 21 subsets; 5-mm gaussian filter |
| Discovery LS | 2D | 8.54 (n =30) | 0.16 | OSEM; 2 iterations, 21 subsets; 5-mm gaussian filter |
| Discovery LS | 3D | 5.75 (n =29) | 0.58 | 3DRP; transaxial ramp, 4 mm |
| HRRT | 3D | 4.48 (n =19) | 0.24 | 3D OSEM; 6 iterations, 16 subsets; 2-mm gaussian filter |
Figure 7 shows contrast-recovery coefficients obtained from 9 replicate experiments with the Esser phantom. The solid line indicates simulated data obtained using the known dimensions of the phantom and a 7.9 mm FWHM gaussian function that was selected to match the measured resolution for this scanner and reconstruction protocol (Fig. 6; Table 2). The experimental contrast-recovery coefficients exceed 100% for the largest insert because of image noise and our use of the pixel with the maximum activity concentration. Otherwise, close agreement between the experimental and simulated data suggests that resolution measurements obtained using the cylinder method can be used to estimate contrast recovery, at least for this phantom arrangement.
FIGURE 7.
Contrast-recovery measurements obtained from 9 replicate experiments performed with Esser phantom (insert internal diameters, 8, 12, 16, and 25 mm). Images were acquired on Discovery RX in 2D mode and reconstructed with OSEM (2 iterations, 21 subsets; 5-mm postreconstruction gaussian filter). Measured FWHM for this scanner and reconstruction protocol was 7.89 mm from Figure 6 and Table 2. Solid line indicates contrast-recovery coefficients obtained from simulations that used known dimensions of phantom and 7.89-mm gaussian filter.
DISCUSSION
A simple cylinder phantom scan is often required before participation of a PET center in multicenter trials. Indeed, many centers routinely use 68Ge cylinder phantoms to assess detector performance and to check the quantitative accuracy of reconstructed images. In this article, we show that additional, potentially important information regarding spatial resolution can also be obtained from these data. The ability to conveniently characterize the spatial resolution of a particular scanner and reconstruction protocol may help to standardize procedures among institutions. Such standardization is critically important for longitudinal multi-center studies, especially if varying types of equipment are used. Some small multicenter trials have required visual matching of image resolution across participating sites (10), although this nonquantitative approximation may not be adequate for larger studies. Other applications include the evaluation of new software implementations, which is of practical significance because the upgrades of the manufacturers to scanner software sometimes have unexpected consequences for existing protocols.
The proposed measurement protocol is ideal for routine application because the phantom requires no special preparation and is already commercially available. The overall procedure can be completed rapidly, with low radiation exposure to the technologist, and the analysis we have developed is quantitative and fully automated. An additional benefit is that the long half-life means the same phantom can be used repeatedly over many months. The resulting data can be compared over time without the variability introduced when different phantoms are prepared using short-lived isotopes. Of course the method is equally applicable to cylinder phantoms filled with an aqueous mixture of a short-lived isotope such as 18F, and there is no requirement to purchase a 68Ge phantom. The method requires precise knowledge of the diameter of the phantom, and this should be accurately measured for all phantoms used.
Although the new method has proved to be a powerful tool, the spatial resolution measurement has the following limitations that are important to consider. Spatial resolution is measured only in the radial direction, and no information is available in the tangential or axial directions in the current implementation. This lack of information in the axial direction is a significant limitation, although as scanners with thinner slices are introduced, this limitation could potentially be overcome by the partial insertion of the phantom into the FOV. Unlike point sources that can be freely positioned, the proposed method measures resolution at only 1 fixed distance equal to the radius of the phantom. Although the PSF is measured for each transverse plane, we found a significant noise advantage by averaging these data over all axial slices. The small axial variation in spatial resolution was, therefore, not measured in the present implementation. If a 68Ge phantom is used, the resolution measurement is expected to be slightly poorer than corresponding 18F measurements because of the higher maximum energy of the positrons emitted from 68Ga. From a practical point of view, our method requires small pixels (~1 mm in the present study), and this requirement may pose limitations for the retrospective analysis of images reconstructed with larger pixels. Furthermore, as with conventional measurements of spatial resolution, our method will not identify resolution losses that arise when excessively large pixels are used in clinical reconstructions.
Despite these limitations, when the cylinder and point source methods were compared under equivalent conditions (10 cm from the center, radial direction, analytic reconstruction) they produced results that were in close agreement: 5.75 ±0.58 mm for the cylinder method and 5.54 ±0.19 mm for the point source method (Discovery LS in 3D mode). These data were also similar to the value of approximately 5.8 mm reported in the literature (11). Although the cylinder data had relatively high variability (Fig. 3A) because of the unapodized reconstruction filter, the fact that the 2 methods had similar mean values indicates that the new method was not substantially biased with respect to the conventional method. The longer range of the positrons emitted from 68Ga are likely to have been slightly counterbalanced by the different measurement arrangements. The point source method contains a contribution due to the size of the source, whereas the cylinder method does not have this dependence. Measuring spatial resolution from a sharp interface that produces a well-defined edge response function may become increasingly important as the spatial resolution of PET systems improves. Such measurements have been widely investigated in other areas of medical imaging. Examples of this work can be found in CT (12), planar γ-camera imaging (13), and MRI (14). Thomas et al. (15) have reported a related approach involving a phantom with multiple compartments and computer segmentation of SPECT/CT images.
Although good agreement was observed between the resolution measurements derived from the cylinder and conventional point sources, high noise in the cylinder images reconstructed with unapodized 3DRP meant that the new method is not recommended for measuring the limit of the spatial resolution of a system. The cylinder method is, however, well suited to measuring the resolution produced with clinical reconstruction protocols in which noise is typically suppressed. For iterative reconstruction algorithms, this method provides only an index of resolution, not a measurement that is applicable throughout the image. The nonlinear nature of iterative reconstruction algorithms (16) means that spatial resolution is object-dependent and is potentially different in different parts of the image. For this reason, standardized measurement geometries of the sort presented here are of practical importance when comparing clinical reconstruction protocols. It can be envisioned that the method we describe could be used to match the resolution of diverse scanner systems and reconstruction protocols to achieve a greater degree of equivalence. Such an approach may be highly desirable in multicenter PET studies, both qualitative and quantitative.
CONCLUSION
The proposed method provided a convenient way of characterizing the spatial resolution that could be expected for a particular acquisition and processing protocol. Data acquisition involved a conventional cylinder phantom, image analysis was fully automated, and the method was applicable to all scanner models. The ability to conveniently measure the spatial resolution achieved in clinical protocols will aid standardization of data collection among institutions and may help move multicenter PET studies toward greater consistency and quality.
Acknowledgments
We thank Dr. Steve Bacharach for many helpful comments. This work was partly supported by National Cancer Institute (NCI) grant 3P30CA 006973-43S2 (Image Response Assessment Team supplement award).
References
- 1.Hillman BJ, Gatsonis C. The American College of Radiology Imaging Network: clinical trials of diagnostic imaging and image-guided treatment. Semin Oncol. 2008;35:460–469. doi: 10.1053/j.seminoncol.2008.07.010. [DOI] [PMC free article] [PubMed] [Google Scholar]
- 2.Saffer J. Quantification of PET and SPECT biomarkers [abstract] Med Phys. 2007;34:2556. [Google Scholar]
- 3.National Electrical Manufacturers Association. NEMA Standards Publication NU 2-2001. Rosslyn, VA: National Electrical Manufacturers Association; 2001. Performance Measurements of Positron Emission Tomographs. [Google Scholar]
- 4.DeGrado TR, Turkington TG, Williams JJ, Stearns CW, Hoffman JM, Coleman RE. Performance characteristics of a whole-body PET scanner. J Nucl Med. 1994;35:1398–1406. [PubMed] [Google Scholar]
- 5.Kemp BJ, Kim C, Williams JJ, Ganin A, Lowe VJ. NEMA NU 2-2001 performance measurements of an LYSO-based PET/CT system in 2D and 3D acquisition modes. J Nucl Med. 2006;47:1960–1967. [PubMed] [Google Scholar]
- 6.Wienhard K, Schmand M, Casey ME, et al. The ECAT HRRT: performance and first clinical application of the new high resolution research tomograph. IEEE Trans Nucl Sci. 2002;49:104–110. [Google Scholar]
- 7.Nichols KJ, Bacharach SL, Bergmann SR, et al. Instrumentation quality assurance and performance. J Nucl Cardiol. 2006;13:e25–e41. doi: 10.1016/j.nuclcard.2006.08.005. [DOI] [PubMed] [Google Scholar]
- 8.Hudson HM, Larkin RS. Accelerated image reconstruction using ordered subsets of projection data. IEEE Trans Med Imaging. 1994;13:601–609. doi: 10.1109/42.363108. [DOI] [PubMed] [Google Scholar]
- 9.Kinahan PE, Rogers JG. Analytic 3D image reconstruction using all detected events. IEEE Trans Nucl Sci. 1989;36:964–968. [Google Scholar]
- 10.Wahl RL, Siegel BA, Coleman RE, et al. Prospective multicenter study of axillary nodal staging by positron emission tomography in breast cancer: a report of the staging breast cancer with PET Study Group. J Clin Oncol. 2004;22:277–285. doi: 10.1200/JCO.2004.04.148. [DOI] [PubMed] [Google Scholar]
- 11.Lewellen TK, Kohlmyer SG, Miyaoka RS, Kaplan MS, Stearns CW, Schubert SF. Investigation of the performance of the General Electric ADVANCE positron emission tomograph in 3D mode. IEEE Trans Nucl Sci. 1996;43:2199–2206. [Google Scholar]
- 12.Judy PF. The line spread function and modulation transfer function of a computed tomographic scanner. Med Phys. 1976;3:233–236. doi: 10.1118/1.594283. [DOI] [PubMed] [Google Scholar]
- 13.Logan KW, Hickey KA. Gamma camera MTFs from edge response function measurements. Med Phys. 1983;10:361–364. doi: 10.1118/1.595283. [DOI] [PubMed] [Google Scholar]
- 14.Mohapatra SM, Turley JD, Prince JR, Blechinger JC, Wilson DA. Transfer function measurement and analysis for a magnetic resonance imager. Med Phys. 1991;18:1141–1144. doi: 10.1118/1.596622. [DOI] [PubMed] [Google Scholar]
- 15.Thomas MDR, Bailey DL, Livieratos L. A dual modality approach to quantitative quality control in emission tomography. Phys Med Biol. 2005;50:N187–N194. doi: 10.1088/0031-9155/50/15/N03. [DOI] [PubMed] [Google Scholar]
- 16.Liow J-S, Strother SC. The convergence of object dependent resolution in maximum likelihood based tomographic image reconstruction. Phys Med Biol. 1993;38:55–70. doi: 10.1088/0031-9155/38/1/005. [DOI] [PubMed] [Google Scholar]


