

Abstract
Since polyglutamine (polyQ) aggregate formation has been implicated as playing an important role in expanded CAG repeat diseases, it is important to understand the biophysics underlying the initiation of aggregation. Previously we showed that relatively long polyQ peptides aggregate by nucleated growth polymerization and a monomeric critical nucleus. We show here that, over a short repeat length range from Q26 to Q23, the size of the critical nucleus for aggregation increases from monomeric to dimeric to tetrameric. This variation in nucleus size suggests a common duplex anti-parallel β-sheet framework for the nucleus, and further supports the feasibility of an organized monomeric aggregation nucleus for longer polyQ repeat peptides. The data also suggest that a change in aggregation nucleus size may play a role in the pathogenicity of polyQ expansion in this series of familial neurodegenerative diseases.
Genetic expansion of a disease protein's polyglutamine (polyQ) sequence beyond repeat length thresholds in the 35–50 range is the defect underlying a series of expanded CAG repeat diseases including Huntington's disease 1. Amyloid-like neuronal polyQ aggregates are a pathological hallmark of these human neurodegenerative diseases 1,2, and polyQ aggregation rates exhibit a repeat length dependence in vitro 3,4 and in vivo 5. Understanding the physical basis of polyQ aggregation may therefore be a key requirement for understanding the molecular basis of disease. Deducing mechanisms by which amyloid growth is initiated, however, is technically challenging and is sometimes dependent on structural context. For example, we previously reported that simple polyQ sequences with pathological repeat lengths aggregate via a nucleated growth polymerization mechanism with a critical nucleus (n*) of one, without passing through any non-amyloid oligomeric intermediates 6,7. More recently, we found that the earlier reported 8,9 transient appearance of oligomeric aggregates prior to amyloid formation in the aggregation of huntingtin (HTT) N-terminal fragments is due to the ability of the N-terminal 17 amino acid HTTNT sequence to entirely alter the spontaneous aggregation mechanism 10. Similar sequence context effects have been reported for several other polyQ proteins, both model sequences 11,12 and disease proteins 13,14, raising the issue of whether the physical behavior of simple polyQ peptides has any bearing on polyQ pathobiology.
In this paper we describe detailed aggregation kinetics studies of several polyQ-containing sequences that clarify this and other outstanding issues of polyQ biophysical behavior and its relation to disease. We show that the spontaneous aggregation of several disease-related, complex polyQ sequences, in analogy to simple polyQ peptides, is controlled by monomeric nucleus formation, suggesting that results from studies of polyQ model sequences are yielding data relevant to at least some polyQ pathology. We provide a detailed reanalysis of K2Q37K2, and a detailed new analysis of K2Q23K2, both of which confirm the absence of any detectable non-amyloid intermediates in their aggregation pathways. The K2Q37K2 analysis establishes the robustness of the log-log slope value and confirms the previously reported 6 critical nucleus of one. In dramatic contrast, we find the critical nucleus for K2Q23K2 to be four. Furthermore, by examining the intervening repeat length polyQs, we find a very sharp transition from n* = 4 to n* = 1 over the repeat length range Q23 to Q26. The data validates the monomeric nucleation model for long polyQ sequences while suggesting a common folding motif for the critical nuclei for all polyQ peptides in the Q18 to Q47 repeat length range. The modest differences in nucleus size revealed in these studies project huge differences in the aggregation kinetics predicted for different repeat lengths at physiological concentrations.
Results
Flanking sequence effects on polyQ aggregation kinetics
Previously we showed that addition of a polyproline sequence to the C-terminal side of polyQ slows aggregation kinetics but does not change the nucleated growth / monomeric nucleus aggregation mechanism 15. We also showed that placing the same polyproline sequence on the N-terminal side of polyQ changes neither aggregation rates nor mechanism 15. In contrast, we found that the N-terminal 17 amino acids of the huntingtin protein (HTTNT) situated directly adjacent to the polyQ sequence (Fig. 1a, top; Supplementary Fig. 1) dramatically alters the aggregation mechanism and increases the aggregation rate 10. Hydrophobicity reducing mutations within HTTNT, however, lead to partial to complete suppression of its rate-enhancing ability 10,16, suggesting that the rate-acceleration and mechanism-alteration by flanking sequences are far from universal, depending greatly on details of sequence.
Figure 1.

Effect of AT7NT on polyQ aggregation kinetics. a. PONDR analysis of first 600 amino acids of the human HTT and AT7 sequences. Scores between 0.5 and 1 are associated with disorder; scores between 0 and 0.5 with order. The orange bars represent the polyQ sequence; the purple bars the Pro-rich sequence. b. Comparison of aggregation kinetics of peptide AT7NTQ30K2 and K2Q30K2. c. Aggregation kinetics of different concentrations of AT7NTQ30K2. d. Initial aggregation kinetics data of AT7NTQ30K2 from part c plotted against time2. e. Log-log plots of initial reaction rates (from part d) versus initial concentration for AT7NTQ30K2. f. Autocorrelation functions obtained from DLS measurements at different incubation times of the aggregation reaction of AT7NTQ30K2 at 166 μM, along with a histogram of the percent aggregation at the same time points derived from HPLC/sedimentation analysis.
To address whether polyQ flanking sequences from other expanded polyQ disease proteins might impart altered aggregation behavior onto polyQ sequences, we analyzed the impact of the N-terminus of the disease protein ataxin-7 (AT7) 1 on the aggregation of a Q30 sequence. This sequence exhibits interesting similarities and differences with the HTTNT sequence of huntingtin, as brought out by an analysis (Methods) using the disorder predictor PONDR 17 (Fig. 1a). As in HTT, the polyQ sequence of AT7 lies near the N-terminus of the protein and is followed by a short proline-rich sequence leading into a series of predicted ordered elements. As in HTT, the 29 amino acid N-terminal sequence of AT7 (“AT7NT”) leading into the polyQ sequence is predicted to have some tendency towards order (Fig. 1a). However, while the PONDR score of HTTNT is well-below the 0.5 median normally associated with a tendency toward being structured 18, the PONDR score of AT7NT falls above the 0.5 median, suggesting a negligible tendency toward order.
We obtained a peptide consisting of the AT7NT sequence followed by a Q30K2 sequence. In contrast to the huge rate enhancement effect of HTTNT, we found that, at comparable concentrations, AT7NTQ30K2 aggregates somewhat slower than K2Q30K2 (Fig. 1b). In addition, the aggregation kinetics of this peptide exhibited a concentration dependence (Fig. 1c) and linear time2 plots (Fig. 1d) whose rates, as expected for nucleated growth polymerization reactions 19 increase with increasing starting monomer concentration (Fig. 1e). In fact, in good agreement with values obtained previously for simple polyQ peptides 6,7,15,20-22 and in contrast to values obtained for HTTNT-containing polyQ sequences 10, the slope of the log-log plot of time2 slopes vs. starting concentration (Fig. 1e) is 2.7, for an n* value of 0.7 (Table 1). DLS analysis showed no aggregate formation that was not detected by the sedimentation assay (Fig. 1f). Electron micrographs (Fig. 2) of the products of AT7NTQ30K2 aggregation exhibit uniform, smooth-sided fibrils of ∼ 10 nm diameter and no discernable twist (Fig. 2a). Overall, the kinetic aggregation behavior of AT7NTQ30K2 is more like that of simple polyQ peptides, and quite different from that of peptides containing the analogous HTTNT sequence. While HTT N-terminal fragments aggregate via a two-step mechanism that includes non-nucleated, energetically downhill formation of non-amyloid oligomeric intermediates 10, the initial aggregation of AT7NTQ30K2 is nucleated, with direct formation of amyloid aggregates, in analogy to the aggregation of simple polyQ peptides. These results are consistent with previous results 10,15 showing that not all polyQ disease protein flanking sequences alter polyQ aggregation mechanisms and kinetics.
Table 1. Nucleation kinetics analysis on various polyQ peptidesa.
| Peptide | Concentrations examined | Slope | R2 | Slope variationb | n* |
|---|---|---|---|---|---|
| AT7NTQ30K2 | 6 | 2.7 | 0.9806 | 2.61 – 3.23 | 0.7 |
| SFQ37P10K2 | 10 | 3.0 | 0.9852 | 2.92 – 3.08 | 1.0 |
| K2Q37K2 | 9 | 2.7 | 0.9632 | 2.52 – 2.85 | 0.7 |
| K2Q27K2 | 5 | 2.9 | 0.9264 | 2.88 – 3.11 | 0.9 |
| K2Q26K2 | 6 | 2.9 | 0.9850 | 2.77 – 3.17 | 0.9 |
| K2Q25K2 | 7 | 4.0 | 0.9571 | 3.86 – 4.31 | 2.0 |
| K2Q24K2 | 6 | 5.3 | 0.968 | 5.03 – 5.54 | 3.3 |
| K2Q23K2 | 8 | 5.9 | 0.9760 | 5.73 – 6.31 | 3.9 |
| K2Q18K2 | 7 | 5.7 | 0.9793 | 5.44 – 6.04 | 3.7 |
Figure 2.
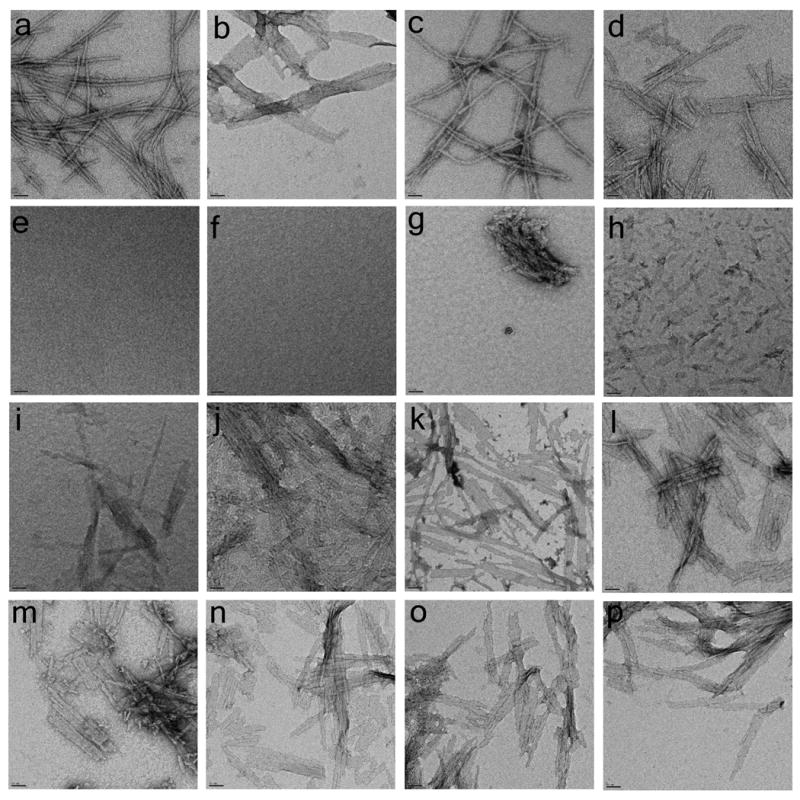
Transmission electron micrograph images obtained for different peptides incubated in PBS at 37°C. Shown are the end-stage aggregates of AT7NTQ30K2 (a), K2Q37K2 (b), HTTNTQ37P10K2 (c), SFQ37P10K2 (d), K2Q18K2 (l), K2Q24K2 (m), K2Q25K2 (n), K2Q26K2 (o), and K2Q27K2 (p). Also shown are representative images from different incubation times of a 215 μM reaction of K2Q23K2 observed at 0 hrs (e), 24 hrs (f, g), 27 hrs (h), 36 hrs (i), 52 hrs (j), and 200 hrs (k). The vast proportion of the EM grid examined for the 24 hrs time point for K2Q23K2 aggregation resembled part f (no visible aggregate). Scale bar = 50 nm.
Even for proteins like HTT that contain a flanking sequence that modifies mechanism, it is possible that proteolytic removal of all or part of the flanking sequence in the cell would generate a polyQ-containing fragment exhibiting the kinetic behavior of simple polyQ sequences. Isolated polyQ sequences are relatively resistant to proteolysis, even by the proteasome 23. In contrast, the HTTNT sequence of HTT is sensitive to trypsin cleavage in monomeric HTT N-terminal fragments to generate a polyQ-containing fragment starting at Ser16 10 that may be biologically relevant (see Discussion). We obtained SFQ37P10K2, the polyQ-containing product of trypsin cleavage of an HTT N-terminal peptide, and studied its aggregation properties. We found that, as expected, removal of the bulk of the HTTNT sequence yields a peptide with aggregation kinetics that are greatly decreased compared with those for the peptide with intact HTTNT (Fig. 3a). The time (Fig. 3b) and time2 (Fig. 3c) plots for the aggregation of SFQ37P10K2 exhibit a clear concentration dependence, as quantified by a log-log plot (Fig. 3d) giving a slope of 3.0, consistent with an n* of 1.0 (Table 1) and hence a monomeric nucleus. This slope of 3.0 is in stark contrast to analogous slopes for HTT N-terminal fragment peptides, which are in the range of one 10. EM images of the SFQ37P10K2 aggregates (Fig. 2d) more resemble the products of simple polyQ aggregation (K2Q37K2, Fig. 2b) than aggregated HTT N-terminal fragments (Fig. 2c). Collectively the data show that biologically feasible cleavage within the HTTNT sequence can produce a polyQ containing fragment whose aggregation properties more resemble those of simple polyQ sequences.
Figure 3.

Aggregation kinetics analysis of the peptide SFQ37P10K2. a. Comparison of aggregation kinetics of HTTNTQ37P10K2, SFQ37P10K2 and K2Q37K2. b. Aggregation kinetics for SFQ37P10K2 at different concentrations. c. Initial aggregation kinetics data of SFQ37P10K2 from part b plotted against time2. d. Log-log plot of initial reaction rates (slopes from part c) versus initial concentration for SFQ37P10K2.
While flanking sequences have been described to play important modulating roles in the in vitro aggregation of some polyQ-containing proteins 10-14, details of the aggregation mechanisms of most polyQ disease proteins remain uncharacterized. PONDR analyses of these sequences shows that, in every case, the polyQ region of the sequence lies within extended segments that are predicted to be unstructured (Supplementary Figure 2). The unstructured nature of these flanking sequences suggests that (a) they may be more sensitive to proteolytic cleavage in the cell and (b) even if not cleaved they will be less likely, because of their low order propensity, to initiate an HTTNT-like oligomerization mechanism.
Technical aspects of polyQ aggregation studies
To establish a benchmark for the studies on short polyQ peptides to be described later, we repeated a previous analysis of the peptide K2Q37K2. This peptide was disaggregated using our normal protocol, and in addition the PBS solution of the peptide was filtered with a 20 nm membrane filter prior to incubation 24 (Methods). The peptide was incubated at 37 °C and aliquots removed and centrifuged, and the supernatant concentration measured by analytical HPLC to determine, by difference, the percent aggregation (Methods). For example, a 20 nm-filtered 25.5 ± 0.5 μM solution of K2Q37K2, exhibiting no detectible DLS signal at t = 0, (Fig. 4a), was incubated. After 16 hrs, the solution continued to exhibit no detectible aggregates by DLS (Fig. 4a), and its concentration after 20 nm filtration was not appreciably changed (Supplementary Table 1). Detectible aggregation of this 25 μM solution was only observed, by the HPLC sedimentation assay, after 50 hrs (Fig. 4b). The aggregation kinetics data (Fig. 4b) yielded linear time2 plots (Fig. 4c) and a linear log-log rate-concentration plot (Fig. 4d) giving a slope of 2.7 (Table 1) corresponding to n* = 0.7 (Table 1). These data were obtained using nine separate starting concentrations to yield a log-log plot with nine data points; the range of slopes obtained by calculating the slope from all possible 8-membered subsets of these data points is 2.52 – 2.85 (Table 1). The n* obtained is identical to the value of 0.7 obtained previously using only four starting concentrations of a monomer preparation that had not been subjected to the 20 nm filtration step 6.
Figure 4.

Aggregation kinetics of peptide K2Q37K2 in PBS at 37°C. a. DLS measurements of the aggregation reaction mixture of K2Q37K2 at 25.5 μM starting concentration at the times indicated. b. Aggregation kinetics for K2Q37K2 at different concentrations. c. Initial aggregation kinetics data of K2Q37K2 from part b plotted against time2. d. Log-log plots of initial reaction rates (slopes from part c) versus initial concentration for K2Q37K2.
Recently, Lee et al. conducted experiments with the peptide K2Q23K2, which was disaggregated by a modification of our published protocol 25, stored frozen at high concentration in pH 3 water, then thawed, diluted, and incubated in PBS at 37 °C at 8–23 μM concentration. Monitoring the reactions by size exclusion chromatography, the authors reported a burst of monomer loss (interpreted as aggregation) equivalent to 30% of total incubated monomer within the first hour of incubation. The authors found that for a 23 μM solution these rapidly formed aggregates at two and six hrs had hydrodynamic radii of about 200 nm and masses of 47 – 126 × 106 Da, but exhibited no regular secondary structure (in particular, no β-sheet) 25. Since this report was not in agreement with our own findings on longer repeat lengths in the K2QNK2 series 6,7,20-22, we investigated the identical K2Q23K2 sequence in our laboratory.
We disaggregated purified K2Q23K2 by our standard protocol 26-28 and immediately incubated the resulting peptide at 52 μM in PBS at 37 °C, monitoring the reaction by the HPLC sedimentation assay. Surprisingly, after up to1400 hrs, no detectible aggregation occurred in this reaction (data not shown). Based on this result, we set up a repeat reaction at a significantly higher concentration of 215 μM, using peptide that, immediately before the initiation of incubation, had been subjected to our standard disaggregation procedure 28 and an additional 20 nm filtration (Methods). DLS analysis showed no detectible particles in this K2Q23K2 solution, either at t = 0 or after 2 hrs incubation (Fig. 5a). The lack of appreciable formation of aggregates was confirmed by 20 nm membrane filtration, which showed that the concentration of filterable peptide after 2 hrs (214.4 ± 2.0 μM) was the same, within error, as the sample before incubation (214.9 ± 2.3 μM). Together these results indicate that aggregate formation after two hours incubation could not be detected by sedimentation assay, DLS or analytical membrane filtration, even though incubated at a starting concentration almost 10 times that previously reported to give 30% aggregation under similar conditions 25.
Figure 5.

DLS analysis of the aggregation reaction of K2Q23K2 at 215 μM. a. Autocorrelation functions obtained on freshly disaggregated and filtered 215 μM solution of K2Q23K2 (0 h) and after 2 hours incubation at 37 °C in PBS. b. Autocorrelation functions on the aggregation reaction of the 2 hours reaction from part a, after first being subjected to a second 20 nm filtration (even though there is no indication of aggregate formation by DLS or by material loss on filtration; see Results). Also shown for this 215 μM reaction is a histogram of the percent aggregation at the same time points derived from HPLC/sedimentation analysis. c. Hydrodynamic radius (Rh) derived from the DLS data in part b at t=27 hrs. d. The DLS data obtained for IgM at different concentrations measured in PBS at 37°C.
After the second membrane filtration of the two hours incubated sample, we incubated the 215 μM solution for an extended period at 37 °C and monitored aggregation by the HPLC sedimentation assay and by DLS. The results (Fig. 5b) show that the earliest detectible aggregate formation by sedimentation assay is at 20–24 hrs, at which times 1–3% of the monomer has been lost. In general agreement with this, the earliest DLS data rising reliably above buffer background is after 20 – 27 hrs incubation (Fig. 5b). At 27 hrs aggregation was at about 5% (Fig. 5b) and consisted of a broad distribution of particles with Rh values centered around 100 nm (Fig. 5c). At 52 hrs, about 42% of monomer has been converted into aggregate (sedimentation assay), and the intensity of the DLS autocorrelation function was high and did not reach baseline, which prevented deconvolution to obtain a size distribution (Fig. 5b). After 52 hrs, monomer continued to disappear from solution (Fig. 5b, gray bars), while the DLS signal became saturated, preventing the recording of data. The sensitivity of the DLS instrument was confirmed using IgM (∼ 1 × 10⁶ Da) as a standard. The IgM data (Fig. 5d) show that it takes a 16 μg/ml solution of IgM to achieve an equal amplitude to that observed when the 215 μM solution of K2Q23K2 was 5% aggregated (i.e., approximately 32 μg/ml aggregates), consistent with the average aggregate at this time being roughly in the size range of IgM (1 × 10⁶ Da).
The absence of non-amyloid aggregates during the lag time of aggregation was confirmed by EM analysis of the same reaction. No aggregates were observed at t = 0 (Fig. 2e). EM images taken at 24 hrs show only a very sparse distribution of aggregates (Fig. 2 f,g; see Fig. 2 legend), and these initially observed aggregates appear to be clusters of smaller versions of the later observed mature aggregates. In the following hours, aggregates remain sparsely distributed but become slightly longer (27 hrs, Fig. 2h), reaching a size range entirely consistent with the DLS result on the same sample (Fig. 5c). At later time points, where the sedimentation assay shows increased aggregation, EM grids are uniformly covered with longer fibrillar aggregates (Fig. 2 i-k). There is no apparent difference in morphology between aggregates of K2Q23K2 (Fig. 2k) and K2Q37K2 (Fig. 2b).
The sources of the discrepancies between these results for K2Q23K2 and the previous report 25 are not clear. Possible factors include differences in the peptide sample, the disaggregation protocol, the handling of disaggregated peptides, and the aggregation buffer. It is clear, in any case, that in our hands aggregation of even very high concentrations of K2Q23K2 is exceedingly slow and proceeds via amyloid-like structures. Not only was the aggregation much, much slower (even at much higher concentration), and of a different quality, than suggested by the results of Lee et al. 25, but aggregation was also much slower than expected based on our previous data for the slightly longer peptide K2Q28K2 6. This surprising result prompted us to take a closer examination of K2Q23K2 aggregation kinetics.
Repeat length dependence of nucleus size
Working in the concentration range 103 – 227 μM, we carried out a concentration dependent aggregation kinetics analysis of K2Q23K2. At 103 μM the peptide aggregates exceeding slowly for the first 120 hrs before beginning to aggregate rapidly (Fig. 6a, black squares). Consistent with a nucleated growth mechanism 29, aggregation of the same concentration of monomer is greatly enhanced in the presence of pre-formed seed (Fig 6a, blue, right pointing triangles). Also consistent with a nucleated growth mechanism 29, aggregation is reversible and exhibits a robust critical concentration of 3 μM (Fig. 6b). This is equivalent to a ΔGelong of − 7.8 kcal/mol, similar to the value of − 8.6 kcal/mol previously reported for Aβ(1–40) fibril formation 30. Consistent with nucleated growth polymerization, the initial phase of the aggregation kinetics exhibits a linear time2 plot at each concentration tested 19 (Fig. 6c). When these time2 rate slopes are plotted vs. starting concentration in a log-log plot (Fig. 6d), the results from the eight data points fit a straight line, as expected 6,19. However, in contrast with the slope values between 2.5 and 3 described above for K2Q37K2 (Fig. 4d, Table 1) and found in every previous examination of simple polyQ sequences 6,7,15,20-22, the slope of this line is 5.9 (Table 1), corresponding to n* = 3.9.
Figure 6.

Kinetic analysis of K2Q23K2 by sedimentation assay. a. Aggregation kinetics of K2Q23K2 at different concentrations. The reaction labeled “103 μM + S” (blue, right-pointing triangles) contains ∼12% by weight of K2Q23K2 aggregate seeds. b. Time course of spontaneous fibril growth at 215 μM K2Q23K2 monomer, and of the dissociation of these fibrils, at 37 °C in PBS. The blue dashed line shows the approximate convergence point at about 3 μM, indicating a position of dynamic equilibrium of the forward and reverse reactions. c. Initial aggregation kinetics data of K2Q23K2 from part a plotted against time2. d. Log-log plots of initial reaction rates (slopes from part c) versus initial concentration for K2Q23K2.
Since the shortest simple polyQ peptide we have ever analyzed was a K2Q28K2 peptide, which also exhibited an n* of about one 6, the value for the Q23 peptide indicated an abrupt change in n* over a relatively short repeat length range. To confirm this and to determine in detail how n* changes with respect to repeat length, we studied the intervening repeat lengths as well as a peptide with a repeat length well under Q23. The detailed kinetics data for these studies are located in Supplementary Figure 3, while the log-log plots are shown in Figure 7 and the slope values and fitting parameters in Table 1.
Figure 7.

Log-log plots of initial reaction rates versus initial concentration. Rate data are from time2 plots (see Supplementary Figure 2). Peptides analyzed are K2Q18K2 (a), K2Q27K2 (b), K2Q26K2 (c), K2Q25K2 (d) and K2Q24K2 (e).
Obtaining useful data for the peptide K2Q18K2 required even higher concentrations (up to over 1 mM) than did the Q23 peptide (Supplementary Figure 3a). After analysis, n* for K2Q18K2 was found to be also in the range of four (Fig. 7a; Table 1). We also examined the kinetics of peptides in the repeat length range Q24–Q27 (Fig. 7; Supplementary Figure 3). We found that, as expected based on our prior examination of K2Q28K2 6, the K2Q27K2 peptide exhibits a monomeric aggregation nucleus (Fig. 7b, Table 1). The Q26 peptide also has n* ∼ 1 (Fig. 7c, Table 1). In contrast, the Q25 peptide exhibits a slope of 4.0 (Fig. 7e) for n* = 2.0. The slope for the K2Q24K2 peptide is 5.3, consistent with an n* of 3.3. The meaning of n* = 3.3 is not clear. The value may indicate a unique critical nucleus of three, or may be an intermediate value between n* = 2 and n* = 4 owing to both dimeric and tetrameric nuclei being operational for this repeat length in this concentration range. Further analysis is required to better understand the nucleation mechanism for K2Q24K2. Regardless of the interpretation of the Q24 data, it is clear there is a tight transition from a tetrameric critical nucleus, through a dimeric critical nucleus, to a monomeric critical nucleus as repeat length increases from Q23 to Q26 (Table 1). The aggregated products of each of these peptides are very similar by EM (Fig. 2k-p) and FTIR (Supplementary Figure 4).
Characteristics of the Q23 aggregation nucleus
To learn more about the K2Q23K2 nucleated growth reaction, we evaluated the second order elongation rate constant and, from it, the nucleation equilibrium constant (Fig. 8). Thus, as previously described for other polyQ lengths 7,22,28, we conducted a seeded elongation reaction of K2Q23K2 monomers containing a known weight concentration of previously prepared K2Q23K2 fibrils to obtain a pseudo-first order rate constant for the elongation reaction (Fig. 8a). We determined the concentration of growing ends in the seed aggregate (Fig. 8b) 7,22,28 and used this value to calculate, from the pseudo-first order elongation (Fig. 8a) rate constant, a second order rate constant for elongation (k+) of 1.24 × 10⁴ M−1sec−1, which is almost identical to the previously reported value for a K2Q47K peptide 7. As previously discussed 7, such k+ values fall well below the diffusion limit, possibly reflecting either the slow diffusion of the large reactants and/or the operation of a rate-limiting folding step (such as the “locking” phase of the dock-and-lock mechanism for fibril elongation 31 as part of the elongation cycle). Knowledge of k+, along with the critical assumption that the elongation rate constant for fibrils is essentially the same as for nuclei, allowed us to calculate the nucleation equilibrium constant (Kn*) for K2Q23K2 from the expression relating the y-intercept of the log-log plot (Fig. 6d) to the parameters k+ and Kn*:
Figure 8.

Further nucleation kinetics analysis of K2Q23K2. a. Determination of pseudo-first-order elongation rate constant (k*) from elongation kinetics of K2Q23K2 seeded with ∼12% (w/w) aggregates. b. Determination of the fmoles of biotinylated K2Q29K2 bound at 25 °C to aliquots of the K2Q23K2 seed fibril suspension (from panel a) to determine the concentration of growth sites in the seed aggregates (Methods). c. Linear fits of the log-log plot data of K2Q23K2 and K2Q37K2 (data from Figs. 6d and 4d, respectively) extrapolated to 1 nM. d. Calculated aggregation kinetics curves for 1 nM of various polyQ peptides using parameters derived from nucleation kinetics analyses.
This analysis yields a value of Kn* for K2Q23K2 of 7.6 × 10⁻² l3/mol3. Using this value, we calculate that the concentration of tetrameric nucleus in pre-equilibrium with 100 μM monomer (a typical concentration in our aggregation experiments) is 7.6 × 10⁻¹⁸ M. Consistent with the slower nucleation of K2Q23K2, this concentration is much lower than the steady state nucleus concentration of 2.6 × 10⁻¹³ M calculated for a 100 μM concentration of K2Q47K2 from its previously determined Kn* 7. Such values indicate the vanishingly small levels of the critical nucleus populated at any one time during nucleated growth, and thus illustrate the tremendous challenges in carrying out any type of structural or physical characterization of such kinetic nuclei 19.
Discussion
In the thermodynamic model for nucleated growth polymerization (Fig. 9), the nucleus is defined as the least stable species on the aggregation pathway 19,32. Classically this critical nucleus (n*) is envisioned as a thermodynamically highly unfavorable multimer for which the subsequent docking of additional monomer units provides net stabilization (Fig. 9a). In precise analogy to the multimeric nucleus, the monomeric nucleus is also thermodynamically unstable, representing a very small percentage of total monomer in solution. As with other nuclei in the formalism of the thermodynamic model, the overall efficiency of nucleation depends on both the steady-state concentration of the nucleus and the rate of its elongation 21. In contrast with multimeric nuclei, however, the thermodynamic barrier to monomeric nucleus formation is solely dependent on conformational dynamics within the monomer ensemble 7. We have envisioned this conformational change as an extremely unfavorable ordering, or folding, of polyQ into an elongation-competent structure that contains β-sheet elements in common with the final fibril structure (Fig. 9b) 7. One prediction from this model is that, as repeat length gets shorter, a point might be reached where formation of such a metastable, ordered monomeric folding unit will be prohibitively unfavorable. We have been conducting studies to probe the robustness and range of the monomeric nucleation model 6,7,20-22.
Figure 9.

Models of nucleated growth polymerization. a. Classical thermodynamic model of nucleation, where n* is the critical nucleus. b, c. Two models for monomeric nucleation of polyQ aggregation in which the nucleus is either highly organized (b) or extended (c). d-f. Hypothetical 4-stranded β-sheet model structures for aggregation critical nuclei that are tetrameric (d), monomeric (e), or dimeric (f).
There are nine different expanded polyQ repeat diseases, each with a different disease protein with different sequence elements flanking the polyQ tract 1. In some cases, an adjacent element of structure dominates the initial stages of spontaneous aggregation in polyQ disease proteins 10,13,14. However, the polyQ in most polyQ disease proteins is contained within a larger disordered segment (Fig. 1a, Supplementary Fig. 2) that may be susceptible to intracellular proteolysis, and/or may have no ability to independently aggregate. Thus, in contrast to the HTT 10 and AT3 14 sequences, the AT7 N-terminal flanking sequence AT7NT does not appear capable of triggering aggregation, or of appreciably altering the normal aggregation mechanism found for model polyQ peptides flanked by solubilizing Lys residues (Fig. 1). In fact, even the HTTNT sequence does not entirely eliminate the previously described, normal polyQ aggregation mechanism. For example, we now know that the nucleation pathway previously described for simple polyQ sequences 6,7,15,20-22 contributes to overall aggregation of HTTNT containing fragments (M. Jayaraman, A.K. Thakur, R. Mishra, R. Kodali and R. Wetzel, Ms. submitted) and may even be dominant if the HTTNT sequence is bound to another protein 33 or is post-translationally modified 16. Likewise, proteolytic cleavage at Lys15 within the HTTNT sequence can take place in cells (A.L. Southwell, C.W. Bugg, L.S. Kaltenbach, D. Dunn, S.L. Butland, A. Weiss, P. Paganetti, D.C. Lo and P.H. Patterson, Ms. submitted), and full-length mutant HTT with 97Q carrying deletion of the HTTNT domain has been found to still form aggregated mutant huntingtin in transgenic mouse brains (X. William Yang, David Geffen School of Medicine, UCLA, personal communication). We show here that the peptide produced when an HTT N-terminal fragment is cleaved at Lys15 aggregates according to the same nucleated growth polymerization mechanism, with n* = 1, as previously found for similar repeat length versions of simple polyQ peptides (Fig. 3). Thus, further analysis of the nucleation mechanisms operative for simple polyQ peptides is not only relevant to fundamental characteristics of polymer assembly, but also to the biology of disease.
In our initial description of the classical nucleated growth polymerization behavior of simple polyQ sequences, we provided a body of data consistent with a simple, two-state transformation of monomeric coils to β-sheet rich amyloid-like aggregates, with no detectible alternatively structured intermediate aggregates, and with a surprising critical nucleus of one 6. In the analyses described here, we build on this prior work but introduce several modifications designed to provide additional confidence in the results. We introduced a 20 nm filtration step as an added measure to remove any pre-existing aggregates from starting monomer solutions, evaluated all kinetics time points in duplicate, and doubled the number of concentrations evaluated in the log-log plots. As described in Results, however, none of these changes made any appreciable difference in the previously obtained n* value for K2Q37K2. By adding DLS measurements, time-dependent, semi-quantitative EM determinations, and an analytical 20 nm filtration analyses to test for the presence of even very small aggregates, we have not been able to observe the recently reported 25 formation of large amounts of large non-amyloid aggregates in the early stages of simple polyQ aggregation. Instead of the 30% monomer loss within two hours reported for 8–22 μM concentrations of K2Q23K2 25, we found < 1% loss of monomer for a 215 μM solution of the same peptide under the same conditions (Fig. 5, Supplementary Table 1).
The discovery that shorter polyQ peptides aggregate via the same general nucleated growth polymerization mechanism, but with larger critical nuclei, further supports our approach to data analysis 6,19 and the previously proposed monomeric nucleation pathway 6, and suggests that the latter is part of a continuum, linked by a common structural motif, that includes, for shorter polyQ lengths, higher order critical nuclei in the 2–4 range. Critical nuclei in this range have been reported previously for other amyloid formation reactions 34-37. Recent studies of short polyQ peptides support a different aggregation mechanism mediated by formation of non-amyloid oligomers 38. These peptides, however, are not only chemically different from those described here, but also were disaggregated and handled differently.
Being sparsely and transiently populated, it is essentially impossible – especially in a solution dominated by ground state molecules – to physically characterize the kinetic nucleus of a nucleated growth polymerization reaction 19. Structural clues might be obtained by a number of means, however, such as molecular dynamics simulations 39,40, synthesis and testing of model peptides 41, or model building based on established structures of more stable intermediates or products. X-ray diffraction studies suggest that amyloid-like polyQ aggregates exist as slabs of β-sheets 42,43 with an anti-parallel chain arrangement 42. Based on such structures, we hypothesize that the Q23 aggregation nucleus consists of four molecules of Q23, each contributing one segment of extended chain, which are arranged as two stacked slabs, each slab consisting of two strands of anti-parallel sheet (Fig. 9d).
The identification of a multimeric nucleus for K2Q23K2 aggregation has important implications for the structure of the monomeric nucleus for longer polyQs. One model for this structure is our previously described “folding” model 6,7 (Fig. 9b). However, since polyQ sequences exist in aqueous solution as compact coils 38,44 that appear to greatly resist expansion 45, the energetically unfavorable conformational change associated with nucleation might also be modeled as a rearrangement that transiently generates an isolated segment of solvated statistical coil (Fig. 9c). If this “statistical coil” model of the monomeric nucleus (Fig. 9c) were correct, however, we would expect that Q23 would also have an n* of 1, since solution structures with all or part of the chain in solvated, statistical coil seem likely to be more thermodynamically accessible to short polyQs than to longer polyQs 46. Models such as that shown in Figure 9c are also inconsistent with other experimental data 22.
In contrast, a monomeric nucleus consisting of a highly organized, folded structure (Fig. 9b) is quite consistent with our model for the tetrameric nucleus for Q23 (Fig. 9d). Thus, the folded monomeric nucleus might structurally resemble the multimeric nucleus, except that all of the β-extended chain segments would now be derived from the same polypeptide sequence, through a series of turns and/or chain reversals (Fig. 9e). Consistent with this model, we previously reported that long, mutated polyQ peptides containing β-turn-favoring Pro-Gly pairs at regular intervals also aggregate via a monomeric nucleus, and that substitution with β-turn enhancing D-Pro-Gly pairs further accelerates aggregation 20. Furthermore, model building 47 and molecular dynamics simulations 48 suggest that structures like that shown in Figure 9e are feasible. Finally, it seems reasonable to conclude that the high degree of structural similarity in EMs (Fig. 2) and FTIR (Supplemental Fig. 4) between the Q23 and Q37 aggregates are ultimately derived from similarities in nucleus structure. A further extension of this logic suggests the structure shown in Figure 9f as a reasonable one for the dimeric critical nucleus implicated in the aggregation of K2Q25K2 (Table 1).
Models of nucleus structure, however, are by definition speculative and can only be tested or refined, at best, indirectly. Nonetheless it is intriguing and possibly relevant that the nucleus sizes in these experiments tend to hover around low integer values (Table 1) and are largely consistent with reasonable structural models consistent with established principles of protein folding as well as data from structural and mutational analyses of polyQ aggregates. As critical nuclei, such structures, by definition, must be highly thermodynamically unfavorable 7 and therefore are not expected to represent the most highly populated conformation within the monomer ensemble in the kind of physical experiments described here. Such a low frequency of formation is consistent with the experimental 38,44,45 and computational 45,46 demonstration of the dominant presence of condensed, disordered forms within the monomer ensemble. Because of the rarity of the nucleus in this field of condensed states, it would appear that computer simulations that mirror polyQ solution behavior may be just as hard pressed as are solution measurements to identify, characterize and quantify the extremely rare kinetic nucleus. Perhaps the best one can hope to achieve is to survey and quantify the appearance of certain structural elements in MD simulations of polyQ peptide behavior 49, and to evaluate the energetics of hypothetical candidate nuclei 48.
It is important to stress that the model for the monomeric nucleus shown in Figure 9e is fundamentally different from reports of organized structures of polyQ proteins inferred from physical structural data and suggested to represent toxic, misfolded forms of polyQ 50. The calculated steady state concentration of the monomeric nucleus in a 1 nM concentration of K2Q47K2 monomers is in the range of 10−18 M; the calculated concentration of the tetrameric nucleus in a 1 nM concentration of K2Q23K2 is in the range of 10−37 M. It is not feasible that these critical nuclei at such low concentrations might be directly toxic to cells. If aggregation critical nucleus structures are, in fact, associated with any disease-related toxicity, the effects must indirect, bestowed by virtue of their abilities to stimulate and mediate the rapid growth of toxic polyQ aggregates.
In fact, the rather small differences in nucleus size described here have enormous consequences for projected aggregation kinetics. Extrapolation of our data (obtained through experiments in the μM range) into the nM range of concentrations that are more likely to obtain in cells suggests a potentially huge difference in nucleation rates between Q23 and Q37 sequences due to the difference in their concentration dependence (Fig. 8c). A simulation (Fig. 8d) using parameters derived from the nucleation kinetics analysis underscores the power of this apparently modest slope difference, indicating that, while in vitro incubation at 1 nM would be expected to yield Q37 aggregation in 10–100 years, Q23 aggregation is expected to begin taking place only after 10–100 billion years! These extrapolations are shown only to illustrate the potential power of nucleus size to control aggregation propensity. The assumption of linearity over large concentration differences that underlie the extrapolations may well not be justified; it is possible that at some low polyQ concentration a nucleus of different size and associated kinetics might become more favored.
The complexity of aggregation nucleation revealed here introduces fascinating new issues for polyQ aggregation nucleated growth, including how repeat length effects on aggregation relate to repeat length effects on disease risk. Although the results reveal an extremely tight transition in the relationship between repeat length and nucleus size that is reminiscent of sharp transitions in curves of disease risk and repeat length 1, the repeat length threshold for nucleus size change revealed by our studies is 24–25, while thresholds for disease risk tend to be in the 35–45 range (note, however, the single exception of the disease spinocerebellar ataxia 6, for which the repeat length threshold is between 18 and 21 Q) 1. Is there a molecular basis for the difference between these analogously sharp, but non-overlapping, thresholds? The data presented here provide new hope for improved understanding of the connections between the repeat length dependence of disease risk and the repeat length dependence of polyQ physical properties, with implications for the prospects for discovering disease mechanisms and therapeutics.
Methods
Handling of peptides
Crude synthetic peptides were obtained from the Keck Biotechnology Resource Laboratory of Yale University (http://keck.med.yale.edu/), purified to homogeneous repeat lengths by reverse phase chromatography, and the structures and purities confirmed by LC-MS on an Agilent mass spectrometer. Lyophilized pure peptides were disaggregated as described 28 using a 16 hrs incubation in a 1:1 mixture of trifluoroacetic acid (TFA, Pierce) and hexafluoroisopropanol (HFIP, Acros Organics), followed by evaporation of solvent under nitrogen, exposure to vacuum, dissolving in pH 3 TFA-H2O, and high speed centrifugation. The top 80% of the supernatant was removed and its concentration determined by HPLC 28. Such stock solutions were always prepared fresh, rather than stored frozen, since storage of polyglutamine peptides in frozen aqueous solution can lead to substantial aggregation due to freeze concentration effects 28,51. Final solutions for aggregation studies at each peptide concentration were prepared by adding 1/9 volume of a 10× PBS buffer concentrate, followed by mixing. Most starting peptide solutions were also filtered through a 20 nm filter unit (Anotop 10, Whatman).
Sedimentation assay
Time points were analyzed in duplicate by removing aliquots and centrifuging at 20,800 × g for 45 mins, then carefully sampling the supernatant and injecting into the analytical HPLC 28. The peak area corresponding to the peptide was integrated and the number of μg peptide read off a standard curve 28. All aggregation kinetics data shown in this paper were conducted in 0.05% (w/v) sodium azide in PBS at 37 °C and were monitored by the sedimentation assay.
Preparing and quantifying seed aggregates
Seed aggregates for K2Q23K2 were prepared and quantified as previously described 28. After the K2Q23K2 aggregation had gone nearly to completion, aggregates were collected and washed by centrifugation (20,800 × g), then resuspended in PBS. An aliquot of the suspension was dissolved in 100% formic acid and injected into HPLC, with the integrated peak converted to μg K2Q23K2 using a standard curve. From this measurement the weight concentration of the seed suspension was calculated. Growing end titrations of seeds using biotinyl-K2Q29K2 were conducted as described 7,28.
Determination of the Cr and the reversibility of aggregate formation
A forward aggregation reaction of K2Q23K2 was monitored by the sedimentation assay until the % monomer exhibited no further change. Meanwhile, a late time point aliquot of an aggregation reaction was diluted into PBS such that the total K2Q23K2 concentration was well above the approximate Cr while the remaining monomer concentration was well below the approximate Cr. This was incubated at 37 °C and the amount of monomer in the supernatant periodically determined, using the sedimentation assay, until the % monomer value stabilized. For details, see 28,30.
Nucleation kinetics analysis and simulated aggregation curves
Aggregation kinetics data were treated as described previously 6,28, using the equation Δ = ½(k+2)(Kn*) c(n*+2)t2, in which Δ is the molar concentration of monomers that has been converted to aggregates at time t, and k+ is the second order elongation rate constant for nucleus elongation and aggregate elongation (which are assumed to be identical), c is the molar concentration of monomers at the start of the reaction, n* is the critical nucleus (the number of monomers that associate together to form the nucleus), and Kn* is the nucleation equilibrium constant. The slope of the log-log plot (Figure 2B) = n* + 2. The y intercept of the plot = log [½(k+2)(Kn*)]. Using the equation and these values it is also possible to calculate simulated aggregation curves for experimentally inaccessible concentrations. The use of the y intercept and second order elongation rate constant to calculate Kn* is described in the text and in previous publications 7,28.
Electron microscopy
An aliquot of 5 μl from the ongoing aggregation reaction mixture at different time points was placed on freshly glow-discharged carbon coated 400 mesh size copper grids, adsorbed for 2 min, and the grid washed with a drop of deionized water, before staining the sample with freshly filtered 5μl of 1% (w/v) uranyl acetate for 2 sec. The excess of sample, washes and stains was gently blotted off with filter paper. Grids were imaged in the Structural Biology Department's EM facility on a Tecnai T12 microscope (FEI) operating at 120 kV and 30,000 × magnification and equipped with an UltraScan 1000 CCD camera (Gatan) with post-column magnification of 1.4 ×.
FTIR
Fourier transform infrared spectroscopy of final aggregates was carried out on an MB3000 series spectrophotometer (ABB) with PROTA software (BioTools, Inc.). Peptide aggregates were collected by centrifugation at 20,800 × g and the pellet was washed three times with PBS. Spectra were recorded at 4 cm−1 resolution (400 scans at room temperature) and corrected for the residual buffer absorption by subtracting the buffer-alone spectrum interactively until a flat baseline was obtained in the 1,700–1,800 cm−1 region. Second-derivative spectra for the Amide I region were calculated using PROTA software.
Dynamic light scattering
DLS measurements were performed at 37 °C using DynaPro plate reader (Wyatt Technology Corp.) equipped with a temperature controller. An aliquot of ∼75μl was directly transferred from the ongoing reaction mixture at different time points to a fresh well of a 384 micro plate to record the scattering data. Dynamics V6 software (Wyatt Technology Corp.) was used to process the data and to analyze the autocorrelation functions to obtain the hydrodynamic radii (Rh).
Order analysis
Sequence-based predictions of protein order were calculated using the VX-LT (copyright©1999 by the WSU Research Foundation, all rights reserved) version of PONDR (PONDR® is copyright©2004 by Molecular Kinetics, all rights reserved).
Data analysis
Where error bars are shown, results are s.d. from analyses in duplicate. For simplicity error bars are not added to the monomer concentration data in the time2 plots but are only shown in the time plots. For all the reaction profiles, data sets were fit in Origin 7.5 software (OriginLab Corporation). The time plots were fit to B-spline curves. The time2 plots and log-log plots were fit by linear regression. Growth site measurements data shown in Figure 8b were fit to sigmoidal.
Supplementary Material
Acknowledgments
We acknowledge access to the PONDR® analysis, provided by Molecular Kinetics (6201 La Pas Trail - Ste 160, Indianapolis, IN 46268). We thank Guillermo Calero for access to his DLS instrument. We gratefully acknowledge funding support from NIH grants R01 AG019322 and R21 AG033757.
Footnotes
Author Contributions: K. K., M. J., and B. S. purified the peptides, determined and analyzed the aggregation kinetics, and obtained dynamic light scattering data on aggregation time points. R. K. obtained the EM and FTIR data. R. W. wrote the paper. All authors contributed to study design, data interpretation, and improving the manuscript.
References
- 1.Bates GP, Benn C. The polyglutamine diseases. In: Bates GP, Harper PS, Jones L, editors. Huntington's Disease. Oxford University Press; Oxford, U.K.: 2002. pp. 429–472. [Google Scholar]
- 2.Ross CA, Poirier MA. Opinion: What is the role of protein aggregation in neurodegeneration? Nat Rev Mol Cell Biol. 2005;6:891–8. doi: 10.1038/nrm1742. [DOI] [PubMed] [Google Scholar]
- 3.Scherzinger E, et al. Huntingtin-encoded polyglutamine expansions form amyloid-like protein aggregates in vitro and in vivo. Cell. 1997;90:549–58. doi: 10.1016/s0092-8674(00)80514-0. [DOI] [PubMed] [Google Scholar]
- 4.Chen S, Berthelier V, Yang W, Wetzel R. Polyglutamine aggregation behavior in vitro supports a recruitment mechanism of cytotoxicity. J Mol Biol. 2001;311:173–182. doi: 10.1006/jmbi.2001.4850. [DOI] [PubMed] [Google Scholar]
- 5.Davies SW, et al. Formation of neuronal intranuclear inclusions underlies the neurological dysfunction in mice transgenic for the HD mutation. Cell. 1997;90:537–48. doi: 10.1016/s0092-8674(00)80513-9. [DOI] [PubMed] [Google Scholar]
- 6.Chen S, Ferrone F, Wetzel R. Huntington's Disease age-of-onset linked to polyglutamine aggregation nucleation. Proc Natl Acad Sci USA. 2002;99:11884–11889. doi: 10.1073/pnas.182276099. [DOI] [PMC free article] [PubMed] [Google Scholar]
- 7.Bhattacharyya AM, Thakur AK, Wetzel R. polyglutamine aggregation nucleation: thermodynamics of a highly unfavorable protein folding reaction. Proc Natl Acad Sci U S A. 2005;102:15400–5. doi: 10.1073/pnas.0501651102. [DOI] [PMC free article] [PubMed] [Google Scholar]
- 8.Poirier MA, et al. Huntingtin spheroids and protofibrils as precursors in polyglutamine fibrilization. J Biol Chem. 2002;277:41032–7. doi: 10.1074/jbc.M205809200. [DOI] [PubMed] [Google Scholar]
- 9.Wacker JL, Zareie MH, Fong H, Sarikaya M, Muchowski PJ. Hsp70 and Hsp40 attenuate formation of spherical and annular polyglutamine oligomers by partitioning monomer. Nat Struct Mol Biol. 2004;11:1215–22. doi: 10.1038/nsmb860. [DOI] [PubMed] [Google Scholar]
- 10.Thakur AK, et al. Polyglutamine disruption of the huntingtin exon 1 N terminus triggers a complex aggregation mechanism. Nat Struct Mol Biol. 2009;16:380–9. doi: 10.1038/nsmb.1570. [DOI] [PMC free article] [PubMed] [Google Scholar]
- 11.Bulone D, Masino L, Thomas DJ, San Biagio PL, Pastore A. The Interplay between PolyQ and Protein Context Delays Aggregation by Forming a Reservoir of Protofibrils. PLoS ONE. 2006;1:e111. doi: 10.1371/journal.pone.0000111. [DOI] [PMC free article] [PubMed] [Google Scholar]
- 12.Ignatova Z, Thakur AK, Wetzel R, Gierasch LM. In-cell aggregation of a polyglutamine-containing chimera is a multistep process initiated by the flanking sequence. J Biol Chem. 2007;282:36736–43. doi: 10.1074/jbc.M703682200. [DOI] [PMC free article] [PubMed] [Google Scholar]
- 13.de Chiara C, Menon RP, Dal Piaz F, Calder L, Pastore A. Polyglutamine is not all: the functional role of the AXH domain in the ataxin-1 protein. J Mol Biol. 2005;354:883–93. doi: 10.1016/j.jmb.2005.09.083. [DOI] [PubMed] [Google Scholar]
- 14.Ellisdon AM, Thomas B, Bottomley SP. The two-stage pathway of ataxin-3 fibrillogenesis involves a polyglutamine-independent step. J Biol Chem. 2006;281:16888–96. doi: 10.1074/jbc.M601470200. [DOI] [PubMed] [Google Scholar]
- 15.Bhattacharyya A, et al. Oligoproline effects on polyglutamine conformation and aggregation. J Mol Biol. 2006;355:524–35. doi: 10.1016/j.jmb.2005.10.053. [DOI] [PubMed] [Google Scholar]
- 16.Gu X, et al. Serines 13 and 16 are critical determinants of full-length human mutant huntingtin induced disease pathogenesis in HD mice. Neuron. 2009;64:828–40. doi: 10.1016/j.neuron.2009.11.020. [DOI] [PMC free article] [PubMed] [Google Scholar]
- 17.Romero P, Obradovic Z, Dunker AK. Natively disordered proteins: functions and predictions. Appl Bioinformatics. 2004;3:105–13. doi: 10.2165/00822942-200403020-00005. [DOI] [PubMed] [Google Scholar]
- 18.Mohan A, et al. Analysis of molecular recognition features (MoRFs) J Mol Biol. 2006;362:1043–59. doi: 10.1016/j.jmb.2006.07.087. [DOI] [PubMed] [Google Scholar]
- 19.Ferrone F. Analysis of protein aggregation kinetics. Meths Enzymol. 1999;309:256–274. doi: 10.1016/s0076-6879(99)09019-9. [DOI] [PubMed] [Google Scholar]
- 20.Thakur A, Wetzel R. Mutational analysis of the structural organization of polyglutamine aggregates. Proc Natl Acad Sci U S A. 2002;99:17014–17019. doi: 10.1073/pnas.252523899. [DOI] [PMC free article] [PubMed] [Google Scholar]
- 21.Slepko N, et al. Normal-repeat-length polyglutamine peptides accelerate aggregation nucleation and cytotoxicity of expanded polyglutamine proteins. Proc Natl Acad Sci U S A. 2006;103:14367–72. doi: 10.1073/pnas.0602348103. [DOI] [PMC free article] [PubMed] [Google Scholar]
- 22.Jayaraman M, Kodali R, Wetzel R. The impact of ataxin-1-like histidine insertions on polyglutamine aggregation. Protein Eng Des Sel. 2009;22:469–78. doi: 10.1093/protein/gzp023. [DOI] [PMC free article] [PubMed] [Google Scholar]
- 23.Venkatraman P, Wetzel R, Tanaka M, Nukina N, Goldberg AL. Eukaryotic proteasomes cannot digest polyglutamine sequences and release them intact during degradation of polyglutamine-containing proteins. Mol Cell. 2004;14:95–104. doi: 10.1016/s1097-2765(04)00151-0. [DOI] [PubMed] [Google Scholar]
- 24.Kirkitadze MD, Condron MM, Teplow DB. Identification and characterization of key kinetic intermediates in amyloid beta-protein fibrillogenesis. J Mol Biol. 2001;312:1103–19. doi: 10.1006/jmbi.2001.4970. [DOI] [PubMed] [Google Scholar]
- 25.Lee CC, Walters RH, Murphy RM. Reconsidering the mechanism of polyglutamine Peptide aggregation. Biochemistry. 2007;46:12810–20. doi: 10.1021/bi700806c. [DOI] [PubMed] [Google Scholar]
- 26.Chen S, Wetzel R. Solubilization and disaggregation of polyglutamine peptides. Protein Science. 2001;10:887–891. doi: 10.1110/ps.42301. [DOI] [PMC free article] [PubMed] [Google Scholar]
- 27.Wetzel R. Protein folding and aggregation in the expanded polyglutamine repeat diseases. In: Buchner J, Kiefhaber T, editors. The Protein Folding Handbook. Part II. Wiley-VCH; Weinheim: 2005. pp. 1170–1214. [Google Scholar]
- 28.O'Nuallain B, et al. Kinetics and thermodynamics of amyloid assembly using a high-performance liquid chromatography-based sedimentation assay. Methods Enzymol. 2006;413:34–74. doi: 10.1016/S0076-6879(06)13003-7. [DOI] [PubMed] [Google Scholar]
- 29.Frieden C. Protein aggregation processes: In search of the mechanism. Protein Sci. 2007;16:2334–44. doi: 10.1110/ps.073164107. [DOI] [PMC free article] [PubMed] [Google Scholar]
- 30.O'Nuallain B, Shivaprasad S, Kheterpal I, Wetzel R. Thermodynamics of abeta(1-40) amyloid fibril elongation. Biochemistry. 2005;44:12709–18. doi: 10.1021/bi050927h. [DOI] [PubMed] [Google Scholar]
- 31.Cannon MJ, Williams AD, Wetzel R, Myszka DG. Kinetic analysis of beta-amyloid fibril elongation. Anal Biochem. 2004;328:67–75. doi: 10.1016/j.ab.2004.01.014. [DOI] [PubMed] [Google Scholar]
- 32.Ferrone FA. Nucleation: the connections between equilibrium and kinetic behavior. Methods Enzymol. 2006;412:285–99. doi: 10.1016/S0076-6879(06)12017-0. [DOI] [PubMed] [Google Scholar]
- 33.Tam S, et al. The chaperonin TRiC blocks a huntingtin sequence element that promotes the conformational switch to aggregation. Nat Struct Mol Biol. 2009;16:1279–85. doi: 10.1038/nsmb.1700. [DOI] [PMC free article] [PubMed] [Google Scholar]
- 34.Arvinte T. Human calcitonin fibrillogenesis. In: Bock GR, editor. The Nature and Origin of Amyloid Fibrils; Ciba Foundation Symposium 199. Wiley; New York: 1996. pp. 90–97. [Google Scholar]
- 35.Collins SR, Douglass A, Vale RD, Weissman JS. Mechanism of prion propagation: amyloid growth occurs by monomer addition. PLoS Biol. 2004;2:e321. doi: 10.1371/journal.pbio.0020321. [DOI] [PMC free article] [PubMed] [Google Scholar]
- 36.Frankenfield KN, Powers ET, Kelly JW. Influence of the N-terminal domain on the aggregation properties of the prion protein. Protein Sci. 2005;14:2154–66. doi: 10.1110/ps.051434005. [DOI] [PMC free article] [PubMed] [Google Scholar]
- 37.Xue WF, Homans SW, Radford SE. Systematic analysis of nucleation-dependent polymerization reveals new insights into the mechanism of amyloid self-assembly. Proc Natl Acad Sci U S A. 2008;105:8926–31. doi: 10.1073/pnas.0711664105. [DOI] [PMC free article] [PubMed] [Google Scholar]
- 38.Walters RH, Murphy RM. Examining polyglutamine peptide length: a connection between collapsed conformations and increased aggregation. J Mol Biol. 2009;393:978–92. doi: 10.1016/j.jmb.2009.08.034. [DOI] [PMC free article] [PubMed] [Google Scholar]
- 39.Khare SD, Ding F, Gwanmesia KN, Dokholyan NV. Molecular origin of polyglutamine aggregation in neurodegenerative diseases. PLoS Comput Biol. 2005;1:230–5. doi: 10.1371/journal.pcbi.0010030. [DOI] [PMC free article] [PubMed] [Google Scholar]
- 40.Marchut AJ, Hall CK. Effects of chain length on the aggregation of model polyglutamine peptides: molecular dynamics simulations. Proteins. 2007;66:96–109. doi: 10.1002/prot.21132. [DOI] [PubMed] [Google Scholar]
- 41.Smith MH, et al. Polyglutamine fibrils are formed using a simple designed beta-hairpin model. Proteins. 2010;78:1971–9. doi: 10.1002/prot.22713. [DOI] [PubMed] [Google Scholar]
- 42.Sharma D, Shinchuk LM, Inouye H, Wetzel R, Kirschner DA. Polyglutamine homopolymers having 8-45 residues form slablike beta-crystallite assemblies. Proteins. 2005;61:398–411. doi: 10.1002/prot.20602. [DOI] [PubMed] [Google Scholar]
- 43.Sikorski P, Atkins E. New model for crystalline polyglutamine assemblies and their connection with amyloid fibrils. Biomacromolecules. 2005;6:425–32. doi: 10.1021/bm0494388. [DOI] [PubMed] [Google Scholar]
- 44.Crick SL, Jayaraman M, Frieden C, Wetzel R, Pappu RV. Fluorescence correlation spectroscopy shows that monomeric polyglutamine molecules form collapsed structures in aqueous solutions. Proc Natl Acad Sci U S A. 2006;103:16764–9. doi: 10.1073/pnas.0608175103. [DOI] [PMC free article] [PubMed] [Google Scholar]
- 45.Dougan L, Li JY, Badilla CL, Berne BJ, Fernandez JM. Single homopolypeptide chains collapse into mechanically rigid conformations. Proc Natl Acad Sci U S A. 2009;106:12605–12610. doi: 10.1073/pnas.0900678106. [DOI] [PMC free article] [PubMed] [Google Scholar]
- 46.Wang X, Vitalis A, Wyczalkowski MA, Pappu RV. Characterizing the conformational ensemble of monomeric polyglutamine. Proteins. 2006;63:297–311. doi: 10.1002/prot.20761. [DOI] [PubMed] [Google Scholar]
- 47.Starikov EB, Lehrach H, Wanker EE. Folding of oligoglutamines: a theoretical approach based upon thermodynamics and molecular mechanics. J Biomol Struct Dyn. 1999;17:409–27. doi: 10.1080/07391102.1999.10508374. [DOI] [PubMed] [Google Scholar]
- 48.Esposito L, Paladino A, Pedone C, Vitagliano L. Insights into structure, stability, and toxicity of monomeric and aggregated polyglutamine models from molecular dynamics simulations. Biophys J. 2008;94:4031–40. doi: 10.1529/biophysj.107.118935. [DOI] [PMC free article] [PubMed] [Google Scholar]
- 49.Lakhani VV, Ding F, Dokholyan NV. Polyglutamine induced misfolding of huntingtin exon1 is modulated by the flanking sequences. PLoS Comput Biol. 2010;6:e1000772. doi: 10.1371/journal.pcbi.1000772. [DOI] [PMC free article] [PubMed] [Google Scholar]
- 50.Nagai Y, et al. A toxic monomeric conformer of the polyglutamine protein. Nat Struct Mol Biol. 2007;14:332–40. doi: 10.1038/nsmb1215. [DOI] [PubMed] [Google Scholar]
- 51.Chen S, Berthelier V, Hamilton JB, O'Nuallain B, Wetzel R. Amyloid-like features of polyglutamine aggregates and their assembly kinetics. Biochemistry. 2002;41:7391–9. doi: 10.1021/bi011772q. [DOI] [PubMed] [Google Scholar]
Associated Data
This section collects any data citations, data availability statements, or supplementary materials included in this article.