

Abstract
Thorough QT (TQT) studies are designed to evaluate potential effect of a novel drug on the ventricular repolarization process of the heart using QTc prolongation as a surrogate marker for torsades de pointes. The current process to measure the QT intervals from the thousands of electrocardiograms is lengthy and expensive. In this study, we propose a validation of a highly automatic‐QT interval measurement (HA‐QT) method. We applied a HA‐QT method to the data from 7 TQT studies. We investigated both the placebo and baseline‐adjusted QTc interval prolongation induced by moxifloxacin (positive control drug) at the time of expected peak concentration. The comparative analysis evaluated the time course of moxifloxacin‐induced QTc prolongation in one study as well. The absolute HA‐QT data were longer than the FDA‐approved QTc data. This trend was not different between ECGs from the moxifloxacin and placebo arms: 9.6 ± 24 ms on drug and 9.8 ± 25 ms on placebo. The difference between methods vanished when comparing the placebo‐baseline‐adjusted QTc prolongation (1.4 ± 2.8 ms, P = 0.4). The differences in precision between the HA‐QT and the FDA‐approved measurements were not statistically different from zero: 0.1 ± 0.1 ms (P = 0.7). Also, the time course of the moxifloxacin‐induced QTc prolongation adjusted for placebo was not statistically different between measurements methods.
Ann Noninvasive Electrocardiol 2011;16(1):13–24
Keywords: thorough QT study, drug cardiotoxicity, moxifloxacin, QT interval, electrocardiogram, drug safety
INTRODUCTION
The U.S. and European regulatory agencies recommend the evaluation of the propensity of a new drug to induce prolongation of the rate‐corrected QT interval (QTc). In United States, the FDA requires Thorough QT (TQT) studies to be implemented in order to assess the propensity of a drug to have proarrhythmic effects by delaying the ventricular repolarization process of the heart. Today, the design and measurements implemented in TQT studies are well documented and understood even if the value of drug‐induced QTc prolongation as a surrogate marker for risk of TdP remains controversial. 1
To evaluate the sensitivity of clinical studies to detect small but significant increases in QT/QTc interval measurements, regulatory authorities expect the TQT study design to include a positive control drug. The common drug used is moxifloxacin, a synthetic fluoroquinolone antibiotic agent. As consistently shown in preclinical 2 , 3 and human 4 , 5 , 6 , 7 , 8 , 9 , 10 , 11 studies, moxifloxacin slightly blocks the rapid component of delayed rectifier repolarizing current (Ikr) of myocardial cells. This induces a prolongation of the QTc interval, mainly located in the early part of the T wave of the ECG. 12 While being accepted as a safe molecule, moxifloxacin has been shown to trigger TdPs in individuals with underlying risk factors. 13 , 14 However, in healthy individuals moxifloxacin produces a “safe” QTc interval prolongation between 5 and 15 ms at peak plasma concentration for a single dose of 400 mg.
Recommendations for the implementation of TQT studies are described in the E14 documents of the International Conference on Harmonization (ICH) and its associated Q&A document. 15 Interestingly, the E14 document does not include limitation about the definition of the technologies used to measure the QT interval. Three classes of techniques are described: the automatic, manual, and the manual adjudication (manual overread, computer‐assisted, and semiautomatic). Only the 2 latter methods are recommended in the E14 document and were reported in published TQT studies. ICH E14 document does not recommend the fully automatic approach because of the reported reduced performance of most algorithms when either the electrocardiogram (ECG) is polluted with noise (high‐ and low‐frequency components), 16 the T wave has a low amplitude or a U wave merges with the T wave. 17 , 18 Evidently, the manual adjudication represents a logical trade‐off between fully manual and fully automatic methods. Yet, it raises questions about the balance between human and computer‐based contributions to minimize resources while maximizing measurement precision. Also, it is noteworthy that QT measurements technologies are evolving rapidly 19 in both clinical 20 , 21 and drug safety 22 , 23 , 24 , 25 arenas.
In this study, our group has investigated data from a set of 7 TQT studies submitted to the FDA. First, we conducted a comparative study to assess the validity of a highly automatic QT measurement method in which manual review is minimized while computerized‐process for quality assessment and QT measurements are “fully” exploited. It is important to note that the highly automatic QT measurements are compared to the QT measurements submitted to the FDA, which are also based on automatic QT method but all these measurements have been manually reviewed and adjudicated (so‐called semiautomatic method). Therefore, we implemented this study in order to address 2 methodological aspects of TQT studies. First, can a highly automatic technique measure and qualify moxifloxacin QT signal in TQT studies? Second, what are the levels of variation of QT/QTc interval measurements across studies one may expect when using such QT measurement strategy? In addition, we will provide a description of sex‐related differences on the QTc interval measured in these TQT studies.
METHOD
Study Populations and Associated Information
Data included in the analyses are deidentified ECG waveforms for moxifloxacin and placebo arms, as well as demographic information from 351 healthy individuals enrolled in 7 TQT studies with crossover design. The pharmaceutical companies agreed on sharing their data with the Agency but requested to remain anonymous. The data shared by the FDA enabled us to evaluate the placebo‐controlled moxifloxacin‐induced QT/QTc interval prolongation at expected peak concentration of the drug (2 hours post dosing) in 6 studies, and the time profile of the QTc interval within one study, the so‐called study 7.
HL7 XML ECG Files from the FDA ECG Warehouse
The ECGs from the baseline and the placebo arms were recorded at the same time of the day than in the moxifloxacin arm in order to control for circadian effects. Intake time of the placebo was synchronized with intake time of moxifloxacin. The digital ECG files and the respective information (age, gender, and study treatment) were provided by the Center for Drug Evaluation and Research of the FDA to our organization. The HL7 XML ECGs files were sent to the University of Rochester by Mortara Instrument (Milwaukee, MN) following FDA request and were extracted from the ECG warehouse after FDA ensured that pharmaceutical companies agreed on having their ECG used for research purpose. Any information that could help identifying the source of the data or reveal the name of organizations involved in the study (pharmaceutical companies, ECG core laboratory, etc.) was removed from the files send to University of Rochester. Information about the methods adopted by ECG core laboratory to measure the QT intervals were not available. However, the FDA (CG, ML) provided a code to identify the five different ECG core laboratories (ECL) involved in the QT measurements of these seven studies (ECL A to E).
RR and QT Interval Measurements
The descriptions of the methods used by ECL to measure QT interval were not available, consequently our HA‐QT measurement method was compared to “current ECL methods” rather than a specific method. We expect that the ECLs involved in these seven TQT studies used semiautomatic QT method that is, a computer algorithm identifies the end of the T wave and a cardiologist or ECG technician visually assesses the end of T wave and provides adjudication if needed. Most likely for each tracing, the QT measurements were based on 3 beats with adjudication based on on‐screen tools such as the tangent method or on method using a global lead superimposition.
The HA‐QT and RR intervals measurements were based on the technology developed at the University of Rochester Medical Center, NY. The COMPAS software provided the identification of the end of the T wave based on a technique identifying the crossing‐point between the baseline and the descending slope of the T wave (least‐squares technique). 26 QT intervals were determined to be unreadable, preventing the measurements from being done, when the T‐wave amplitude was inferior to 50 μV (flat T wave). The QT interval measurements were computed in all available sinus beats. The median QT value from all measured cardiac beats was reported after applying rate correction formula described below.
The QT algorithm included a set of preprocessing steps such as: baseline estimation and removal based on spline interpolation, a low‐pass filter with finite‐impulse response of 20th order (FC = 25 Hz) was designed. Finally, we developed a least‐square method based on a moving‐window seeking for the maximum fitting slope within the terminal part of the T wave (independently from the identification of the end of the T wave).
The QT measurements from University of Rochester were sent to the FDA where they were matched with the QT measurements submitted by pharmaceutical companies. If a missing QT measurement was found in one of the data set (UR vs FDA) then the corresponding data point was removed from the other dataset.
Quality Assessment and Adjudication of QT Measurements
A quality assessment process involving a 2‐level filtering process was designed to identify QT and RR interval measurements outside of their “expected” range. The identification of these outlying values was based on the following two criteria:
-
1
Absolute thresholds: These first thresholds are used to identify failures of the computer methods leading to extreme values for QT and RR intervals. Based on clinical investigations related to short and long QT syndrome, we ensured that the QT criterion encompasses the normal QTc values: 350 < QTc < 440 ms (based on Fridericia correction formula). 27 We broadened this range in order to focus on unlikely values in the type of study population of TQT studies (healthy individuals): 340 < QTc < 515 ms, and 500 < RR <1350 ms.
-
2
Relative Threshold: We identified the ECG recordings associated with suspicious RR and QT interval values using a statistical tool (excluding ECGs meeting the above criteria). The QT interval values falling outside of the interquartile range computed from the overall set of available ECGs were labeled.
All ECGs associated with measurements fitting at least 1 of these 2 criteria were flagged and visually reviewed and then accepted, corrected or rejected in all studies but study 7.
Outlying measurements from the study 7 were identified using the criteria describe above (similar to other studies). However, we did not include manual adjudication of QT measurements rather we rejected the outlying measurements from the analysis when the end of the T wave was flawed. We had to change this review process because of the limited resources we had to analyze this second set of 8911 ECGs initially not included in our research plan. Data from the study 7 were sent by the FDA to the University of Rochester at later time in order to investigate the moxifloxacin‐induced QT time profile.
Comparing QT Measurements
In summary, the QT measurements compared in this work are called the HA‐QT, and the FDA‐submitted QT. The HA‐QT measurements are automatic QT measurement (based on COMPAS method) on which limited manual review based on quality metrics (described above) were done. All available beats in each ECGs are measured and median value from all beats is reported for each ECG tracing. The FDA QT measurements are expected to be based on automatic QT measurements with 100% manual review of the measurements. Most likely, different methods were used to measure automatically QT interval before manual review but these methods were not documented. The number of measurement manually adjudicated was not available either. Most likely, the QT measurements were based on 3 selected beats in each ECG tracing. Eventually, median value from the medians QT from the triplicate ECGs (when available) was computed.
Heart Rate Correction
Heart rate correction of the QT interval duration remains a challenging aspect of the assessment of QT‐prolonging effect of drugs. First, it is known that QT‐RR profiles are subject dependent and can be modified by drugs. Moxifloxacin does not significantly affect the heart rate in human; therefore, the issue of bias due to QT dependency to heart rate is not of strong concern in this analysis. Nevertheless, the Bazett's formula is known to generate large biased and reduced QTc measurement precision so we have excluded this correction method from our analysis. 28 , 29 We opted for comparing QTc using Fridericia's formula. 30
QTc Prolongation, Peak Concentration, and Time Profile
The assay sensitivity for a QT measurement technique in thorough QT studies is demonstrated when 2 criteria are met: (1) the lower 2‐sided 90% interval of the baseline adjusted and placebo controlled population‐based mean of QTc changes induced by moxifloxacin is above a 5 ms threshold (at the time of expected peak concentration) and (2) the QTc profile across time follows the expected plasma concentration of the drug (moxifloxacin).
In our study, the QT interval was measured in all available beats and the median value was computed to yield one value for each ECG. Since most individuals had triplicate ECGs, the median of the available replicates was calculated for each time point. Single time‐matched delta QTc durations were computed as follow:
 |
To account for the placebo effect, ΔQTcplacebo was subtracted from ΔQTcmoxi
 for each individual. The mean ΔΔQTc was calculated for each time point. Importantly, the QTc at baseline was the time‐match value when assessing the QTc prolongation at expected peak concentration whereas the QTc at baseline was measured from the predose ECG when evaluating the QTc profile in study 7. These methods follow the recommended analytic strategies adopted by the FDA.
31
for each individual. The mean ΔΔQTc was calculated for each time point. Importantly, the QTc at baseline was the time‐match value when assessing the QTc prolongation at expected peak concentration whereas the QTc at baseline was measured from the predose ECG when evaluating the QTc profile in study 7. These methods follow the recommended analytic strategies adopted by the FDA.
31
Statistical Analysis
The population‐based mean ΔΔQTc prolongations between methods at expected maximum concentration of moxifloxacin and their two‐sided 90% confidence interval are reported. T‐test were used to compare the population‐based average of QT interval between genders, a level of statistical significance (P‐value) was set to 0.05.
When comparing the curves describing the QT time profile between the QT methods (for study 7 exclusively), the primary analysis was based on a mixed‐effects linear model for repeated measures of the differences from baseline in ΔQTc between the 2 measurement techniques. The model had no intercept and used an unstructured covariance structure as this model showed the best goodness‐of‐fit.
The QT measurements realized at University of Rochester were sent to the FDA (to ML and CG) to implement the comparative analysis between HA‐QT and the measurements received by the Agency. Thus, most of the statistical analysis was implemented by ML and GC independently from the University of Rochester group.
RESULTS
Characteristics of 7 TQT Studies
All results described in this section are based on highly automatic QT measurement method realized from Lead II; if otherwise, relevant information is provided. Table 1 provides a brief description of the 7 TQT studies. All studies were single‐center, randomized, double‐blind, placebo‐controlled, active‐comparator, 4‐way crossover studies. As shown in Table 1, all studies were single dose but study no. 2 and no. 6, which used multiple doses, 2 and 4, respectively. The QT interval measurements from studies 3, 5, and 7 were from a similar ECG core laboratory (ECL B) while all others were from different ECL (A, C, to E). No precise information related to the QT method used in these TQT studies were reported to the Agency. The overall studies included 381 healthy individuals. The ages of subjects across studies were different (P < 0.001). Study 6 was based on multiple dose (n = 4). Study 2 had only one single ECG for each time point while all other studies included triplicate ECGs. This study included 2 doses given at different days of the protocol and the data from these 2 days were merged in our analysis. All ECGs were recorded before dosing and information about time interval between replicate ECGs was not provided. Our investigation includes the data from a total of 13,425 ECG tracings among those, 8911 were from study 7 in which, we investigated the moxifloxacin‐induced ΔΔQTc time profile.
Table 1.
Description of the 7 TQT Study Design and Populations
| Study | ECL | Size | ECGs | Females (%) | Design | Replicates | Age (yrs) | Number of Doses |
|---|---|---|---|---|---|---|---|---|
| 1 | A | 56 | 700 | 28 (50) | SD | 3 | 40 ± 9 | 1 |
| 2 | E | 37 | 224 | 17 (46) | SD | 1 | 33 ± 10 | 2 |
| 3 | B | 55 | 689 | 25 (45) | SD | 3 | 26 ± 7 | 1 |
| 4 | C | 75 | 930 | 30 (40) | SD | 3 | 29 ± 8 | 1 |
| 5 | B | 84 | 1416 | 84 (100) | SD | 3 | 52 ± 13 | 1 |
| 6 | D | 44 | 555 | 22 (50) | StS | 3 | 36 ± 11 | 4 |
| 7 | B | 30 | 8911 | 30 (100) | SD | 3 | 53 ± 6 | 1 |
ECL = ECG core laboratory providing the QT measurements;
Size = number of individuals; SD = moxifloxacin single dose; StS = moxifloxacin steady state; Size = number of enrolled individuals in the study.
Output from Quality Assessment Processes for QT and RR Intervals
The quality assessment processes has led to identifying 216 ECG recordings with outlying QT or RR values in studies 1 to 6 (6.1% of ECGs) and 254 were identified in study 7 (5.2%). From the first set, 50 ECGs were manually adjusted (1.4%), 20 (0.6%) were rejected and the rest was not modified. In the study 7, no ECGs were manually adjusted and 200 ECGs were rejected (4.1%).
Absolute QTc Measurements
Figure 1 illustrates the mean absolute values of QTc interval measurements (rate corrected using the Fridericia formula) and their standard error for the 7 TQT studies. When pooling all studies, the mean QTc durations were 408 ± 19 ms in the baseline placebo arm, 404 ± 20 ms in the placebo treatment, 407 ± 19 in baseline moxifloxacin arm, and 419 ± 21 ms in the moxifloxacin treatment arm (417 ± 20 ms when excluding the study at drug steady state, study 6).
Figure 1.

Absolute QTc values in thorough QT studies. Mean values and standard error of QTc interval (Fridericia) for studies 1 to 6. Absolute QTc values measured using the highly automatic method at 2 hours postdosing. As a note, the study 5 includes only women. In study 6, ECGs were recorded following multiple doses of moxifloxacin explaining the larger effect measured (steeper slope between moxifloxacin baseline and moxifloxacin treatment arms for this study).
The difference in absolute QTc interval duration between the moxifloxacin treatment and baseline arm is 23 ms for the study including only females (study 5: 442 ± 21 vs 419 ± 21 ms), 21 ms for the study at drug steady state (study 6: 427 ± 24 vs 406 ± 21 ms) and 8 ms in average for all other studies. In study 6, the variation from treatment to baseline arms for the moxifloxacin arm is almost 3‐fold larger than in the other studies including both male and female subjects.
Effect of Gender on the Moxifloxacin‐Induced QTc Prolongation
Figure 1 revealed a longer QTc in study 5 including only females than in the other studies for all arms. We investigated the gender‐related difference for the absolute QTc values, for ΔQTc by treatment, and for ΔΔQTc by merging all ECGs from the 7 studies. Mean values are provided in Table 2. Females show larger moxifloxacin‐induced QTc prolongation before (434 ± 21 vs 401 ± 19, P < 0.01) and after adjustment for baseline (16 ± 14 vs 7 ± 13 ms, P < 0.01), as well as after controlling for placebo effect (17 ± 16 vs 12 ± 15, P = 0.04).
Table 2.
Gender Differences in Moxifloxacin Response
| N | Female | N | Male | P | |
|---|---|---|---|---|---|
| QTcF Placebo baseline | 442 | 420 ± 20 | 290 | 393 ± 16 | <0.01 |
| QTcF Placebo treatment | 474 | 419 ± 20 | 290 | 389 ± 17 | <0.01 |
| QTcF moxifloxacin baseline | 472 | 419 ± 17 | 290 | 393 ± 17 | <0.01 |
| QTcF moxifloxacin tsreatment | 474 | 434 ± 21 | 290 | 401 ± 19 | <0.01 |
| Δ QTcF placebo | 442 | −1 ± 12 | 290 | −4 ± 12 | 0.01 |
| ΔQTcF moxifloxacin | 472 | 16 ± 14 | 290 | 7 ± 13 | <0.01 |
| ΔΔ QTcF | 440 | 17 ± 16 | 290 | 12 ± 15 | 0.04 |
FDA‐submitted versus Highly‐Automatic (HA) QT/QTc Measurements
The QT interval measurements from computerized techniques are known to provide different results depending on the approaches used to process the ECG signal, to remove the baseline wander, to increase signal‐to‐noise and to identify the end of the T wave. 32 , 33 Today there is no “gold standard” for QT measurement methods. We used the measurements submitted to the FDA as reference even though each study used a different method to measure the QT interval. All these methods have commonly been validated (appropriate assay sensitivity) during the regulatory submission of the study.
First, we used Bland‐Altman plots 34 to investigate the level of agreements between HA versus FDA‐approved QT measurements. Figure 2 demonstrates that the HA method is associated with an approximately 10 ms longer QT interval than FDA‐submitted data. The level of agreement between HA and the FDA‐submitted measurements are consistent for the placebo and moxifloxacin arms: mean difference is 9.6 and 9.8 ms, and the limits of agreement (95% CI) are 25 and 24 ms, respectively. Figure 2 was based on 4019 ECG tracings. The figure suggests that HA‐QT method does report consistent difference with FDA‐submitted methods on and off the drug (moxifloxacin).
Figure 2.

Level of agreement between highly automatic and FDA‐submitted QTc Measurements. Bland‐Altman plot comparing the QT interval measurements from 4019 ECGs for the moxifloxacin and placebo arms. The graph demonstrates a consistently larger QT interval in highly automatic method versus FDA‐submitted. The average differences were similar between the 2 arms.
The differences in absolute values of QTc described above means that the identification of the end of the T wave is different between methods. The ΔΔQTc at 2 hours postdosing were evaluated in the 6 studies and mean results are reported in Table 3. The largest difference in ΔΔQTc between methods was in study 5 with a 6.6 ms larger effect for the HA method compared to the FDA‐submitted results. This difference was peculiar. In the other studies, differences between methods ranged between −1.2 to 3.4 ms. Two studies revealed shorter ΔΔQTc in HA method (studies 2 and 4) while this difference was positive in the remaining 4 studies. The average difference in population‐based mean ΔΔQTc was equal to −1.4 ± 2.8 ms. The average difference was not statistically different from zero (P = 0.4).
Table 3.
Comparison of Highly automatic versus FDA‐submitted ΔΔQTc
| Study | N | FDA‐ΔΔQTc | HA‐ΔΔQTc | ||||
|---|---|---|---|---|---|---|---|
| Mean | SD | SE | Mean | SD | SE | ||
| 1 | 56 | 10.0 | 13.1 | 1.7 | 11.8 | 12.2 | 1.6 |
| 2 | 37 | 14.3 | 18.1 | 3.0 | 14.0 | 19.6 | 3.2 |
| 3 | 55 | 11.5 | 14.8 | 2.0 | 12.8 | 16.7 | 2.3 |
| 4 | 75 | 13.2 | 10.9 | 1.3 | 12.0 | 12.3 | 1.4 |
| 5 | 84 | 11.4 | 15.8 | 1.7 | 18.0 | 16.3 | 1.8 |
| 6 | 44 | 19.5 | 14.4 | 2.2 | 22.9 | 15.2 | 2.3 |
SD = standard deviation; SE = standard error.
In term of precision, the standard error (SE) of ΔΔQTc between HA and FDA‐submitted QT measurements were similar too. The averaged paired difference of SE was equal to −0.1 ± 0.1 ms. The average difference was not different from zero (P = 0.7).
The results from Table 3 are illustrated in the panel C of Figure 3. The panel A and B show the mean (90% confidence interval) for ΔQTc for the placebo and moxifloxacin arms, respectively. There is no statistical difference between FDA ΔQTc values and the ones computed at University of Rochester using the highly automatic techniques.
Figure 3.

Comparing QTc interval measurements. comparison of ΔQTc for placebo (panel A) and moxifloxacin (panel B) arms and for ΔΔQTc in panel C. The black dots are for the highly automatic measurements whereas white dot shows the values for FDA‐submitted measurements. The results are very similar for the placebo ΔQTc (no statistical differences). The largest difference is found in the moxifloxacin arm of the study 5, this difference explains the ΔΔQTc values in panel C.
FDA‐submitted versus Highly Automatic QTc: Moxifloxacin Profile
The analysis of the data from Study 7 focused on the time profiles of ΔQTc for placebo and moxifloxacin arms as well as the time profile for ΔΔQTc. The results are provided in Figure 4. The ΔQTc values were computed using predosing QTcF values instead of time‐matched baseline values. 35 The plots provide consistent results with the analysis of the previous section. No statistical difference was found between the profiles of ΔQTc and ΔΔQTc based on mixed‐effects linear models (P = 0.7 when testing if the profiles were different). The ΔQTc between FDA‐approved and HA QTcF at T = 12 in the placebo arm is peculiar, more than 6 ms difference between methods is found for this specific time point. We did not have access to the annotated QT waveforms from the FDA and were not able to identify the source of this discrepancy. Therefore, we checked the measurements from the HA‐QT method for this specific time point but we could not identify any obvious failure of the algorithm or erroneous measurements.
Figure 4.
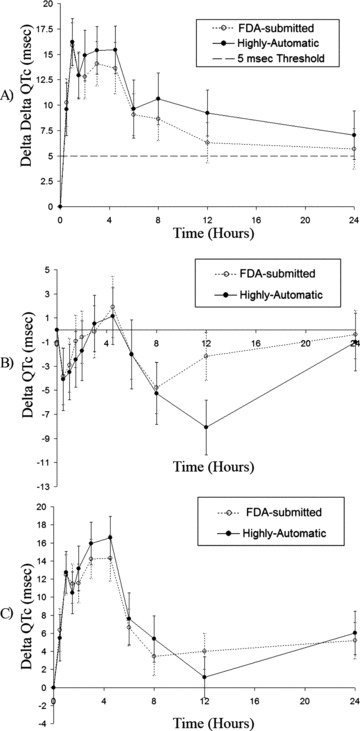
QTc interval profile. Double delta (A) and single delta QTc profiles for placebo (B) and moxifloxacin (C) arms from study 7.
DISCUSSION
Our study investigates the ability of a highly automatic QT measurement method to detect the moxifloxacin signal under TQT study design. We implemented a thorough comparison between the results from the HA method developed at University of Rochester Medical Center and the QT measurements submitted by pharmaceutical companies to the FDA.
Establishing Assay Sensitivity in TQT Studies
We reviewed the list of TQT studies reported in the literature and we identified the ones including results about their positive control arm. We identified 9 reports describing ICH E14‐based TQT studies. They were TQT studies investigating levoceretizine, 36 tolterodine, 37 brivaracetam, 38 levetiracetam, 39 rivaroxaban, 40 and maraviroc. 41 The studies by Davis et al., 42 Malhotra et al. 43 and Darpo et al. 44 included (or focused) on assay sensitivity between fully automatic and semiautomatic QT measurements. In E14 TQT studies, assay sensitivity is established if the ΔΔQTc at one time point is greater than 5 ms, as measured by the lower 1‐sided 95% confidence bound. Most studies found in the literature were crossover design and based on a single moxifloxacin dose of 400 mg. The reported QTcF is the ΔΔQTcF for moxifloxacin in comparison to placebo after baseline adjustment (time‐matched) measured at either maximum drug concentration or its expected time (2 hours after dosing). All published studies reported a lower 1‐sided 95% CI above the 5 ms threshold. The range of mean double delta QTcF varies between 7.7 and 14.0 ms (mean = 11.9 ms). The average size of the 2‐sided 90% CI is equal to 6.0 ms ranging from 3.8 to 7.6 ms. Within the studies evaluated in our investigation, the mean ΔΔQTcF across studies is equal to 11.9 ms, 10.0 ms being the smallest, and 14.3 ms the largest (for similar type of studies). The average 90% CI is 3.9 ms (2.5 to 6.0 ms). Consequently, the results we report in our investigation are consistent with current description. As a comment, we obtained a slightly lower 2‐sided 90% confidence interval than the ones reported in the literature (3.9 vs. 6.0 ms).
Interestingly when we investigated QTc profile, we observed a ΔΔQTc profile from the HA method slightly higher than the FDA‐approved data in a several time points and mainly located in the descending portion of the profile. The explanation for this difference remains speculative but one would emphasize that moxifloxacin was associated with a reduction of T‐wave amplitude. 12 Such changes should lead to a flattening of the slope used for the identification of the end of the T wave leading to a larger QT interval. Such explanation could not be checked but represent a likely explanation. One would note that the QT interval in study 7 were measured using a semiautomatic method that could have been based on the tangent method too. As a reminder, such trend was not observed in the data from the other studies (studies 1, 2, and 3).
As a note, one would expect the 90% confidence interval for a given method to be decreasing when the number of enrolled individuals increases. Based on Table 2, this expectation is neither met in the FDA‐submitted data nor in the highly automatic method. This observation reveals that other factors have an impact of the precision of QT interval measurements, among them ECG quality might play an important role and population selection bias could be involved as well.
As we discussed earlier the use of computerized QT measurement techniques in TQT studies is of paramount importance because it would greatly simplify and streamline the processes around ECG analysis in drug safety trial that could cascade to earlier evaluation phase 1 or later postmarket evaluations (patients home monitoring). Specifically in TQT studies, the consequences of the use of more computerized methods are 2‐fold. First, there is an obvious impact linked to the reduction of resources and time needed to measure the thousands of tracings recorded in these safety studies, highly automatic method represents a very cost‐effective process. Second, automatic or highly automatic methods can process more cardiac beats. With more than 80% of TQT studies relying on continuous telemetric or Holter recorders, automatic QT offers an opportunity for thoroughly investigating the ECGs from TQT studies. The use of beat‐to‐beat QT assessment of long‐term recordings in drug safety trials could help addressing the current challenges related to drug that modifies cardiac regulation. 45 , 46 , 47 , 48 , 49
Our analysis and review of literature of TQT studies reveals that moxifloxacin‐induced QT prolongation is easily captured using manual, semimanual and, as reported by several authors, fully automatic methods. 50 , 51 , 52 , 53 The highly automatic method is presented in this work as a new alternative relying primarily on the performances of an algorithm while directing human interaction toward the most suspicious measurements. Furthermore, we demonstrate that with a very limited human review (6.1% of the ECGs) and adjudication (1.4% of the ECGs), we reach the same precision than the methods currently used in FDA‐approved trials. Based on study 7, the assay sensitivity of our QT method is fully established. Finally, increased acceptance of computerized methods in TQT studies will create an opportunity for evaluating additional ECG markers that can easily be included in these algorithms. For instance, several groups are currently investigating the role of T‐wave morphology in drug safety trials. 54 , 55 Our group evaluated the interest of looking at T‐loop morphology in thorough QT studies and a preliminary investigation described T‐loop morphology indices as more precise than QT interval measurements. Therefore, one may expect that the combination of QTc interval duration and other ECG markers might in the future help drug‐safety assessment. 12 , 56
Finally, our gender‐based analysis showed that all QTc measurements are significantly different between males and females. First, the baseline ECGs present longer QTc interval duration but also the response to moxifloxacin is stronger in women. It was expected that moxifloxacin‐prolongation of the QTc interval is longer in women than in male based on current clinical evidence. The reason being two fold: women have longer baseline QTc interval duration 57 and their smaller body size might be associated with higher drug concentration (same drug intake).
Limitations of the Study
In our analysis, we did not compare single‐beat QT interval measurements between methods rather we compared the average QT interval measurement for a given ECG tracing. One would emphasize that the mean QT interval measurement for a given ECG could have been realized on a different number of beats and may generate noise in the comparative analysis.
The criteria used to identify “abnormal” values for the QT and RR interval measurements were not evaluated to optimize the precision of the QT interval while minimizing the human interaction. One may emphasize that a sensitivity analysis would be required to provide optimal thresholds for these criteria. In addition, we did not have access to the QT measurements used as a reference namely, the FDA‐submitted QT. Access to these data would have help us to better understand some of the minor differences we have pointed out in our analysis. Also, our statistical approach for the identification of outlying values is based on data from the overall 7 studies consequently the reported percentage of measurements to correct may not be representative of the percentage for a given study, the quality of the data may not be the same in all studies. Finally, the validation of the QT method describe in this report is valid in the context of ECGs recorded during TQT studies in which ECGs were recorded in healthy individuals with normal T‐wave shapes. The ability of the method to provide same level of precision in ECG from cardiac patients with abnormal T‐wave morphology is not demonstrated in this report.
CONCLUSIONS
In conclusion, our analysis is a unique validation study in which a highly automatic QT method was compared to a large set of FDA‐approved QT measurements from 7 TQT studies. Our investigation suggests that automatic methods can be used in TQT studies. Interestingly, the FDA does not exclude the use of highly automatic or fully automatic methods to measure the QT interval from surface ECGs in TQT studies as long as the method used can demonstrate assay sensitivity. Yet, these methods are not broadly used even if their precision has been increasingly demonstrated to be appropriate in various independent studies. As far as the authors know, our analysis is the largest validation ever conducted in collaboration with FDA for evaluating the validity of a QT measurement technique in TQT studies.
Acknowledgments
Acknowledgment: We would like to thank Dr. Norman Stockbridge, Director of the Cardiovascular and Renal Products of the Center for Drug Evaluation and Research of the Food and Drug Administration for his continuous support.
This work was funded by the National Institute for Health through the R01HL084402 award.
REFERENCES
- 1. Roden DM. Drug‐induced prolongation of the QT interval. N Engl J Med 2004;350:1013–1022. [DOI] [PubMed] [Google Scholar]
- 2. Chen X, Cass JD, Bradley JA, et al QT prolongation and proarrhythmia by moxifloxacin: Concordance of preclinical models in relation to clinical outcome. Br J Pharmacol 2005;146:792–799. [DOI] [PMC free article] [PubMed] [Google Scholar]
- 3. Hoffmann M, Himmel HM, Kubitza D. Moxifloxacin: Translating preclinical findings into QT‐prolongation detectable in human thorough QT/QTC studies. J Pharmacol Toxicol Methods 2008;58:158 (abstract). [Google Scholar]
- 4. Bloomfield DM, Kost JT, Ghosh K, et al The effect of moxifloxacin on QTc and implications for the design of thorough QT studies. Clin Pharmacol Ther 2008. ;84:475–480. [DOI] [PubMed] [Google Scholar]
- 5. Rosillon D, Astruc B, Hulhoven R, et al Effect of brivaracetam on cardiac repolarisation–a thorough QT study. Curr Med Res Opin 2008;24:2327–2337. [DOI] [PubMed] [Google Scholar]
- 6. Iwamoto M, Kost JT, Mistry GC, et al Raltegravir thorough QT/QTc study: A single supratherapeutic dose of raltegravir does not prolong the QTcF interval. J Clin Pharmacol 2008;48:726–733. [DOI] [PubMed] [Google Scholar]
- 7. Davis JD, Hackman F, Layton G, et al Effect of single doses of maraviroc on the QT/QTc interval in healthy subjects. Br J Clin Pharmacol 2008;65(Suppl 1):68–75. [DOI] [PMC free article] [PubMed] [Google Scholar]
- 8. Hulhoven R, Rosillon D, Bridson WE, et al Effect of levetiracetam on cardiac repolarization in healthy subjects: A single‐dose, randomized, placebo‐ and active‐controlled, four‐way crossover study. Clin Ther 2008;30:260–270. [DOI] [PubMed] [Google Scholar]
- 9. Kubitza D, Mueck W, Becka M. Randomized, double‐blind, crossover study to investigate the effect of rivaroxaban on QT‐interval prolongation. Drug Saf 2008;31:67–77. [DOI] [PubMed] [Google Scholar]
- 10. Morganroth J, Ilson BE, Shaddinger BC, et al Evaluation of vardenafil and sildenafil on cardiac repolarization. Am J Cardiol 2004;93:1378–1383, A6 (abstract). [DOI] [PubMed] [Google Scholar]
- 11. Noel GJ, Natarajan J, Chien S, et al Effects of three fluoroquinolones on QT interval in healthy adults after single doses. Clin Pharmacol Ther 2003;73:292–303. [DOI] [PubMed] [Google Scholar]
- 12. Couderc JP, McNitt S, Hyrien O, et al Improving the detection of subtle i(kr)‐inhibition: Assessing electrocardiographic abnormalities of repolarization induced by moxifloxacin. Drug Saf 2008;31:249–260. [DOI] [PubMed] [Google Scholar]
- 13. Dale KM, Lertsburapa K, Kluger J, et al Moxifloxacin and torsade de pointes. Ann Pharmacother 2007;41:336–340. [DOI] [PubMed] [Google Scholar]
- 14. Sherazi S, DiSalle M, Daubert JP, et al Moxifloxacin‐induced torsades de pointes. Cardiol J 2008;15:71–73. [PubMed] [Google Scholar]
- 15. ICH Harmonization Tripartie Guideline E14 . The clinical evaluation of QT/QTc interval prolongation and proarrhythmic potential for non‐antiarrhythmic drugs. http://www.fda.gov/cder/guidance/6885fnl.htm; Accessed March 21, 2007.
- 16. Porta A, Baselli G, Lombardi F, et al Performance assessment of standard algorithms for dynamic R‐T interval measurement: Comparison between R‐Tapex and R‐T(end) approach. Med Biol Eng Comput 1998;36:35–42. [DOI] [PubMed] [Google Scholar]
- 17. Darpo B, Agin M, Kazierad DJ, et al Man versus machine: Is there an optimal method for QT measurements in thorough QT studies? J Clin Pharmacol 2006;46:598–612. [DOI] [PubMed] [Google Scholar]
- 18. Hnatkova K, Gang Y, Batchvarov VN, et al Precision of QT interval measurement by advanced electrocardiographic equipment. Pacing Clin Electrophysiol 2006;29:1277–1284. [DOI] [PubMed] [Google Scholar]
- 19. Couderc JP, Zareba W. An update on QT measurement and interpretation methodologies. Ann Noninvasive Electrocardiol 2009;14(Suppl 1):S1–S2. [DOI] [PMC free article] [PubMed] [Google Scholar]
- 20. Kors JA, van HG. Methodology of QT‐interval measurement in the modular ECG analysis system (MEANS). Ann Noninvasive Electrocardiol 2009;14(Suppl 1):S48–S53. [DOI] [PMC free article] [PubMed] [Google Scholar]
- 21. Zhou SH, Helfenbein ED, Lindauer JM, et al Philips QT interval measurement algorithms for diagnostic, ambulatory, and patient monitoring ECG applications. Ann Noninvasive Electrocardiol 2009;14(Suppl 1):S3–S8. [DOI] [PMC free article] [PubMed] [Google Scholar]
- 22. Dota CD, Edvardsson N, Skallefell B, et al PC‐Based ECG waveform recognition‐validation of novel software against a reference ECG database. Ann Noninvasive Electrocardiol 2009;14(Suppl 1):S42–S47. [DOI] [PMC free article] [PubMed] [Google Scholar]
- 23. Mortara DW. Automated QT measurement and application to detection of moxifloxacin‐induced changes. Ann Noninvasive Electrocardiol 2009;14(Suppl 1):S30–S34. [DOI] [PMC free article] [PubMed] [Google Scholar]
- 24. Strachan IG, Hughes NP, Poonawala MH, et al Automated QT analysis that learns from cardiologist annotations. Ann Noninvasive Electrocardiol 2009;14(Suppl 1):S9–S21. [DOI] [PMC free article] [PubMed] [Google Scholar]
- 25. Xue JQ. Robust QT interval estimation–from algorithm to validation. Ann Noninvasive Electrocardiol 2009;14(Suppl 1):S35–S41. [DOI] [PMC free article] [PubMed] [Google Scholar]
- 26. Lepeschkin E, Surawicz B. The measurement of the Q‐T interval of the electrocardiogram. Circulation 1952;6:378–388. [DOI] [PubMed] [Google Scholar]
- 27. Goldenberg I, Moss AJ, Zareba W. QT interval: How to measure it and what is “normal.” J Cardiovasc Electrophysiol 2006;17:333–336. [DOI] [PubMed] [Google Scholar]
- 28. Malik M. Problems of heart rate correction in assessment of drug‐induced QT interval prolongation. J Cardiovasc Electrophysiol 2001;12:411–420. [DOI] [PubMed] [Google Scholar]
- 29. Malik M. The imprecision in heart rate correction may lead to artificial observations of drug induced QT interval changes. Pacing Clin Electrophysiol 2002;25:209–216. [DOI] [PubMed] [Google Scholar]
- 30. Fridericia LS. Die Systolendauer im Elekrokardiogramm bei normalen Menschen und bei Herzkranken. Acta Med Scand 1920;53:469–486. [Google Scholar]
- 31. Garnett CE, Beasley N, Bhattaram VA, et al Concentration‐QT relationships play a key role in the evaluation of proarrhythmic risk during regulatory review. J Clin Pharmacol 2008;48:13–18. [DOI] [PubMed] [Google Scholar]
- 32. McLaughlin NB, Campbell RW, Murray A. Comparison of automatic QT measurement techniques in the normal 12 lead electrocardiogram. Br Heart J 1995;74:84–89. [DOI] [PMC free article] [PubMed] [Google Scholar]
- 33. McLaughlin NB, Campbell RW, Murray A. Accuracy of four automatic QT measurement techniques in cardiac patients and healthy subjects. Heart 1996;76:422–426. [DOI] [PMC free article] [PubMed] [Google Scholar]
- 34. Bland JM, Altman DG. Measuring agreement in method comparison studies. Stat Methods Med Res 1999;8:135–160. [DOI] [PubMed] [Google Scholar]
- 35. Garnett CE, Beasley N, Bhattaram VA, et al Concentration‐QT relationships play a key role in the evaluation of proarrhythmic risk during regulatory review. J Clin Pharmacol 2008;48:13–18. [DOI] [PubMed] [Google Scholar]
- 36. Hulhoven R, Rosillon D, Letiexhe M, et al Levocetirizine does not prolong the QT/QTc interval in healthy subjects: Results from a thorough QT study. Eur J Clin Pharmacol 2007;63:1011–1017. [DOI] [PubMed] [Google Scholar]
- 37. Malhotra BK, Glue P, Sweeney K, et al Thorough QT study with recommended and supratherapeutic doses of tolterodine. Clin Pharmacol Ther 2007;81:377–385. [DOI] [PubMed] [Google Scholar]
- 38. Rosillon D, Astruc B, Hulhoven R, et al Effect of brivaracetam on cardiac repolarisation–a thorough QT study. Curr Med Res Opin 2008;24:2327–2337. [DOI] [PubMed] [Google Scholar]
- 39. Hulhoven R, Rosillon D, Bridson WE, et al Effect of levetiracetam on cardiac repolarization in healthy subjects: A single‐dose, randomized, placebo‐ and active‐controlled, four‐way crossover study. Clin Ther 2008;30:260–270. [DOI] [PubMed] [Google Scholar]
- 40. Kubitza D, Mueck W, Becka M. Randomized, double‐blind, crossover study to investigate the effect of rivaroxaban on QT‐interval prolongation. Drug Saf 2008;31:67–77. [DOI] [PubMed] [Google Scholar]
- 41. Davis JD, Hackman F, Layton G, et al Effect of single doses of maraviroc on the QT/QTc interval in healthy subjects. Br J Clin Pharmacol 2008;65(Suppl 1):68–75. [DOI] [PMC free article] [PubMed] [Google Scholar]
- 42. Davis JD, Hackman F, Layton G, et al Effect of single doses of maraviroc on the QT/QTc interval in healthy subjects. Br J Clin Pharmacol 2008;65(Suppl 1):68–75. [DOI] [PMC free article] [PubMed] [Google Scholar]
- 43. Malhotra BK, Glue P, Sweeney K, et al Thorough QT study with recommended and supratherapeutic doses of tolterodine. Clin Pharmacol Ther 2007;81:377–385. [DOI] [PubMed] [Google Scholar]
- 44. Darpo B, Agin M, Kazierad DJ, et al Man versus machine: Is there an optimal method for QT measurements in thorough QT studies? J Clin Pharmacol 2006;46:598–612. [DOI] [PubMed] [Google Scholar]
- 45. Halamek J, Jurak P, Villa M, et al Dynamic coupling between heart rate and ventricular repolarisation. Biomed Tech (Berl) 2007;52:255–263. [DOI] [PubMed] [Google Scholar]
- 46. Pueyo E, Malik M, Laguna P. Beat‐to‐beat Adaptation of QT Interval to Heart Rate. Conf Proc IEEE Eng Med Biol Soc 2005;3:2475–2478. [DOI] [PubMed] [Google Scholar]
- 47. Couderc JP, Vaglio M, Xia X, et al Impaired T‐amplitude adaptation to heart rate characterizes I(Kr) inhibition in the congenital and acquired forms of the long QT syndrome. J Cardiovasc Electrophysiol 2007;18:1299–1305. [DOI] [PubMed] [Google Scholar]
- 48. Fossa AA, Wisialowski T, Crimin K, et al Analyses of dynamic beat‐to‐beat QT‐TQ interval (ECG restitution) changes in humans under normal sinus rhythm and prior to an event of torsades de pointes during QT prolongation caused by sotalol. Ann Noninvasive Electrocardiol 2007;12:338–348. [DOI] [PMC free article] [PubMed] [Google Scholar]
- 49. Badilini F, Maison‐Blanche P, Childers R, et al QT interval analysis on ambulatory electrocardiogram recordings: A selective beat averaging approach. Med Biol Eng Comput 1999;37:71–79. [DOI] [PubMed] [Google Scholar]
- 50. Darpo B, Agin M, Kazierad DJ, et al Man versus machine: Is there an optimal method for QT measurements in thorough QT studies? J Clin Pharmacol 2006;46:598–612. [DOI] [PubMed] [Google Scholar]
- 51. Davis JD, Hackman F, Layton G, et al Effect of single doses of maraviroc on the QT/QTc interval in healthy subjects. Br J Clin Pharmacol 2008;65(Suppl 1):68–75. [DOI] [PMC free article] [PubMed] [Google Scholar]
- 52. Mortara DW. Automated QT measurement and application to detection of moxifloxacin‐induced changes. Ann Noninvasive Electrocardiol 2009;14(Suppl 1):S30–S34. [DOI] [PMC free article] [PubMed] [Google Scholar]
- 53. Hnatkova K, Gang Y, Batchvarov VN, et al Precision of QT interval measurement by advanced electrocardiographic equipment. Pacing Clin Electrophysiol 2006;29:1277–1284. [DOI] [PubMed] [Google Scholar]
- 54. Badilini F, Vaglio M, Dubois R, et al Automatic analysis of cardiac repolarization morphology using Gaussian mesa function modeling. J Electrocardiol 2008;41:588–594. [DOI] [PubMed] [Google Scholar]
- 55. Andersen MP, Xue JQ, Graff C, et al New descriptors of T‐wave morphology are independent of heart rate. J Electrocardiol 2008;41:557–561. [DOI] [PubMed] [Google Scholar]
- 56. Couderc JP, Kaab S, Hinterseer M, et al Baseline values and sotalol‐induced changes of ventricular repolarization duration, heterogeneity, and instability in patients with a history of drug‐induced torsades de pointes. J Clin Pharmacol 2009;49:6–16. [DOI] [PubMed] [Google Scholar]
- 57. Stramba‐Badiale M, Locati EH, Martinelli A, et al Gender and the relationship between ventricular repolarization and cardiac cycle length during 24‐h Holter recordings. Eur Heart J 1997;18:1000–1006. [DOI] [PubMed] [Google Scholar]