Abstract
Purpose
To introduce and evaluate a method of prospective motion correction for localized proton magnetic resonance spectroscopy (1H-MRS), using a single-camera optical tracking system.
Materials and Methods
Five healthy participants were scanned at 3T using a PRESS sequence with a motion tracking module and phase navigator. Head motion in six degrees was tracked with a Retro-Grate Reflector (RGR) tracking system and target via a mirror mounted inside the bore. Participants performed a series of three predetermined motion patterns during scanning.
Results
Left-right rotation (Rz) (average 12°) resulted in an increase in the total Choline to total Creatine ratio (Cho/Cr) of +14.6±1.5% [p=0.0009] for scans without correction, but no change for scans with correction (+1.1±1.5%; p=0.76). Spectra with uncorrected Z-translations showed large lipid peaks (skull) with changes in Cho/Cr of −13.2±1.6% (p=0.02, no motion correction) and −2.2±2.4% (p=0.51) with correction enabled. There were no significant changes in the ratios of N-acetylaspartate, Glutamate+Glutamine, or Myo-inositol to Creatine compared to baseline scans for all experiments.
Conclusion
Prospective motion correction for 1H-MRS, using single-camera RGR tracking, can reduce spectral artifacts and quantitation errors in Cho/Cr ratios due to head motion, and promises improved spectral quality and reproducibility.
Keywords: Prospective Motion Correction, MRS, Optical Tracking, Spectral Artifacts
INTRODUCTION
Proton magnetic resonance spectroscopy (1H-MRS) is an important tool in both research and clinical settings. Like magnetic resonance imaging (MRI), 1H-MRS is susceptible to artifacts and distortions due to physiological motion. Motion artifacts are visually easy to detect in MR images, but identifying distortions in MRS spectra can be more challenging. Typically, the quality of spectra is identified by the signal-to-noise ratio (SNR), line width / peak separation, and spectral baseline (1). During bulk head motion, MRS spectra may show reduced peak amplitudes, shifts in frequency and phase, decreased quality in water suppression and errors in voxel location (1). Long scan times increase the probability of head movements, compounded by studies in uncooperative subjects, children, or patients with medical conditions such as Parkinson’s disease and other movement disorders (2). Therefore, motion correction for 1H-MRS in the brain is desirable for unintentional as well as physiological motion.
A variety prospective and retrospective motion-correction methods for MRI and MRS have been proposed, including infrared stereovision optical tracking (3,4), in-bore optical systems (5,6), PROPELLER (7), PROMO (spiral) (8,9), and orbital (10) and Echo Planar Imaging (EPI) (11) based navigators. In addition, methods which correct artifacts due to phase fluctuations can attenuate the effects of subject motion in MRS (12,13); however, these methods do not correct for errors in the position of the imaging (voxel) volume. Here we used a single-camera Retro-Grate Reflector (RGR) based tracking system (14) for prospective motion correction during 1H-MRS. Spectra were acquired with a PRESS (15) sequence with an additional tracking module to ensure that the voxel position remained fixed relative to the initial brain orientation, and a phase navigator with water suppression cycling (16) allowed shot-to-shot phase and frequency correction.
METHODS
Motion Tracking
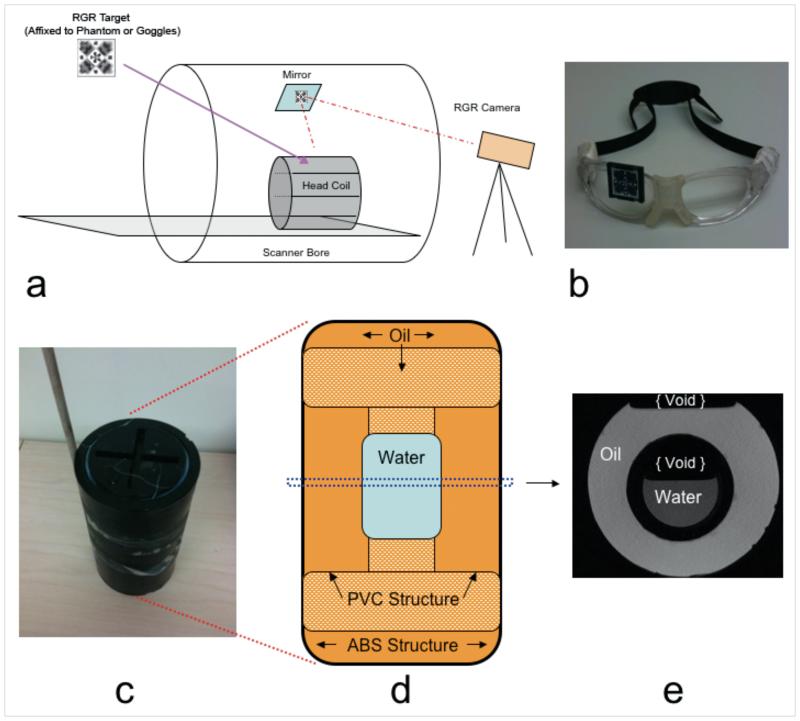
Motion tracking was performed with a single camera RGR tracking system, mounted at the head end of the scanner approximately 2.4 m from the iso-center (Figure 1a). The RGR tracking system consists of a Prosilica GC 650 camera, a Schneider 70 mm lens, an integrated LED lighting system running at a sampling rate of 10Hz (50Hz flash and 100 us exposure rate) and an RGR tracking marker. The 20×20×1.2mm RGR marker is a multi-layer structure that generates moiré patterns for accurate orientation measurement. A 100×100mm mirror for viewing the RGR marker in the head coil is mounted to a rib support structure, resulting in an image size of 100×100mm. The accuracy of the RGR system is ±0.5mm (translations) and ±0.3° (orientations) (14). Due to the physical dimensions of the mirror and spacing in the head coil, the maximum tracking range (from mirror center) was limited to ~±20mm along the Z-direction with a rotational limit of ~±15° about the Z axis. Six degrees of freedom (6DOF) data (X,Y,Z translations and rotations) were broadcasted over an Ethernet connection, via UDP packets, to the scanner’s real-time controller at a rate of 10 per second.
Figure 1.
(a) RGR tracking setup inside the scanner room. The RGR camera is mounted at the “head” end of the scanner bore, viewing the RGR target via a mirror mounted near the magnet iso-center. For in vivo scans, the RGR target was mounted on sports goggles (b). For phantom scans, the RGR target was mounted on the oil & water phantom shown in (c); a wooden rod was used to move the phantom during test scans. (d) Inside structure of phantom consisting of a center compartment of water, suspended by a PVC hollow support structure filled. Both the PVC support and remaining surrounding volume are filled with vegetable oil. (e) Center axial T1-weighted MRI of the phantom.
The RGR camera and target were calibrated at the Image Metrology facility of the University of Wisconsin-Milwaukee. To allow conversion between tracking system frame and scanner frame, a cross-calibration was performed to determine the homogeneous transform between the tracking and MR systems (3). For tracking head movement in vivo, an RGR target was affixed to sports goggles (Rec-Specs, USA), which were worn by each subject (Figure 1b).
MRS Sequence
MRS acquisitions were performed with a customized short echo-time (TE) PRESS sequence (repetition time TR/TE = 3000/35ms, 1200Hz bandwidth, 120Hz water suppression band width, 32 excitations) that included a phase navigator and a tracking module. The phase navigator, using water suppression cycling, allowed shot-to-shot frequency and phase correction (16). Water suppression cycling is performed by under-suppressing water on even and over-suppressing on odd acquisitions; the final spectrum summation results in a near-complete cancellation of water signals and eliminates distortions associated with weakly suppressed residual water.
The tracking module allowed communication between the RGR tracking system and the pulse sequence via an Ethernet connection. Pose information (represented as a 4×4 matrix of rotations and translations) of the target was read by the pulse sequence for every TR period immediately after the water suppression module / phase navigator. Since the most recent tracking packet was used to adjust scan planes (rotations and translations), the adjusted head position in the pulse sequence typically lagged less than 100ms behind the true head pose. Using the 4×4 homogeneous transform from magnet to camera coordinates (from the cross-calibration procedure), the voxel pose at time t in the scanner’s logical coordinates was then calculated as:
where is the 4×4 homogeneous transform from the RGR marker to the imaging volume and is the measured pose of the tracking marker at time t. Relative change of the target () is calculated and the new voxel pose updated by recalculating and adjusting the frequency offset of the RF pulses and the gradient rotation matrix. After updating the new voxel position and orientation, the PRESS sequence is continued. At the end of each TR period, the UDP receiver buffers were flushed to avoid scanner instabilities.
Phantom Testing
An oil-water phantom was constructed to validate the tracking module. Figure 1(c-e) shows the external and internal phantom construction, and a central T1 weighted axial MRI scan. An Acrylonitrile Butadiene Styrene (ABS) plastic pipe (100×200mm), terminated with two 100mm threaded caps, was used for the outside structure (Figure 1d). An inside structure consisting of 38mm Polyvinyl Chloride (PVC) piping supports a central sealed volume (~ 60 ml) of distilled water (Figure 1e). The inner PVC structure and surrounding volume were filled with cooking vegetable oil. An RGR target was mounted on the side of the phantom, in the viewing range of the mirror and camera. In addition to the RGR target, a wooden rod was attached to the phantom, allowing manual manipulation during scanning. The previously described PRESS sequence was used for scanning, both with and without motion correction, during three different motion patterns: Z-translation, X rotation, and a combination X and Y translation. Initially the voxel was placed in the central water volume, but with an offset from the center of rotation. Motion was manually induced at approximately the 12th excitation. Phase and frequency correction was not applied for phantom data sets, as water suppression was disabled. Phantom data were processed in MATLAB and peak water and lipid areas of all spectra were determined by integration over frequencies determined from baseline compartment scans.
In Vivo Protocol
Five healthy participants (4 males, 1 female, ages 30 – 54 years) performed a series of pre-determined head movement patterns within the 12-channel matrix head coil on a 3T Trio scanner (Siemens Healthcare, Erlangen, Germany). All subjects provided verbal and written consent, using a consent form approved by our local Institutional Review Board. Each subject also underwent a medical screening to ensure they were healthy and able to enter the scanner safely. Each volunteer performed four sets of experiments, each consisting of two scans (motion correction disabled and enabled) and a specific motion pattern. Each set included a no-motion baseline scan, a Z-translation from head to foot direction and a right lateral rotation (Rz). Before every baseline scan, the voxel was positioned and manually shimmed. For the Z-translation, the initial voxel location was near the top of the brain. Subjects were instructed to slowly move down towards the +Z direction during scans. For the right lateral motion, the initial voxel placement was the in medial frontal gray matter. Subjects were instructed to pre-tilt their head towards the left limit of the visual field available for the RGR system as seen through the mirror and the head coil to increase the total rotational distance achieved.
Data and Statistical Analysis
Data were processed using custom functions in MATLAB (16) and LCModel (17) for metabolite quantification. Paired t-tests were performed on concentration ratios processed from scans with and without motion correction. Metabolite ratios of interest included Choline/Creatine (Cho/Cr), N-acetylaspartate/Creatine (NAA/Cr), Glutamate+Glutamine / Creatine (Glx/Cr) and Myo-inositol/Creatine (mI/Cr).
RESULTS
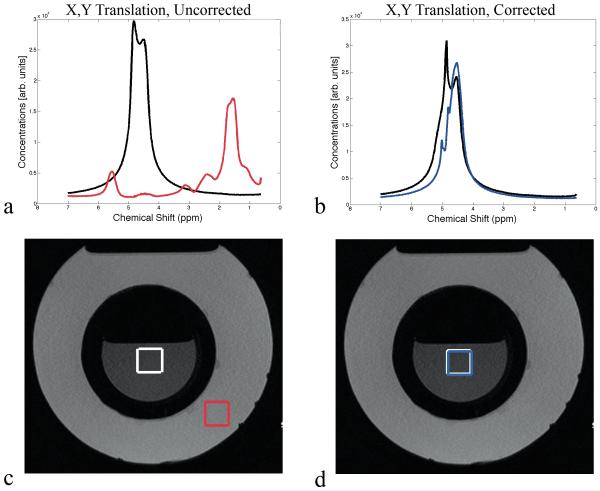
Figure 2 shows results from the phantom measurements. The voxel was initially placed in the center of the water container, resulting in a water peak at 4.7ppm prior to movement with no lipid contamination (Figure 2a). Without motion correction, the X/Y translation caused a shift towards the lipid spectrum (18) (Figure 2c). The peak area for water decreased by 95% while the lipid peak area increased by 565% compared to the baseline scan. With motion correction enabled, both the water and lipid peak areas were essentially unchanged (−2% and +0.7% change; Figure 2b). During the Rx rotation, the peak area for water decreased by 63% while lipid peak area increased by 146% compared to the baseline scan (no correction). In contrast, spectra acquired with motion correction recovered most of the water peak area (loss of 8%) with no visible contamination (gain of 0.1% lipid peak area). The Z-translation also caused a decrease in water peak area of 58% with an increase in lipid peak area of 584% compared to baseline (no motion correction). With motion correction enabled, the water peak area was maintained (7% decrease) with negligible change in lipid peak area of 1% (i.e. no visible lipid).
Figure 2.
(a) Spectra of first (black) and last (red) FID of a scan acquired without motion correction during manual movement of the oil & water phantom. (c) Corresponding voxel positions before (white) and after (red) movement. (b) Spectra of first (black) and last (blue) average of a scan acquired with motion correction during manual movement of the oil & water phantom. (d) Corresponding voxel positions before (white) and after (blue) movement. All acquisitions had water suppression disabled.
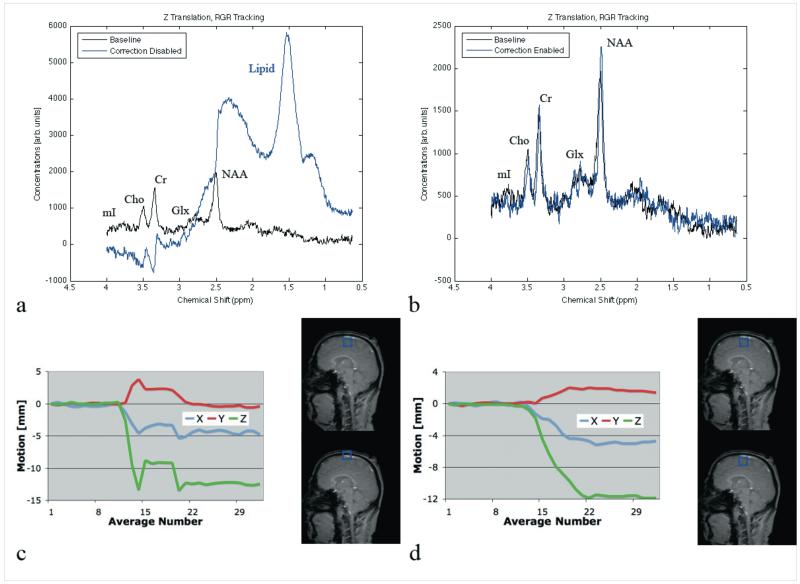
Figure 3 shows in vivo spectra at baseline (black), with motion correction disabled (blue) and motion correction enabled (red) during a Z-translation. The initial voxel was located near the skull in the superior frontal gyrus. During this particular MRS acquisition, the overall Z translation was 13 mm, with some X translation (5mm) but minimal Y-translation (Figure 3b). Without motion correction, large lipid peaks (1.5 and 2.3 ppm) become visible (Figure 3a), which is consistent with lipid introduction due to the skull. Without mmotion correction, the average change [± standard error] in Cho/Cr levels across all 5 subjects was −13.2±1.6% (p=0.02) compared to baseline. In contrast, no lipid peaks are present when motion correction is active (Figure 3c), with minimal Cho/Cr changes (−2.2±2.4%; p=0.51). All other metabolite changes were not significant. Test-retest variability in Cho/Cr between all subject’s baseline scans (no-motion case) was 4.0±1.3%. Of note, the magnitude of motion for the Z translation with motion correction was similar to that of the acquisition without motion correction (11mm; Figure 3d).
Figure 3.
(a) Spectra of baseline (black) and non-motion corrected (blue) acquisitions, with corresponding motion plots (c). (b) Spectra of baseline (black) and motion-corrected (blue) acquisitions, with corresponding motion plots (d).
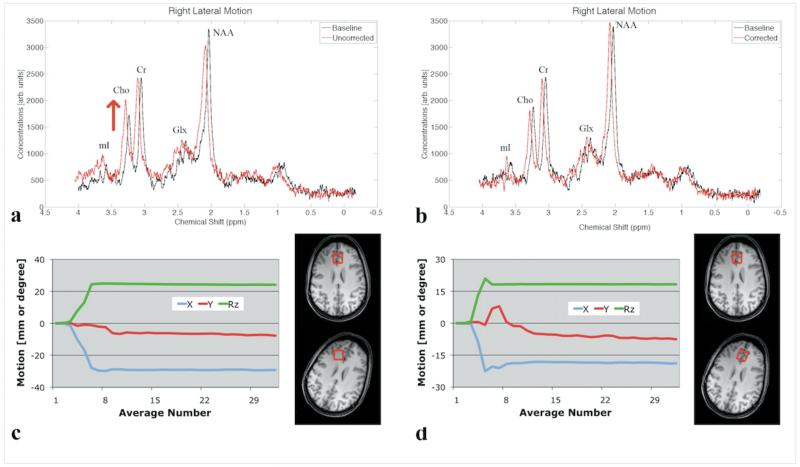
Tracking data for lateral rotations demonstrate an average rotation angle (Rz) of 12.5° ± 5° and some associated X and Y translations, with no substantial difference between scans with and without correction. Figure 4 shows spectra from a single participant during a right lateral rotation. The spectrum acquired during motion without correction shows an increase in the Cho peak, and a decrease in Cr and NAA, compared to the baseline scan (Figure 4a). Conversely, the spectrum acquired with motion correction shows no apparent difference to baseline (Figure 4b). Across the 5 subjects, the average change [± standard error] in Cho/Cr was +14.6 ± 1.5% (p=0.0009) for scans without and +1.1±1.5% (p=0.76) for scans with motion correction (Table 1). All other changes in metabolite ratios were not significant (Table 1). Variability in Cho/Cr between all subject’s baseline scans (no-motion case) was 7.6±9.5%. In addition, the average SNR decreased for both uncorrected (−17.3±5.5%) and corrected (−8.2±6.2%) scans compared to baseline acquisitions (Table 1). Average FWHM increased during both uncorrected (23.6±3.9%) and corrected (10.6±8.4%) acquisitions as compared to the respective baseline scans (Table 1).
Figure 4.
(a) Baseline (black) and non-motion corrected (red) spectra during right lateral rotation and (c) corresponding motion plots and voxel position. (b) Baseline (black) and motion-corrected (red) spectra during right lateral rotation and (d) corresponding motion plots and corrected voxel position. Spectra acquired during motion-scans (in red) are shifted by 0.05 ppm for better visualization, and are scaled to match the Cr peak height of the baseline spectrum.
Table 1.
Average percent change from baseline scan (no intentional motion) across subjects (mean change and standard deviation)
| Ratio |
No Motion Correction (NoMC) |
Motion Correction (MC) |
p value | |
|---|---|---|---|---|
| Z-Translation | average percent change (standard error) | NoMC to MC | Baseline to MC | |
|
|
||||
| Cho/Cr | −13.16%(1.57%) | −2.19%(2.44%) | 0.11 | 0.51 |
| NAA/Cr | −5.19%(6.01%) | −1.78%(3.89%) | 0.76 | 0.74 |
| Glx/Cr | 8.96%(19.42%) | −12.77%(6.42%) | 0.31 | 0.23 |
| mI/Cr | 1.44%(13.43%) | 7.74%(18.09%) | 0.81 | 0.66 |
| SNR | −6.99%(5.34%) | −10.47%(6.46%) | 0.72 | 0.24 |
| FWHM | 1.19%(12.78%) | 5.29%(10.26%) | 0.35 | 0.48 |
|
| ||||
| Rz-Rotation | average percent change (standard error) | NMC to MC | Baseline to MC | |
|
|
||||
| Cho/Cr | 14.64%(1.52%) | 1.07%(1.49%) | 0.0001 | 0.76 |
| NAA/Cr | −0.13%(5.52%) | 1.56%(5.34%) | 0.84 | 0.42 |
| Glx/Cr | −7.28%(3.61%) | −2.52%(9.07%) | 0.68 | 0.71 |
| mI/Cr | 5.37%(11.92%) | 11.44%(7.11%) | 0.64 | 0.20 |
| SNR | −17.26%(5.53%) | −8.22%(6.24%) | 0.21 | 0.24 |
| FWHM | 23.57%(3.92%) | 10.61%(8.38%) | 0.065 | 0.31 |
P-values represent results from a paired t-test from uncorrected (NoMC) to corrected (MC), or baseline to corrected (MC), averages.
DISCUSSION
Our data demonstrate that prospective motion correction for 1H-MRS, using single-camera RGR tracking, can significantly reduce spectral artifacts and quantitation errors due to motion. Importantly, such artifacts and errors in spectra may or may not be easily identifiable visually. Movements that happen to introduce large lipid peaks can be identified readily during visual Quality Assurance, and corrupted scans may be rejected or repeated. However, other movements may change metabolite ratios in a more subtle manner that cannot be detected visually. As demonstrated, spectra acquired without prospective motion correction during movements that change voxel composition, but happen to avoid lipid regions, might appear of good quality, but are acquired from an incorrect brain region and can lead to changes in metabolite ratios, especially in Cho/Cr (19,20). Motion correction did not yield clear improvements in metabolite ratios for other metabolites, including NAA/Cr, Glx/Cr and mI/Cr, most likely due to lower sensitivity of these metabolites to changes in gray-white matter voxel composition compared to Cho/Cr, as well as the relatively small study population. However, the significant change in the Cho/Cr ratio during motion (which have opposite concentration differences between gray and white matter) is consistent with an expected shift in voxel partial volume from gray to white matter during uncorrected scans (19,20). Large motions may also induce frequency shifts and phase fluctuations, and reduce magnetic field homogeneity across the MRS voxel. A phase and frequency navigator makes it possible to restore phase and frequency coherence across excitations, and thereby help restore SNR. In agreement with previous research (4,8) we observed motion-induced deteriorations in both shim and SNR changes for acquisitions with and without motion correction. This highlights the need for dynamic shimming, for instance by updating linear shims, which was not implemented in this study.
The current work relied on optical tracking of head motion, which allows for relatively fast updates of voxel position, thereby minimizing the error caused by the delay between motion detection and application of corrected slice selective RF pulses inherent in navigator based sequences (8,9). While the RGR sampling rate of 10Hz was lower than that of a prior study using stereovision (4) it was sufficient for the relatively slow lateral motions and translations used, and ensured that the lag time between voxel pose updates and true pose was typically 100ms or less. Of note, smaller movements during the data acquisition window affect spectral quality only minimally, since no readout gradients are present and the receiver coil(s) detect the net transverse magnetization from within the original voxel. Future revisions of the RGR hardware and software will allow a sampling rate exceeding 90Hz, reducing potential tracking errors during faster movements.
One of the issues with any external tracking systems is the fixation of the tracking marker to the head. Due to the camera location at the head end of the scanner and use of a mirror, sports goggles may be used in lieu of other fixation devices, such as a bite-bar commonly used with stereovision based tracking (3,4) which reduced errors due to swallowing and fatigue. Although the RGR system has a more restrictive range of allowable motion compared to stereovision, due to the head coil’s structure blocking the target from the imager’s view and the use of a mirror, the range of motion was sufficient for unintentional and most intentional motions.
In conclusion, prospective motion correction, using a single-camera RGR based system, significantly increased quality of localized 1H MR spectra by eliminating lipid contamination and reducing localization errors during subject motion. These techniques will be especially helpful for studies involving MRS in children and patients with movement disorders.
ACKNOWLEDGEMENTS
The authors would like to thank Todd Kusik and Rob Barrows at the University of Wisconsin Milwaukee, for their technical expertise and support. We’d also like to thank Drs. Brian Keating, Kazim Gumus, Linda Chang and Steve Buchthal at John. A. Burns School of Medicine, University of Hawaii, for their valuable feedback and support during this work.
This project was supported by NIH grants 1R01 DA021146 (TE), U54 56883 (SNRP), and G12 RR003061-21 (RCMI).
REFERENCES
- 1.Kreis R. Issues of spectral quality in clinical 1H-magnetic resonance spectroscopy and a gallery of artifacts. NMR Biomed. 2004;17(6):361–381. doi: 10.1002/nbm.891. [DOI] [PubMed] [Google Scholar]
- 2.Adler CH, Ahlskog JE. Parkinson’s disease and movement disorders: diagnosis and treatment guidelines for the practicing physician. 1st edition Humana Press; Totowa, N.J.: 2000. p. 474. [Google Scholar]
- 3.Zaitsev M, Dold C, Sakas G, Hennig J, Speck O. Magnetic resonance imaging of freely moving objects: prospective real-time motion correction using an external optical motion tracking system. Neuroimage. 2006;31(3):1038–1050. doi: 10.1016/j.neuroimage.2006.01.039. [DOI] [PubMed] [Google Scholar]
- 4.Zaitsev M, Speck O, Hennig J, Buchert M. Single-voxel MRS with prospective motion correction and retrospective frequency correction. NMR Biomed. 2010;23(3):325–332. doi: 10.1002/nbm.1469. [DOI] [PubMed] [Google Scholar]
- 5.Aksoy M, Newbould R, Straka M, et al. A real time optical motion correction system using a single camera and 2D marker; Proceedings of the 16th Annual Meeting of ISMRM; Toronto. 2008; abstract 3120. [Google Scholar]
- 6.Qin L, van Gelderen P, Derbyshire JA, et al. Prospective head-movement correction for high-resolution MRI using an in-bore optical tracking system. Magn Reson Med. 2009;62(4):924–934. doi: 10.1002/mrm.22076. [DOI] [PMC free article] [PubMed] [Google Scholar]
- 7.Pipe JG. Motion correction with PROPELLER MRI: application to head motion and free-breathing cardiac imaging. Magn Reson Med. 1999;42(5):963–969. doi: 10.1002/(sici)1522-2594(199911)42:5<963::aid-mrm17>3.0.co;2-l. [DOI] [PubMed] [Google Scholar]
- 8.Keating B, Deng W, Roddey JC, et al. Prospective motion correction for single-voxel 1H MR spectroscopy. Magn Reson Med. 2010;64(3):672–679. doi: 10.1002/mrm.22448. [DOI] [PMC free article] [PubMed] [Google Scholar]
- 9.White N, Roddey C, Shankaranarayanan A, et al. PROMO: Real-time prospective motion correction in MRI using image-based tracking. Magn Reson Med. 2010;63(1):91–105. doi: 10.1002/mrm.22176. [DOI] [PMC free article] [PubMed] [Google Scholar]
- 10.Fu ZW, Wang Y, Grimm RC, et al. Orbital navigator echoes for motion measurements in magnetic resonance imaging. Magn Reson Med. 1995;34(5):746–753. doi: 10.1002/mrm.1910340514. [DOI] [PubMed] [Google Scholar]
- 11.Tisdall M, Hess A, Van der Kouwe A. Prospecitve motion correction of anatomical brain sequences using EPI navigators; ISMRM Workshop Series 2010, Current Concepts of Motion Correction for MRI & MRS; Kitzbuhel. 2010; Feb. 27, 11:30-11:40. [Google Scholar]
- 12.Gabr RE, Sathyanarayana S, Schar M, Weiss RG, Bottomley PA. On restoring motion-induced signal loss in single-voxel magnetic resonance spectra. Magn Reson Med. 2006;56(4):754–760. doi: 10.1002/mrm.21015. [DOI] [PMC free article] [PubMed] [Google Scholar]
- 13.Star-Lack JM, Adalsteinsson E, Gold GE, Ikeda DM, Spielman DM. Motion correction and lipid suppression for 1H magnetic resonance spectroscopy. Magn Reson Med. 2000;43(3):325–330. doi: 10.1002/(sici)1522-2594(200003)43:3<325::aid-mrm1>3.0.co;2-8. [DOI] [PubMed] [Google Scholar]
- 14.Armstrong B, Verron T, Heppe L, Reynolds S, Schimdt K. RGR-3D: Simple, cheap detection of 6-DOF pose for tele-operation, and robot programming and calibration; Proceedings of the ICRA ‘02 International Conference on Robotics and Automation; Washington DC. 2002 May 11-15.pp. 2938–2943. [Google Scholar]
- 15.Bottomley PA. Spatial localization in NMR spectroscopy in vivo. Ann N Y Acad Sci. 1987;508:333–348. doi: 10.1111/j.1749-6632.1987.tb32915.x. [DOI] [PubMed] [Google Scholar]
- 16.Ernst T, Li J. A novel phase and frequency navigator for proton magnetic resonance spectroscopy using water-suppression cycling. Magn Reson Med. 2010 doi: 10.1002/mrm.22582. [DOI] [PMC free article] [PubMed] [Google Scholar]
- 17.Provencher SW. Estimation of metabolite concentrations from localized in vivo proton NMR spectra. Magn Reson Med. 1993;30(6):672–679. doi: 10.1002/mrm.1910300604. [DOI] [PubMed] [Google Scholar]
- 18.Knothe G, Kenar J. Determination of the fatty acid profile by 1H-NMR spectroscopy. European Journal of Lipid Science Technology. 2004;106(2):88–96. [Google Scholar]
- 19.Hetherington HP, Pan JW, Mason GF, et al. Quantitative 1H spectroscopic imaging of human brain at 4.1 T using image segmentation. Magn Reson Med. 1996;36(1):21–29. doi: 10.1002/mrm.1910360106. [DOI] [PubMed] [Google Scholar]
- 20.Schuff N, Ezekiel F, Gamst AC, et al. Region and tissue differences of metabolites in normally aged brain using multislice 1H magnetic resonance spectroscopic imaging. Magn Reson Med. 2001;45(5):899–907. doi: 10.1002/mrm.1119. [DOI] [PMC free article] [PubMed] [Google Scholar]


