Abstract
The aims of this study were to validate stiffness estimates of a phantom undergoing cyclic deformation obtained using a multi-phase magnetic resonance elastography (MRE) imaging sequence by comparison with those obtained using a single-phase MRE sequence and to quantify the stability of the multi-phase-derived stiffness estimates as a function of deformation frequency and imaging parameters. A spherical rubber-shell of 10 cm diameter and 1 cm thickness was connected to a computerized flow pump to produce cyclic pressure variations within the phantom. The phantom was imaged at cyclic pressures between 18–72 bpm using single-phase and multi-phase MRE acquisitions. The shear stiffness of the phantom was resolved using a spherical-shell wave inversion algorithm. Shear stiffness was averaged over the slice of interest and plotted against pressure within the phantom. A linear correlation was observed between stiffness and pressure. Good correlation (R2=0.98) was observed between the stiffness estimates obtained using the standard single-phase and the multi-phase pulse sequences. Stiffness estimates obtained using multi-phase MRE were stable when the fraction of the deformation period required for acquisition of a single image was not greater than 42%. The results demonstrate the potential of multi-phase MRE technique for imaging dynamic organs, such as the heart.
Keywords: Rapid MRE sequence, MRE, Multi-phase MRE, Cardiac MRE
Introduction
The heart’s function of circulating blood throughout the body relies on cyclic pressure variations within its chambers that are the result of the mechanical properties of the myocardium. As such, numerous studies have attempted to quantify the intrinsic mechanical properties of the myocardium under both normal and dysfunctional conditions in order to characterize cardiac diseases such as myocardial infarction (1), hypertension (2), and diastolic dysfunction (3). In particular, myocardial stiffness and left ventricular (LV) chamber stiffness are two quantities researchers have derived in order to characterize these diseases and are calculated from cardiac pressure-volume (P-V) measurements of LV filling (4,5). While these measures have been shown to be useful, they are invasive, requiring direct measurement of cavity pressure, and do not assess the intrinsic mechanical properties of the myocardium (e.g., shear modulus). As such, a direct, spatially resolved, noninvasive technique for measuring intrinsic myocardial mechanical properties in vivo could provide valuable information for assessing a variety of cardiac diseases in which myocardial tissue mechanical properties are thought to be related (6–8).
One approach to noninvasively quantifying the mechanical properties of the myocardium would be to apply a new magnetic resonance (MR) based technique known as MR elastography (MRE; (9–14)) which has been shown to quantify the viscoelastic properties of a variety of tissue-like materials. MRE is able to spatially resolve shear stiffness by first acquiring phase-contrast images of tissue response to periodic stresses in the acoustic frequency range that are the result of external vibrations introduced into the tissue which are in turn synchronized to motion-encoding gradients (MEG) in the imaging sequence. The MEGs can be applied along any of the imaging gradient axes to encode shear wave induced displacements. These displacements are then used to resolve the shear stiffness (μ) of the object under investigation.
Recently, it has been shown that MRE is capable of resolving not only the shear stiffness of static objects but also of objects undergoing periodic deformations (15). In that work, a MRE sequence, gated to pressure variations within the object was compared to standard MRE sequence which imaged the object at specific static pressures induced in the object. These acquisitions were used to provide elasticity information corresponding to different time points (or phases) during the deformation cycle of the dynamic object to compare to the elasticity information obtained at the static pressures. A linear relationship (R2≥ 0.98) was observed between the measured pressure and the calculated shear stiffness, and those stiffness measurements correlated with stiffness values obtained with a previously validated P-V model (16) using both cyclic pressure variations and static pressures in the object. However, that MRE technique was only able to acquire elasticity information at a single point or phase of the pressure cycle. To reproduce the entire cycle, the sequence required repeated acquisitions at different deformation phases, with each acquisition requiring long scan times (i.e. approximately 8.5 minutes to acquire 4 phase offsets for 60 bpm). While this approach is useful for phantom experiments in which the acquisition time is not limited by physiological considerations such as breath-hold duration, its potential application, particularly in humans or animal models, is limited. Therefore, there is a need to develop a rapid multi-phase MRE sequence capable of imaging an object undergoing periodic motion at multiple time points (phases) within a single acquisition. Hence, the objectives of this study were to determine whether stiffness estimates obtained using a multi-phase MRE sequence of an object undergoing cyclic deformation agree with those obtained using a standard, single-phase gated MRE sequence and to determine the stability of the measurements obtained from the multi-phase MRE sequence as a function of frequency of the deformation and the MRE sequence parameter selection.
Theory
Spherical Shell Inversion
To obtain stiffness measurements in a complicated structure such as the heart, current inversion methods (17) are not suitable as they assume an infinite-medium analysis. Therefore, to model the wave propagation in the heart, a spherical geometry assumption was made to invert the propagating waves in a spherical shell to obtain shear stiffness. The equation of motion based on Hamilton’s variational principle (18) assumes no torsional motion (i.e. it neglects the through-plane component of motion when studying the central slice of the shell), which simplifies the equation of motion to solve for the spatial stiffness map. The flexural equation of motion in an isotropic spherical shell is described by Eq. 1 (18) by assuming that the internal radius is greater than the thickness of the shell, where a = shell inner radius, u = circumferential component of displacement, w = radial component of displacement, cp = flexural plate speed (cp2 = E/(1-ν2)ρ), E = Young’s modulus, ρ = density (assumed to be 1 g/cm3), ν = Poisson’s ratio, β2 = h2/12a2, h = thickness of the shell, and pa = applied load. The Young’s modulus obtained from Eq. 1 can be converted to shear stiffness using the relationship μ=E/2(1+ν).
| (1) |
Methods
Experimental Setup
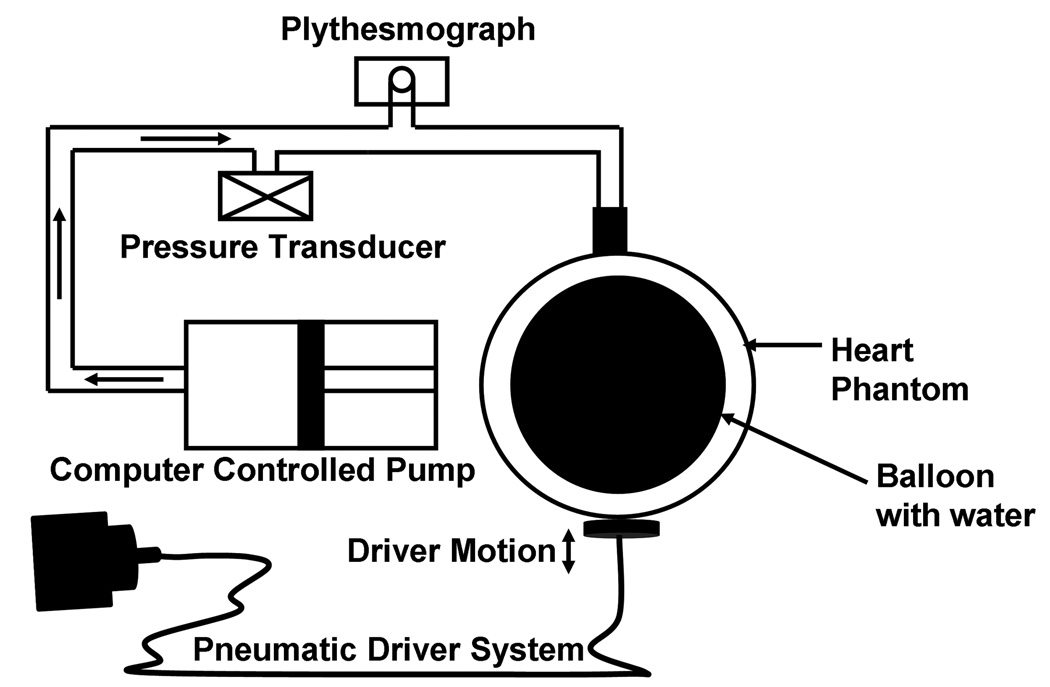
A hollow spherical phantom was constructed with silicone rubber (Wirosil, BEGO, Germany) of 10 cm diameter and 1 cm thick. Figure 1 shows the experimental setup and includes the phantom with a flexible inner bladder filled with water connected to a computer-controlled flow pump (12LBL-1-FM-144, Illinois Pneumatics, Inc, Roscoe, IL). The flow pump system produced programmable periodic pressure variations within the phantom cavity. A pressure transducer (PX26-030GV, Omega Engineering, Inc., Stamford, CT) was used to provide real-time measurements of the line pressure, which was considered to be equal to the pressure within the phantom. An attached pulse plythesmograph produced a waveform which was used to gate the MRE pulse sequences. Synchronized, continuous mechanical stress waves were generated in the phantom by an acoustic driver (14) placed in contact with the bottom surface of the phantom.
Figure 1.
Experimental setup showing the acoustic driver system for generating motion in the phantom and the hydraulic system, including the computer-controlled flow pump, the pressure transducer for recording the in-line pressure, and the plythesmograph for triggering the MRE pulse sequence.
Image Acquisition
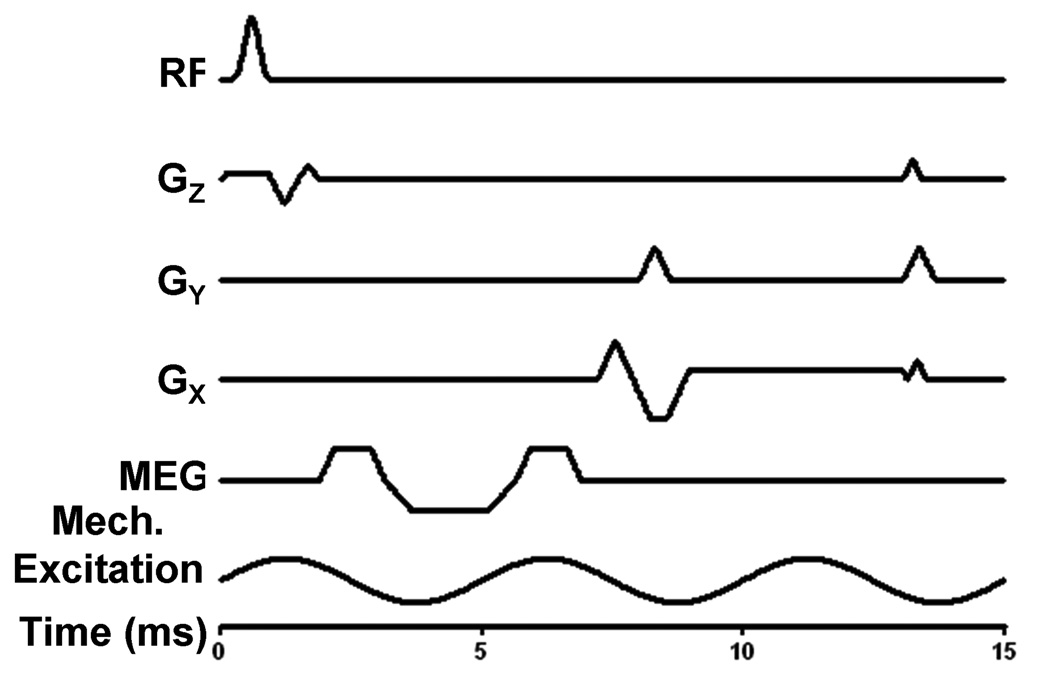
All imaging was performed on a 1.5-Tesla MRI scanner (Signa Excite, GE Health Care, Milwaukee, WI). Both single-phase and multi-phase MRE acquisitions employed the gradient echo (GRE) MRE pulse sequence shown in Figure 2. The pulse sequence is a conventional flow-compensated GRE pulse sequence with the addition of first-order gradient moment nulled MEG waveforms that are synchronized to the source of the continuous mechanical excitations. For all experiments, the frequency of the mechanical excitations was 200 Hz, and the duration of the MEGs was 5 ms. To reduce the possible motion artifacts from the swirling water in the phantom, chemical presaturation was used to saturate the water signal (the chemical shift of water relative to Wirosil at 1.5 T is 290 Hz).
Figure 2.
A gradient echo MRE schematic pulse sequence indicating the RF pulse; X, Y, and Z imaging gradients with flow-compensating gradients shown on X and Z; the first-moment-nulled MEG, which can be applied along any axis; and the continuous mechanical excitation. The time scale, in milliseconds, for the pulse sequence with 200-Hz MEG and 200-Hz excitations is shown. By decreasing the frequency of vibration and increasing the time for the MEGs, the TE and TR becomes longer, which can increase T2 and T2* effects and the scan time.
Validation of Multi-Phase MRE
Single-Phase MRE
Data at a single point within the pressure cycle were acquired with the phantom undergoing cyclic pressure variations (range: 55–90 mmHg) at 18 bpm (0.3 Hz). Data were collected using a single-phase MRE pulse sequence which acquired one line of k-space data per TR per pressure cycle. The single-phase sequence was used to sample 8 temporal phases of the dynamic deformation in separate acquisitions by varying the delay between the trigger from the pulse plythesmograph and the start of the imaging sequence. Imaging parameters included: TE = 10.9 ms; TR = 3333 ms (which is an effective TR since only one view [i.e., one line of k-space] is acquired for every beat of the phantom); flip angle = 30°; slice thickness = 10 mm; acquisition matrix = 256×64; FOV = 14 cm; receiver bandwidth = ±16 kHz; excitation frequency = 200 Hz; 4 MRE time offsets; and 5-ms duration (200 Hz) MEGs applied separately in the×and y directions to measure the in-plane motion. Chemical presaturation, requiring about 15 ms, was performed immediately before the imaging sequence for every TR.
Multi-Phase MRE
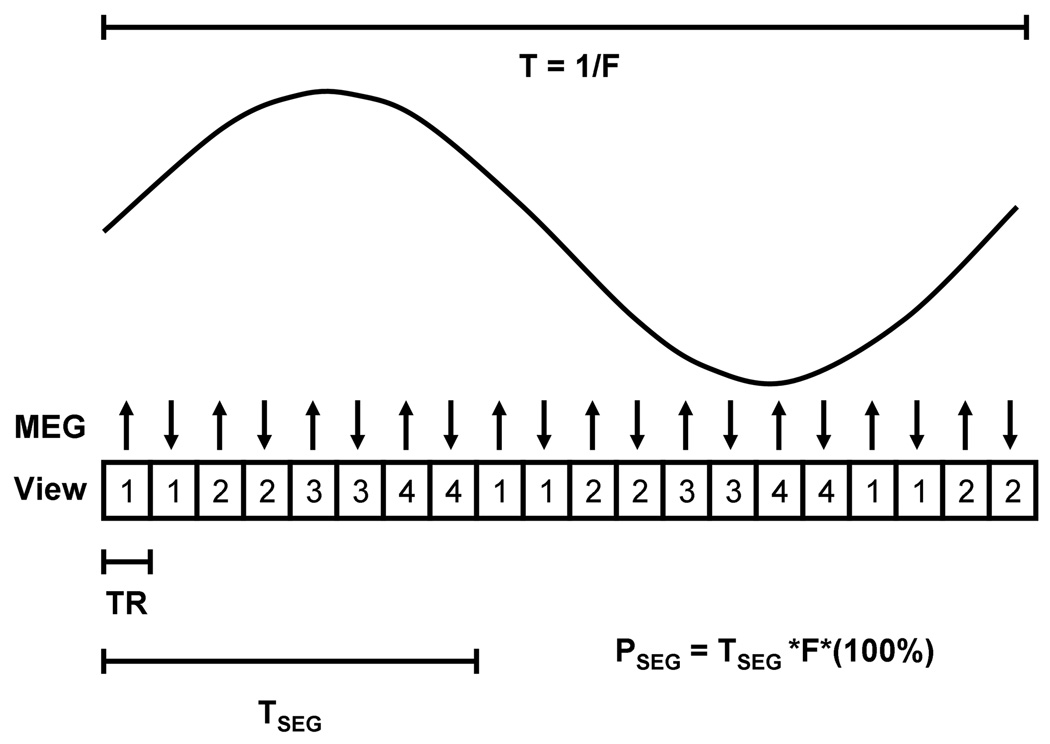
Data at multiple points within the pressure cycle were acquired using a multi-phase version of the single-phase MRE pulse sequence acquisition (Figure 3), again with the phantom undergoing cyclic pressure variations (range: 56–93 mmHg). The multiphase MRE sequence performs continuous data acquisition throughout the pressure cycle with gating and retrospective view sharing to reconstruct images at different phases of the pressure cycle (19–21). Views are acquired in an interleaved fashion such that for a given view pair, opposing polarity MEG waveforms are encoded at each phase encoding step. The phase encoding is increased and MEG pair is repeated. The number of MEG view pairs used to encode a given phase of the pressure cycle represents the views per segment (VPS) for that acquisition (Figure 3 shows 4 VPS). Acquisitions performed over multiple deformation cycles sample different segments of k-space until all k-space views have been covered. The number of deformation cycles over which data are collected is equal to the total number of views divided by the VPS.
Figure 3.
Shows the timing diagram of the multi-phase MRE sequence with 4 VPS. Each view represents the pulse sequence shown in Figure 2. The MEG has alternating polarity for every TR and TSEG is the time taken to collect 4 views. The percent of time taken for collecting one segment of information with respect to one cycle of motion is called PSEG.
Figure 4.
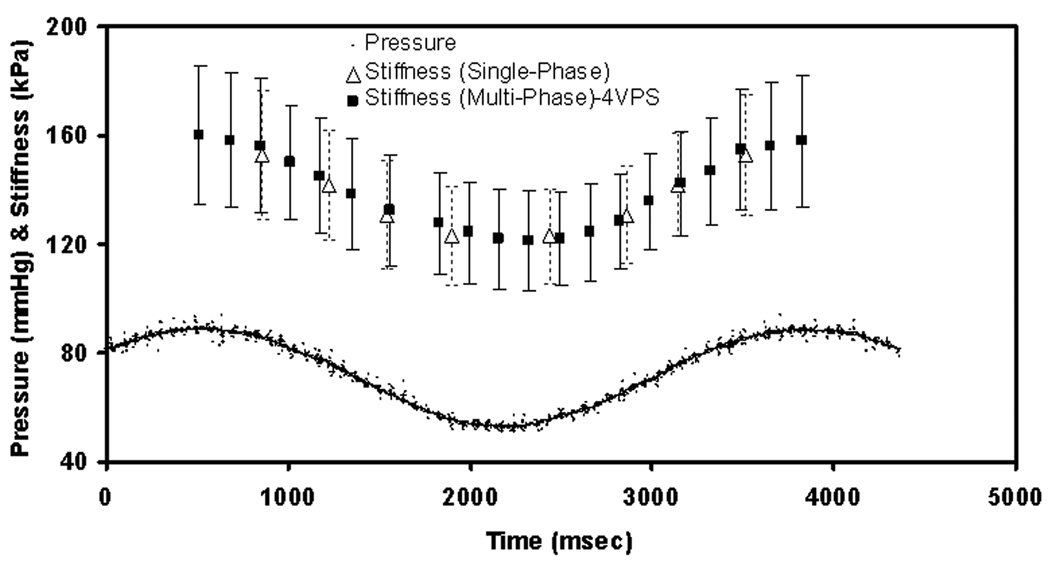
Plot of stiffness and pressure versus time during cyclic pressure changes using the gated multi-phase MRE sequence (PSEG = 8.4%) and the gated single-phase MRE sequence. The error bars with bold lines and dotted lines represent ±1 SD of the stiffness estimates from the multi-phase and single-phase acquisitions, respectively.
In the multi-phase MRE sequence, the time taken to collect a segment of data is TSEG = 2*TR*VPS, where the factor of 2 accounts for the alternating MEG polarity used for the phase-contrast reconstruction. Increasing the VPS decreases the number of deformation cycles over which data must be collected, but also increases the acquisition time of each segment, thereby decreasing the temporal resolution of the sequence. The fraction of the deformation period required to acquire a segment can be expressed as the percentage PSEG = TSEG*(1/T)*(100%), where T is the pulsation time (i.e., (1/T) = F, where F is pulsation frequency). Furthermore, view sharing is performed to reconstruct 20 phases throughout the pressure cycle. The VPS are varied for each pulsation frequency to determine the effect of the reduced acquisition time and increased view sharing on the stiffness estimates.
A baseline comparison of the multi-phase MRE sequence was performed by comparing stiffness estimates derived from both single-phase and multi-phase acquisitions at a single deformation frequency of 18 bpm. Imaging parameters of the multi-phase MRE sequence were the same as those used in the single-phase acquisitions except for TE = 9.8 ms, TR = 35 ms (including the 15 ms chemical presaturation time) and VPS = 4.
Stability of Multi-Phase MRE
In order to assess the accuracy of MRE-derived estimates of shear stiffness throughout the pressure cycle using the multi-phase MRE pulse sequence, a series of experiments were performed.
Acquisition
For these experiments, the multi-phase MRE sequence was used to acquire estimates of shear stiffness at several different phantom deformation frequencies (18, 27, 39, 51, 60, and 72 bpm). At each frequency 10 deformation phases were reconstructed. The VPS were varied from 4 to 30, the maximum VPS limited by the available imaging time per phase at a given frequency. The imaging parameters were the same as mentioned previously.
Image Analysis
For each acquisition, the spherical shell inversion described above was used to obtain a stiffness map. The MRE-encoded in-plane Cartesian displacements were converted to radial and circumferential displacements and were input into Eq. 1 to obtain an image of the shear stiffness distribution throughout the phantom. Several other parameters were also input to Eq. 1. The Poisson’s ratio was determined from mechanical testing to be 0.45 (22). The applied load, pa, models the externally applied vibration of the shell and was modeled as a Gaussian function with a standard deviation of 0.005 radians and a pressure amplitude of 105 Pa. The derivatives in Eq. 1 were calculated using Savitzky-Golay filters (23) to fit polynomials to the data. The radius and thickness of the shell for the calculation of β in Eq. 1 at each pressure were obtained from the MRE magnitude images. The Young’s modulus obtained from Eq. 1 was converted to shear stiffness using the relationship μ=E/2(1+ν), and the mean and standard deviation of the stiffness within the shell wall in a region of interest (ROI) was reported. Since the spherical phantom used in this study was symmetric, each ROI was drawn only on the left side of the shell away from the boundaries of the shell.
Statistical Analysis
Validation of Multi-Phase MRE
The accuracy of the multi-phase MRE stiffness measurements was determined by comparison with single-phase MRE data at the same pressure values (i.e. the same time points during the deformation cycle). Because previous work (15) has demonstrated a linear relationship between cavity pressure and shear stiffness μ for a similar thin-shelled spherical phantom, the same relationship was expected to be true for the current phantom experiment. Specifically, because the flow system was programmed to vary the cavity pressure as a sinusoidal function of time, it was also assumed that the shear stiffness would also vary sinusoidally. As the stiffness estimates obtained using the multi-phase MRE sequence were at different time points than the single-phase MRE stiffness estimates, the multi-phase stiffness data were fit to a sinusoidal function of time. Next, the multi-phase stiffness estimates were interpolated to the time points corresponding to the single-phase MRE acquisition based on this fit. A least-squares linear regression between the single-phase and interpolated multi-phase stiffness estimates was then performed.
Stability of Multi-Phase MRE
To determine the stability of the multi-phase MRE-derived estimates of shear stiffness as a function of frequency and MRE imaging parameters, the multi-phase stiffness estimates obtained at 4 VPS for a phantom deformation frequency of 18 bpm (i.e. baseline) were compared to all other deformation frequencies at 4 VPS. Since stiffness is expected to vary linearly with pressure (15), a least-squares linear regression was performed to fit the stiffness values obtained at each deformation frequency over the range of 27–72 bpm. As the stiffness estimates obtained are at different pressures for all frequencies, the linear regressions were interpolated to obtain stiffness estimates for those frequencies at the same pressures used during the 18 bpm acquisition. A least-squares linear regression with intercept of zero was then used to fit the stiffness estimates obtained at 18 bpm to the interpolated values at 27–72 bpm.
Finally, to investigate the effect of varying the temporal window over which a given phase of the pressure cycle is sampled, differences between the measured stiffness estimates at the minimum PSEG (i.e. 4 VPS) and higher PSEG’s were studied by calculating the mean square error (MSE) between the stiffness estimates at 4 VPS and other VPS values at each frequency.
Results
Validation of Multi-Phase MRE
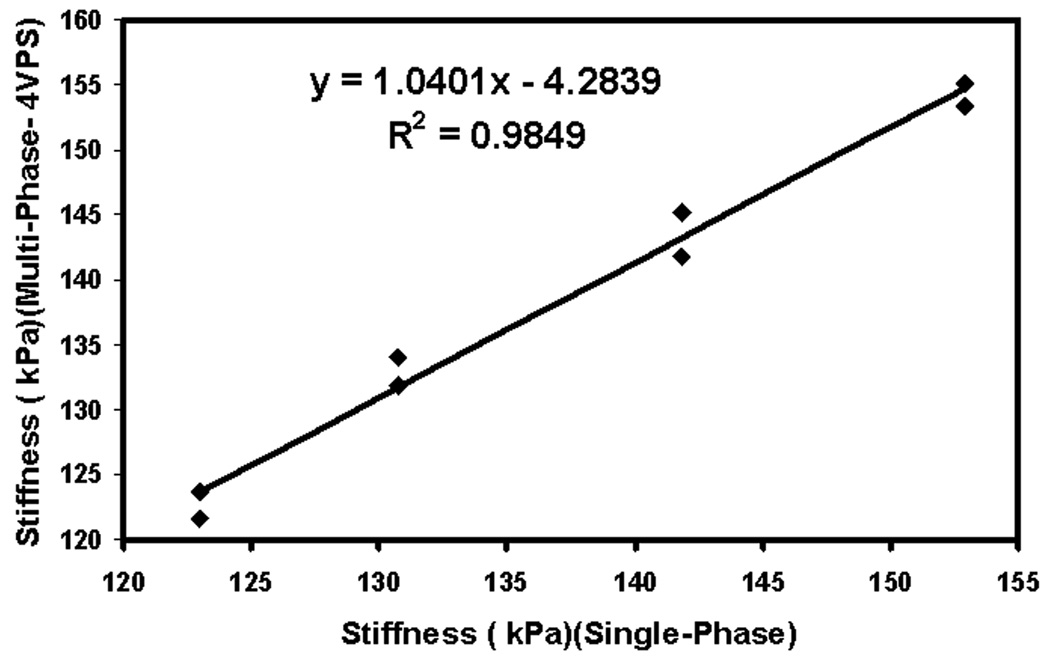
Good agreement was observed between the stiffness estimates obtained using the single-phase and multi-phase MRE sequences. Figure 4 shows the MRE-derived shear stiffness values obtained under cyclic pressure conditions (18 bpm) acquired with both the single-phase (one pressure point at a time) and multi-phase (20 pressure points, 4 VPS (PSEG = 8.4%)) GRE MRE sequences. For reference, the pressure waveform measured using the inline pressure monitor is also shown. The error bars represent ±1 SD of the shear stiffness measurements. As expected, the stiffness varied sinusoidally with respect to pressure indicating strong correlation. Figure 5 shows a plot comparing the single-phase MRE shear stiffness measurements from Figure 4 to those obtained using multi-phase MRE. The multi-phase MRE stiffness values were obtained by fitting a sinusoid to the measured stiffness values in Figure 4 and evaluating that function at the times sampled during the single-phase MRE acquisitions. Since the pressure variation is sinusoidal, there are stiffness estimates that are obtained at multiple time points that represent approximately the same stiffness values as shown in Figure 5. The R2 value of 0.98 and slope near unity indicate very high correlation between the stiffness estimates obtained using the single-phase and multi-phase MRE sequences. The results indicate that stiffness estimates obtained using multi-phase MRE at a deformation frequency of 18 bpm with 4 VPS can be used as reference standard for subsequent studies.
Figure 5.
Correlation between the shear stiffness estimates obtained using the multi-phase MRE pulse sequence and the single-phase MRE pulse sequence at 18 bpm.
Stability of Multi-Phase MRE
Good agreement was observed between the stiffness estimates obtained using multi-phase MRE at 18 bpm (4 VPS) to those obtained at 4 VPS at all other phantom deformation frequencies. Table 1 shows the results of comparing the stiffness measurements using the 4 VPS multi-phase MRE acquisition and a phantom deformation frequency of 18 bpm to those obtained using the 4 VPS acquisition with deformation frequencies of 27–72 bpm. Column 2 shows the PSEG for 4 VPS at 27–72 bpm. Columns 3 and 4 show the slope and correlation coefficient for each fit between the 18 bpm stiffness data and the other deformation frequencies. All fits had slopes near unity and R2 values above 0.92, indicating excellent agreement between the stiffness measurements at each frequency. The above results indicate that stiffness values obtained with 4 VPS and deformation frequencies of 18–72 bpm agree with the reference single-phase MRE data. Therefore, subsequent analysis of stiffness with changes in the amount of view sharing at different deformation frequencies can be performed using the 4 VPS estimates for each frequency.
Table 1.
| Frequency (bpm) | PSEG at 4 VPS (%) | Slope | R2 |
|---|---|---|---|
| 27 | 12.6 | 0.97 | 0.94 |
| 39 | 18.2 | 0.98 | 0.92 |
| 51 | 23.8 | 1.06 | 0.93 |
| 60 | 28.0 | 1.01 | 0.98 |
| 72 | 33.6 | 0.97 | 0.97 |
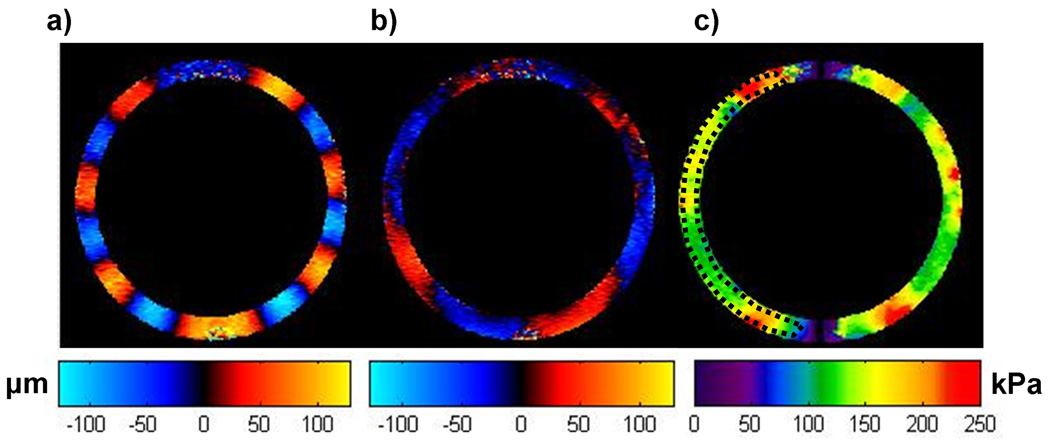
Figure 6 shows an example of the displacement data and stiffness estimates obtained using the multi-phase MRE technique. Figures 6(a, b) show the radial and circumferential components of displacement for a single slice through the center of the phantom obtained at an inflation pressure of 67.5 mmHg at a frequency of 1 Hz (60 bpm) and 4 VPS (PSEG = 28%). The corresponding stiffness map is shown in Figure 6(c). An average stiffness value of 142±24 kPa was obtained from the ROI shown (dotted black line). The artifacts at the top and bottom of the elastograms arise because of numerical instabilities due to the cotangent function in the wave equation going to zero in these regions.
Figure 6.
The radial component of displacement (a) and the circumferential component of displacement (b) for an inflation pressure of 67.5 mmHg at 60 bpm and PSEG = 28%. The stiffness map (c) using Eq.1 indicates the mean stiffness in the region of interest (denoted by the black dotted line) is 142±24 kPa.
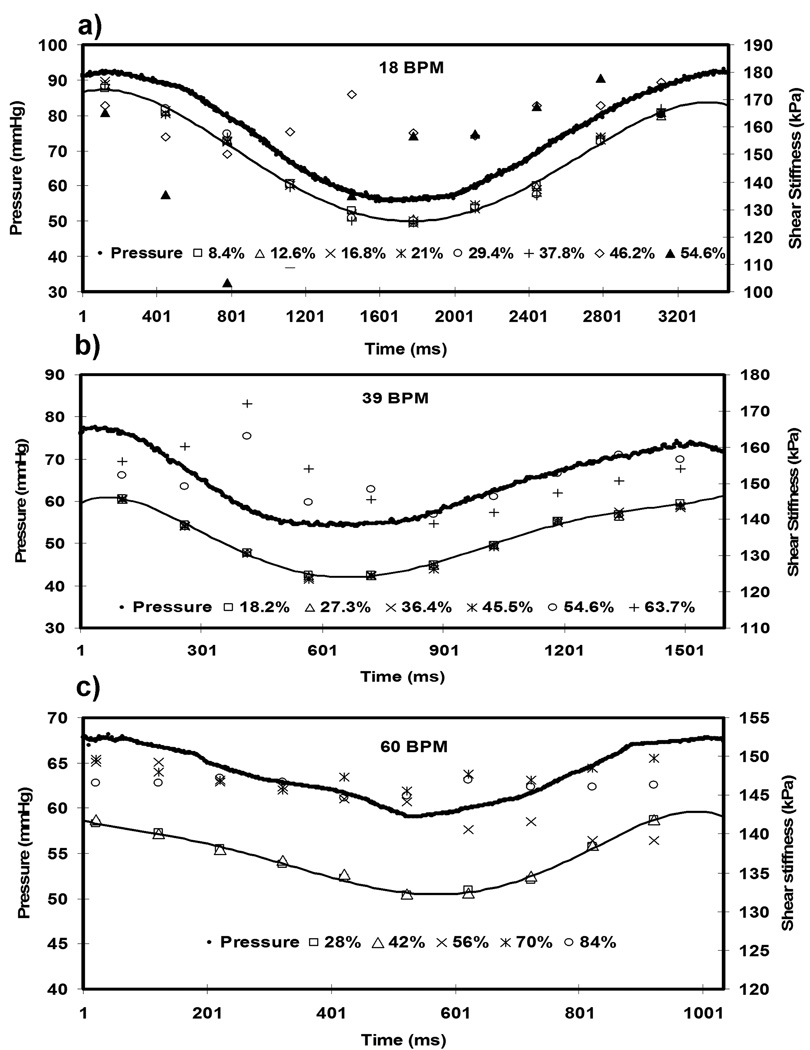
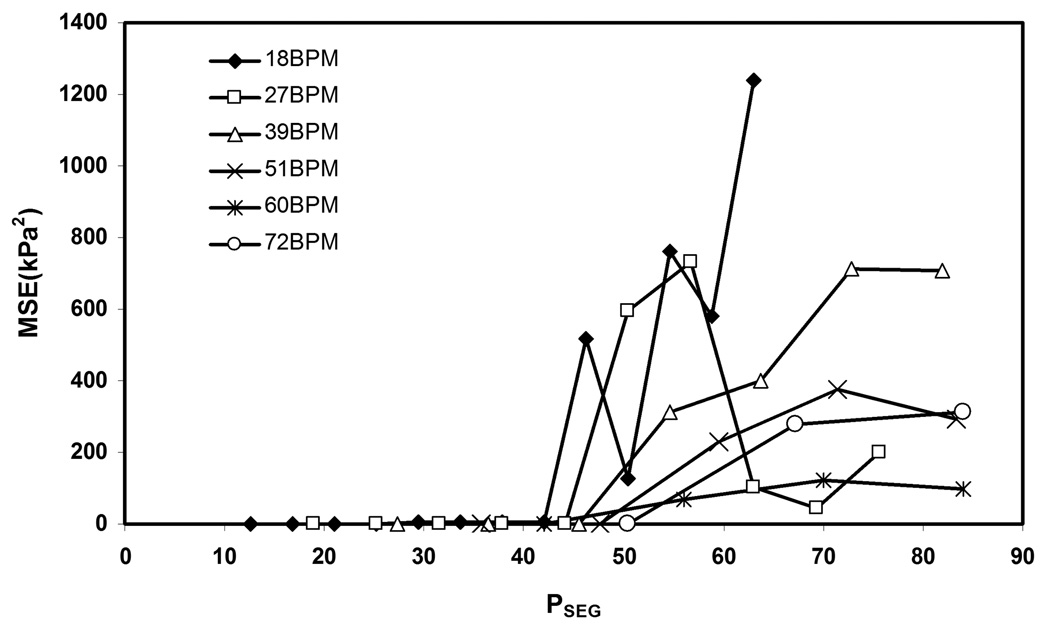
Variation in the stiffness estimates obtained using multi-phase MRE was observed with increasing PSEG when compared to the minimum PSEG. Figures 7(a–c) show plots of shear stiffness and pressure versus time for cyclic pressures of 18 bpm, 39 bpm and 60 bpm, respectively. The plots show the mean shear stiffness measurements obtained at different PSEG for each time point. For clarity, Figures 7(a, b) only include stiffness estimates up to PSEG = 54.6% and 63.7%, respectively. The plots show that the shear stiffness measurements at 18, 39, and 60 bpm become less accurate when PSEG is greater than about 42%. Figure 8 shows the MSE of the stiffness estimates at various PSEG (i.e., different VPS) for cyclic pressure frequencies ranging from 18 bpm to 72 bpm. The MSE was calculated for each phantom deformation frequency between the stiffness estimates obtained at 4 VPS and the other VPS at that frequency. The plots show that the MSE starts to significantly increase when PSEG is greater than 42% for all of the cyclic pressure variations and that the stiffness estimates using multi-phase MRE are reproducible for PSEG < 42% in the aforementioned frequency range.
Figure 7.
Plot of pressure versus time and stiffness versus time for various PSEG at 18 bpm (a) 39 bpm (b) and 60 bpm (c). The line connects the stiffness values corresponding to PSEG of 8.4%, 18.2 % and 28% in all three plots, respectively, indicating the true stiffness values.
Figure 8.
Plot of MSE versus PSEG for cyclic pressures ranging from18 bpm to 72 bpm.
Discussion
Our results suggest that multi-phase MRE can replace single-phase MRE as a method for estimating the shear modulus of an object undergoing cyclic deformation. The results at 18 bpm show excellent agreement between measurements from single-phase MRE and multi-phase MRE with 4 VPS (8.4% PSEG). The results also demonstrate sinusoidal variation in stiffness with sinusoidally varying pressure, indicating a linear correlation of stiffness with pressure, which agrees with previous study results (15).
Using the minimum VPS of 4, multi-phase MRE produced stable estimates of stiffness for different phantom deformation frequencies. A high correlation was observed between the stiffness estimates obtained with multi-phase MRE at 18 bpm and 4 VPS and deformation frequencies up to 72 bpm and 4 VPS. This suggests that multi-phase MRE can reproducibly measure the stiffness of a dynamically deforming object up to at least 72 bpm, which makes it practical for in vivo cardiac imaging where heart rates are typically around 60 bpm.
Compared to the minimum VPS of 4 at a particular deformation frequency of the phantom, the multi-phase sequence stiffness estimates increase when the VPS increase to the point where the fraction of the deformation period required to acquire a segment (PSEG) is >42.0%, suggesting that the multi-phase MRE sequence becomes unstable at this point. Increasing the PSEG (by increasing the number of VPS) can significantly reduce acquisition times, but the increased averaging of data collected at different times during the periodic deformation corrupts the displacement data and biases the stiffness estimates.
The multi-phase MRE sequence significantly reduced imaging times when compared to the single-phase MRE sequence. For example, in this phantom study, the scan time taken by the multi-phase MRE sequence reconstructing 10 deformation phases at a pulsation frequency of 60 bpm with a TR of 35 ms (including the 15-ms chemical presaturation time) and 6 VPS (42% PSEG) was approximately 11 seconds per sensitization direction or phase offset of external vibration. Similarly, the single-phase sequence equivalent to 1 VPS with alternating MEG in consecutive TR’s (i.e. every 1000 ms) requires approximately 2 minutes per sensitization direction or phase offset of external vibration. Therefore, this result suggests that multi-phase MRE sequence could be feasible for in vivo cardiac MRE applications. However, to have good penetration of waves into in vivo heart, lower excitation frequencies, which are in the range of those used in liver (14) should be applied. To have the maximum sensitivity to the external motion applied, the MEGs should be applied at the same frequency, which would increase the TE, thereby causing prohibitively long echo times due to short T2* values. To avoid this problem for in vivo applications, a reduced MEG duration can be used (24) in which the echo time can be shortened by mismatching the frequency of the gradients and the motion.
Previous studies (24,25) have demonstrated multi-phase balanced steady-state free precession MRE acquisitions. These studies did not perform an extensive analysis of the effect of the amount of view sharing on their results, whereas our analysis indicates a cutoff of 42% for the amount of view sharing necessary to obtain stable stiffness estimates. Furthermore, those studies reported a mean, global stiffness of the myocardium based on wave speed measurements, compared to the present study which is capable of providing spatially resolved stiffness maps at different phases of the deformation cycle. Recently, a cardiac MRE study (26,27) was described, which used the amplitude of vibration within the heart to measure the stiffness changes of the heart over the cardiac cycle in volunteers. Their technique does not measure wavelengths to provide stiffness estimates, does not measure regional stiffness, does not produce an absolute stiffness value (only relative values), and thus cannot be used to compare the tissue stiffness of different subjects.
There are several limitations of our study that will need to be monitored and addressed as the technique is applied in vivo. The first is the difficulty in testing this technique under physiological conditions due to the mechanical limitations of the current flow pump system. Currently, pressure variations produced by this pump at frequencies of 60 and 72 bpm are considerably smaller than those within the LV of a human heart, and therefore the reproducibility of the stiffness measurements at large PSEG and increased view sharing may not be as accurate under physiologic conditions compared to phantom conditions. Secondly, current scan times would require several breath holds for in vivo cardiac applications, which can introduce registration artifacts between the MRE phase offsets. Therefore, this could introduce additional uncertainties in the shear stiffness measurements. The third limitation is that Eq. 1 neglects torsional motion (i.e. the through-plane component of motion), which is present even in this phantom study and which we believe produces systematic variations in shear stiffness along the circumference of the phantom. Since this torsional motion may be more pronounced in in vivo applications, this might produce biases in the stiffness estimates when trying to identify normal and diseased myocardial tissues. The fourth limitation of this study is that the spherical shell inversion is a 2D analysis, but in the in vivo heart, the wave propagation might be more complicated because of its structure, therefore requiring a 3D inversion to obtain the true stiffness of the myocardium. The fifth limitation is that violations of the isotropy assumption governing the inversion algorithm in Eq. 1 will occur to a larger degree in vivo forcing the interpretation of the stiffness derived from Eq. 1 as an effective isotropic shear modulus of the myocardium. While these deviations may prevent the determination of the true mechanical properties of the myocardium in initial cardiac MRE results, the reported stiffness estimates may still be useful as indicators of cardiac disease status.
Future work includes refinement of this multi-phase MRE sequence to reduce scan time, such as by using parallel imaging acquisition techniques. Further, by reducing the MEG time and removing the chemical presaturation time used in the present study, the TE and TR can be reduced, thus allowing for a larger number of VPS for a fixed PSEG, which would decrease the scan time at a particular pulsation frequency without affecting the stiffness estimates.
In conclusion, we have demonstrated a rapid MRE imaging sequence capable of resolving the changing stiffness of a dynamically deforming phantom at multiple time points during the deformation. We have shown that the cyclic variation in pressure in this phantom produced similar variations in the stiffness of the phantom and that the stiffness estimates produced by a gated, multi-phase MRE sequence agreed with those obtained using a standard gated, single-phase sequence. We have also determined approximate limits for the amount of view sharing that is reasonable with this sequence to reduce acquisition times while still providing reproducible stiffness estimates. These results will provide a useful guide for future in vivo cardiac tissue studies.
Acknowledgments
Grant Support: National Institutes of Health Grant EB001981
References
- 1.Domanski MJ, Follman D, Kravitz M, Mirsky II. Noninvasive Assessment of Regional and Global Myocardial Contractility in Normal Control Subjects and in Patients with Dilated Cardiomyopathies. Echocardiography (Mount Kisco, NY) 1998;15(5):429–442. doi: 10.1111/j.1540-8175.1998.tb00629.x. [DOI] [PubMed] [Google Scholar]
- 2.Boluyt MO, Bing OH, Lakatta EG. The ageing spontaneously hypertensive rat as a model of the transition from stable compensated hypertrophy to heart failure. Eur Heart J. 1995;16 Suppl N:19–30. doi: 10.1093/eurheartj/16.suppl_n.19. [DOI] [PubMed] [Google Scholar]
- 3.Leite-Moreira AF. Current perspectives in diastolic dysfunction and diastolic heart failure. Heart (British Cardiac Society) 2006;92(5):712–718. doi: 10.1136/hrt.2005.062950. [DOI] [PMC free article] [PubMed] [Google Scholar]
- 4.Burkhoff D, Mirsky I, Suga H. Assessment of systolic and diastolic ventricular properties via pressure-volume analysis: a guide for clinical, translational, and basic researchers. Am J Physiol Heart Circ Physiol. 2005;289(2):H501–H512. doi: 10.1152/ajpheart.00138.2005. [DOI] [PubMed] [Google Scholar]
- 5.Mirsky I, Pasipoularides A. Clinical assessment of diastolic function. Prog Cardiovasc Dis. 1990;32(4):291–318. doi: 10.1016/0033-0620(90)90018-w. [DOI] [PubMed] [Google Scholar]
- 6.Badenhorst D, Maseko M, Tsotetsi OJ, Naidoo A, Brooksbank R, Norton GR, Woodiwiss AJ. Cross-linking influences the impact of quantitative changes in myocardial collagen on cardiac stiffness and remodelling in hypertension in rats. Cardiovasc Res. 2003;57(3):632–641. doi: 10.1016/s0008-6363(02)00733-2. [DOI] [PubMed] [Google Scholar]
- 7.Bourdillon PD, Lorell BH, Mirsky I, Paulus WJ, Wynne J, Grossman W. Increased regional myocardial stiffness of the left ventricle during pacing-induced angina in man. Circulation. 1983;67(2):316–323. doi: 10.1161/01.cir.67.2.316. [DOI] [PubMed] [Google Scholar]
- 8.Norton GR, Tsotetsi J, Trifunovic B, Hartford C, Candy GP, Woodiwiss AJ. Myocardial stiffness is attributed to alterations in cross-linked collagen rather than total collagen or phenotypes in spontaneously hypertensive rats. Circulation. 1997;96(6):1991–1998. doi: 10.1161/01.cir.96.6.1991. [DOI] [PubMed] [Google Scholar]
- 9.Muthupillai R, Lomas DJ, Rossman PJ, Greenleaf JF, Manduca A, Ehman RL. Magnetic resonance elastography by direct visualization of propagating acoustic strain waves. Science (New York, NY. 1995;269(5232):1854–1857. doi: 10.1126/science.7569924. [DOI] [PubMed] [Google Scholar]
- 10.Bensamoun SF, Ringleb SI, Chen Q, Ehman RL, An KN, Brennan M. Thigh muscle stiffness assessed with magnetic resonance elastography in hyperthyroid patients before and after medical treatment. J Magn Reson Imaging. 2007;26(3):708–713. doi: 10.1002/jmri.21073. [DOI] [PubMed] [Google Scholar]
- 11.Klatt D, Hamhaber U, Asbach P, Braun J, Sack I. Noninvasive assessment of the rheological behavior of human organs using multifrequency MR elastography: a study of brain and liver viscoelasticity. Phys Med Biol. 2007;52(24):7281–7294. doi: 10.1088/0031-9155/52/24/006. [DOI] [PubMed] [Google Scholar]
- 12.Sack I, Beierbach B, Hamhaber U, Klatt D, Braun J. Non-invasive measurement of brain viscoelasticity using magnetic resonance elastography. NMR Biomed. 2008;21(3):265–271. doi: 10.1002/nbm.1189. [DOI] [PubMed] [Google Scholar]
- 13.Sinkus R, Tanter M, Catheline S, Lorenzen J, Kuhl C, Sondermann E, Fink M. Imaging anisotropic and viscous properties of breast tissue by magnetic resonance elastography. Magn Reson Med. 2005;53:372–387. doi: 10.1002/mrm.20355. [DOI] [PubMed] [Google Scholar]
- 14.Yin M, Talwalkar JA, Glaser KJ, Manduca A, Grimm RC, Rossman PJ, Fidler JL, Ehman RL. Assessment of hepatic fibrosis with magnetic resonance elastography. Clin Gastroenterol Hepatol. 2007;5:1207–1213. doi: 10.1016/j.cgh.2007.06.012. [DOI] [PMC free article] [PubMed] [Google Scholar]
- 15.Kolipaka A, McGee KP, Araoz PA, Ehman RL. Validation of MR Elastography Derived Stiffness Maps Using Established Pressure – Volume Model in a Simulated Heart Model. Proceedings of the 16th Annual Meeting of ISMRM; Toronto, Canada. 2008. p. 1031. [Google Scholar]
- 16.Mirsky I, Parmley WW. Assessment of passive elastic stiffness for isolated heart muscle and the intact heart. Circ Res. 1973;33(2):233–243. doi: 10.1161/01.res.33.2.233. [DOI] [PubMed] [Google Scholar]
- 17.Manduca A, Oliphant TE, Dresner MA, Mahowald JL, Kruse SA, Amromin E, Felmlee JP, Greenleaf JF, Ehman RL. Magnetic resonance elastography: non-invasive mapping of tissue elasticity. Med Image Anal. 2001;5(4):237–254. doi: 10.1016/s1361-8415(00)00039-6. [DOI] [PubMed] [Google Scholar]
- 18.Junger CM, Fiet D. Sound, Structures and Their interaction. Massachsetts and London England: The MIT Press Cambridge; 1972. The in vacuo vibrations of shells; pp. 230–253. [Google Scholar]
- 19.Atkinson DJ, Edelman RR. Cineangiography of the heart in a single breath hold with a segmented turboFLASH sequence. Radiology. 1991;178(2):357–360. doi: 10.1148/radiology.178.2.1987592. [DOI] [PubMed] [Google Scholar]
- 20.Polzin JA, Frayne R, Grist TM, Mistretta CA. Frequency response of multi-phase segmented k-space phase-contrast. Magn Reson Med. 1996;35(5):755–762. doi: 10.1002/mrm.1910350517. [DOI] [PubMed] [Google Scholar]
- 21.Inoue Y, Nomura Y, Nakaoka T, Watanabe M, Kiryu S, Okubo T, Ohtomo K. Effect of temporal resolution on the estimation of left ventricular function by cardiac MR imaging. Magn Reson Imaging. 2005;23(5):641–645. doi: 10.1016/j.mri.2005.04.004. [DOI] [PubMed] [Google Scholar]
- 22.ASTM. Standard E132-04 Standard Test Method for Poisson's Ratio at room Temperature. [Google Scholar]
- 23.Press WH, Teukolsky SA, Vetterling WT, Flannery BP. Numerical recipes in C: The art of scientific computing. Cambridge University Press; 1992. pp. 650–655. [Google Scholar]
- 24.Rump J, Klatt D, Braun J, Warmuth C, Sack I. Fractional encoding of harmonic motions in MR elastography. Magn Reson Med. 2007;57(2):388–395. doi: 10.1002/mrm.21152. [DOI] [PubMed] [Google Scholar]
- 25.Sinkus R, Robert B, Gennisson J-L, Tanter M, Fink M. Single Breath Hold Transient MR-Elastography of the Heart - Imaging Pulsed Shear Wave Propagation Induced by Aortic Valve Closure. Proceedings of the 14th Annual Meeting of ISMRM; Seattle, USA. 2006. p. 77. [Google Scholar]
- 26.Sack I, Rump J, Elgeti T, Samani A, Braun J. MR elastography of the human heart: Noninvasive assessment of myocardial elasticity changes by shear wave amplitude variations. Magn Reson Med. 2008 doi: 10.1002/mrm.21878. (In Press) [DOI] [PubMed] [Google Scholar]
- 27.Elgeti T, Rump J, Hamhaber U, Papazoglou S, Hamm B, Braun J, Sack I. Cardiac magnetic resonance elastography. Initial results. Invest Radiol. 2008;43(11):762–772. doi: 10.1097/RLI.0b013e3181822085. [DOI] [PubMed] [Google Scholar]


