

Abstract
Recently, several protocols for labeling of stem cells with superparamagnetic iron oxides (SPIOs) have been developed, leading to an active and growing field aimed at visualizing stem cells using MRI (magnetic resonance imaging), including image-guided stem cell injections. This development occurred simultaneously with a significant rise in the number of cell therapy clinical trials for cardiovascular applications and their preceding pre-clinical studies in animal models. In this chapter, we will describe several labeling strategies that can be used to label cells with SPIO nanoparticles. This is followed by a discussion of current strategies for using MRI to visualize these cells in myocardial infarct.
Keywords: Magnetic resonance imaging (MRI), stem cells, superparamagnetic iron oxide (SPIO), cellular labeling, cellular imaging, myocardial infarct
1. Introduction
Magnetic resonance imaging (MRI) is an ideal technique for precise MR-guided delivery of cells followed by monitoring of their trafficking within the body. On the one hand, MRI offers the interactivity of X-ray interventional techniques without exposing the patient or cells to ionizing radiation. On the other hand, the high spatial resolution and exquisite soft tissue detail of MRI are superior to X-ray cardiac interventional methods, which can only provide information about the lumen of the heart or vessels in combination with iodinated contrast agents. Moreover, MRI allows non-invasive, serial imaging for dynamic tracking of cell migration and engraftment (1–12).
There are many magnetic labeling methods to detect cells with MRI. Pre-labeling with superparamagnetic iron oxide (SPIO) contrast agents is currently the most widely used method (13–17). SPIO-labeling methods are relatively simple, fast, and inexpensive. Among the different MR contrast agents that are available, SPIO particles offer currently the highest sensitivity (18). Several clinically approved formulations of SPIO-based contrast agents are available that have been used for cell labeling in a variety of diseases. The toxicity of the magnetic nanoparticles is low, since they are composed of biocompatible iron which can be recycled using endogenous iron metabolic pathways. Compared to gadolinium-based contrast agents, SPIOs become more effective upon cell internalization due to particle clustering and, thereby, create large “blooming” hypointensities on standard clinical MRI scanners (18). While SPIOs are not internalized by non-phagocytic cells without further modification, simple methods to induce internalization and uptake have been developed and tested in a variety of stem cells. One of the most commonly used method is “magnetofection” – a method where transfection agents (TAs) are complexed with SPIOs to provide the formation of SPIO oligomers with a highly positive surface charge (15), which induces macropinocytosis (endocytosis) of the SPIO-TA complexes (13, 14). Concentrations of 2–20 pg iron/cell can be easily achieved after 24–48 h incubation in vitro (13). After magnetic labeling of stem cells, SPIOs are stably maintained in endosomes enabling the imaging of stem cells for several months after delivery to the heart (3, 5, 9, 18).
Magnetoelectroporation (MEP) is another method of SPIO cellular labeling. MEP uses small pulsed voltages to induce intra-cellular uptake of SPIOs (16, 17, 19). No transfection agents are needed, which may aid in more rapid clinical translation. In addition, millions of cells can be labeled in seconds using MEP, which may be important in certain cell lines that are altered by culturing in vivo due to adhesion to tissue culture plastics leading to morphological changes. Furthermore, for cardiac cellular delivery, MEP may prove to be the method of choice where cellular delivery cannot be delayed by 24–48 h after an acute cardiac event, in particular when using off-the-shelf frozen stem cells within hours after a patient would be brought in.
Both magnetofection and MEP can be used to label cells with a variety of contrast agents, including manganese oxide nanoparticles (19). A recent study performing a head-to-head comparison of magnetofection and MEP demonstrated preserved cell viability and proliferation in embryonic stem cells by both techniques (20). However, cardiac differentiation of embryonic stem cells was most attenuated by MEP and iron uptake was greatest with magnetofection (20). This study has shown the importance of carefully selecting the magnitude and form of the applied electrical pulses. Detailed methods using these techniques to label stem cells for cardiovascular applications using SPIO contrast agents are given below.
2. Materials
2.1. Cell Culture and Preparation
Stem cell media, suitable for specific cell type, e.g., MEM alpha supplemented with 10% fetal bovine serum and 1% antibiotic/antimycotic containing penicillin, streptomycin, and amphotericin B for mesenchymal stem cells.
Phosphate buffered saline (PBS), 10 mM phosphate, 0.9% NaCl, pH = 7.4.
Trypsin (0.5 g/l) with ethylenediaminetetraacetic acid (EDTA 0.2 g/l), prewarmed to 37°C in a water bath before use. Long-term storage of trypsin should be at −80°C.
2.2. Labeling with Transfection Agents
Transfection agents (TAs) are highly charged molecules that will form complexes with iron oxide particles through electrostatic interactions. There are several classes of these agents, but the most convenient and most commonly utilized labeling methods are those based on commercially available TAs that are polycations, including dendrimers, such as Superfect®, poly-L-lysine (PLL), Lipofectamin®, and FUGENE®. SPIOs are used in conjunction with TAs to label cells and can be distinguished primarily based on the size of the nanoparticles. For brevity, we list several formulations that are approved or under development by major pharmaceutical companies.
-
Iron oxide contrast agents:
Commercially available ferumoxides are Feridex® (Berlex Laboratories Inc., Wayne, NJ, USA) or Endorem™ (Guerbet SA, Paris, France). Ferumoxide stock solution contains 11.2 mg Fe/ml with particles approximately 80–150 nm in diameter (21). Ferumoxide stock solution should be stored at 4°C, and should not be frozen. Feridex® is an FDA-approved liver contrast agent since 1996. In Europe, this compound is registered under name Endorem; both are identical. Both agents contain a dextran coating as a stabilizer.
Ferucarbotran (Resovist, Bayer Schering Pharma AG, Berlin, Germany) is an SPIO composed of nanoparticles coated with carboxydextran. It is currently used for the detection and characterization of focal liver tumor lesions and approved for clinical use in the European, Australian, and Japanese markets (see Note 1), as well as labeling cells.
Ferumoxtran (Sinerem™, Guerbet SA, Paris, France, or Combidex®, AMAG Pharmaceuticals Inc., Cambridge, MA, USA) is a member of the ultrasmall superparamagnetic iron oxide (USPIO) class of contrast agents with a median diameter <50 nm. Due to the smaller diameter, these particles will not be taken up by the reticuloendothelial system as quickly as SPIOs when injected intravenously. Thus, they tend to accumulate in lymph nodes and are used to distinguish normal from metastatic nodes (see Note 2). The particles are much less magnetic than SPIOs and also complex less well with TAs and have therefore not been widely used for magnetic labeling.
-
Transfection agents:
Poly-L-lysine (PLL, Sigma, St Louis, MO, USA) as a hydrobromide with a molecular weight of 388,000 Daltons is the most commonly used TA. A stock solution of PLL in sterile water at a concentration of 1.5 mg/ml should be stored in −20°C.
Protamine sulfate (American Pharmaceuticals Partner, Schaumburg, IL, USA), which is a drug used clinically to reverse the effects of heparin therapy, is another commonly used TA. It is available in bottles at a concentration of 10 mg/ml, and stored at 4°C.
Both transfection agents may be used (see Note 3).
2.3. Magnetoelectro - poration
Ferumoxide stock solution. (See Section 2.2.)
Electroporation cuvettes, 0.4 mm gap (Gene Pulser BioRad, Hercules, CA). It is important to deliver electrical pulses with the proper field strength and duration. The exact pulse delivery will be dependent on the type of cells that will be labeled. Mammalian cells typically require field strengths up to 6.15 kV/cm, which can be obtained using a 0.4-cm cuvette.
BTX electroporation system (Harvard Apparatus, Holliston, MA).
Culture media and 10 mM PBS as in Section 2.1.
2.4. Magnetic Resonance Imaging
Clinical MRI scanner equipped with surface coils to image the heart.
MRI-compatible ECG leads and monitoring equipment.
3. Methods
3.1. Cell Culture and Preparation
Prior to labeling, the cells must be prepared in a clean, sterile environment. The cells can be frozen and thawed immediately prior to labeling. To obtain a high fraction of viable cells, they can be cultured overnight following the removal of dead cells.
When stem cells approach confluency in a culture dish/flask, remove the old media and wash the monolayer once or twice with PBS.
Remove PBS with a pipette and add a minimal volume (~1 ml for a T-75 flask) of prewarmed trypsin.
Incubate the cells in trypsin for at 37°C in humidified, enriched in 5% CO2 air, then check microscopically to determine whether the monolayer of cells is lifting off the culture dish.
When single cell suspension has been obtained, add ~10 ml of complete media and transfer the cell suspension to a sterile 15-ml conical tube and spin the cells on tabletop centrifuge (~ 600×g for 10 min).
Discard the supernatant carefully, so as not to disturb the cell pellet and resuspend the cells in complete media for counting.
Once the number and concentration of cells has been determined, reseed the cells. For example, MSCs typically will be reseeded into a fresh T-75 flask at a concentration of ~2 × 10⁵ cells/ml.
3.2. Complexing of SPIO and Labeling Using Transfection Agents
Each combination of TA and (U)SPIOs should be carefully titrated and optimized, since too low concentrations may not lead to sufficient cellular uptake, whereas too high concentrations may induce precipitates or may be cytotoxic. The examples below are given for PLL and protamine sulfate (21). Figure 10.1 shows a representative example of intracellular labeling with Feridex® -PLL for a variety of cell types.
Fig. 10.1.
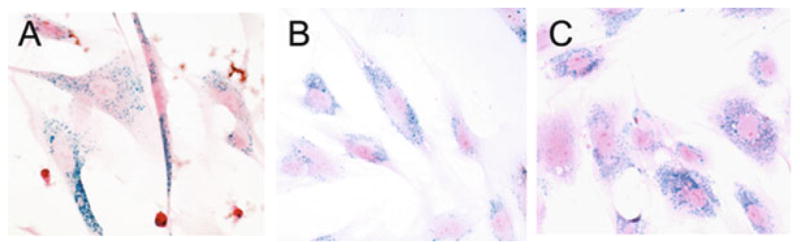
Labeling of cells using Feridex® -PLL complexes. Cells were labeled for 48 h with 25 μg Fe/ml Feridex and 375 ng/ml PLL. Prussian blue staining of labeled human embryonic germ-derived pluripotent stem cells (a), human mesenchymal stem cells (b), and swine mesenchymal stem cells (c) show an efficient intracellular uptake of particles into endosomes that is non-specific across species.
3.2.1. Poly-L-lysine
Use sterile culture medium, specific for the cell type being used, and add 2.2 μl Feridex® stock (11.2 mg Fe/ml, Berlex Laboratories) per ml of medium in order to prepare a medium solution containing 25 μg Fe/ml. Mix well (see Notes 1–4).
Add transfection agent to the Feridex® -medium at the appropriate concentration, i.e. 375 ng/ml (250 nl/ml medium using the 1.5 mg/ml stock). Mix well (see Notes 2 and 4).
Incubate the PLL-Feridex® medium for 60 min at room temperature using a rotating shaker. This allows the formation of PLL-Feridex® complexes through electrostatic interactions.
For adherent cells, remove the old medium, and add the PLL-Feridex® containing medium. For floating cells, spin the cells down at 400×g and resuspend the pellet in the PLL-Feridex® medium. For cells that are very sensitive to (autocrine) growth factors and supplements in the medium, spin the cells down at 400×g, resuspend the cells in 50% old medium, and add 50% PLL-Feridex® medium containing 50 μg Fe/ml Feridex® and 750 ng/ml PLL.
Incubate cells for 24–48 h. Shorter incubation times will induce less uptake.
3.2.2. Protamine Sulfate
Dilute protamine sulfate in distilled water to a concentration of 1 mg/ml just before initiating labeling.
Combine (U)SPIOs with appropriate serum-free media based on the cell type to obtain a concentration of 100 μg Fe/ml. For example, add 9 μl of ferumoxide formulation per every 1 ml of media for MSCs.
Add protamine sulfate to the (U)SPIO solution to obtain a concentration of 4.5–6 μg/ml (22–24) and mix the solution for 5–10 min.
After 5–10 min, add an equal volume of standard cell culture media with a double concentration of serum to create a final ferumoxide concentration of 50 μg/ml.
Replace old media in cell culture with newly created media with (U)SPIO–protamine sulfate complexes and incubate with cells overnight.
After overnight incubation, remove the media containing (U)SPIO-protamine sulfate complexes, rinse the cells with warm PBS, trypsinize, and collect for counting and administration.
3.3. Magnetoelectro- poration
Remove media and wash cells with PBS.
Trypsinize and count cells. After counting, spin the cells using a tabletop centrifuge (~600×g for 10 min for MSCs) and wash with PBS.
Resuspend the cells in 10 mM sterile PBS at a density of 1–5 × 10⁶ cells/ml (see Note 5) and transfer to sterile electroporation cuvette(s). While cell suspensions <1 ml/cuvette may be used, care must be taken to ensure that the cuvettes are entirely filled with the cell suspension. For example, using the BTX apparatus and 0.4-mm gap electroporation cuvettes, the total volume of cell suspension mixed with (U)SPIOs cannot be smaller than 700 μl.
Add (U)SPIOs to obtain a final concentration (after mixing with cell suspension) of 2 mg Fe/ml. For example, mix 130 μl of ferumoxides with 600 μl of cell suspension to obtain a final cuvette volume equal to 730 μl (see Note 6).
Using the BTX electroporation system (seeFig. 10.2), electroporate cells using the following conditions: 50 V pulse strength; 5 ms pulse duration; and 20 pulses in intervals of 100 ms.
Leave the cuvettes in the holder for 1 min, transfer to ice, and let them to rest for 5 min to allow for membrane recovery.
Remove the small top layer of foam and transfer cells to 50-ml conical tube containing culture media. Leave the tube with cells on ice for at least 15–20 min.
Wash the cells twice with PBS. Spin the cells in media using a tabletop centrifuge (~600×g for 10 min).
Remove the supernatant, resuspend MSCs in fresh, sterile 10 mM PBS, and spin down again. Repeat Steps 8 and 9 and then proceed to Step 10.
Discard the supernatant and resuspend cell pellet in 1 ml (or other desired amount) of PBS. Count the cells and dilute to final concentration for administration.
Fig. 10.2.

Instant MR labeling of cells using magnetoelectroporation (MEP). a Cells are suspended in a sterile electroporation cuvette (arrow), mixed with Feridex®, and placed in a cuvette holder. b Using the connected electroporator, cells are mildly permeabilized for 10–20 ms. c Magnetic labeling is instantaneous, and Feridex clusters are trapped in the cytoplasm as demonstrated by anti-dextran immunofluorescent staining (green clusters).
3.4. Cardiac Magnetic Resonance Imaging
SPIO-labeled stem cells can be delivered several ways including direct visualization during open-chest procedures, intracoro nary administration using conventional angiographic catheters, and transmyocardially using specialized catheters for delivery of therapeutics to the myocardium. High spatial resolution T2*-weighted images will depict the labeled cells as hypointensities (seeFig. 10.3). Because these hypointensities can be hard to distinguish from other hypointensities, such as calcified plaque or metallic objects like stents, off-resonance imaging techniques have been developed to portray the magnetic susceptibilities from iron-labeled cells as hyperintense signal (25–29) (seeFig. 10.4).
Fig. 10.3.
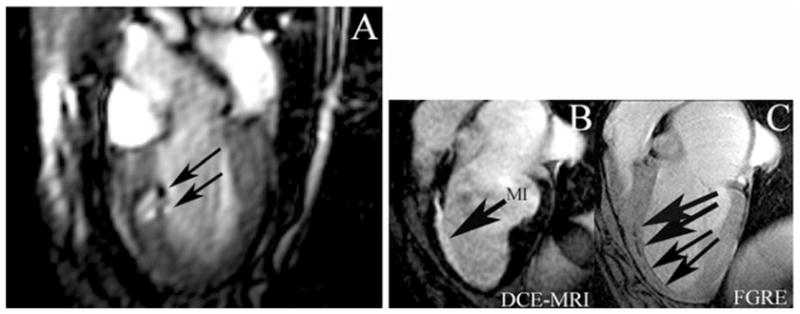
MR-guided real-time injection of Feridex® -labeled MSCs in a dog myocardial infarct model. a Still frame long-axis view from real-time MRI demonstrating Feridex® -labeled MSCs as hypo-enhancing artifacts (arrows) after initial two injections at 3 days post-infarction (MI). Top lesion is 7 × 10⁶ Feridex® -labeled MSCs; bottom lesion is 3 × 10⁶ labeled MSC with 4 × 10⁶ unlabeled MSCs. At 8 weeks after injection, initial two injections (c, upper arrows) are still visible, as well as additional injections (c, lower arrows) with as low as 1 × 10⁵ labeled MSCs at initial injection in fast gradient echo images (FGRE). Hypo-enhancing artifacts change from round lesions to linear lesions by 8 weeks and align along the edge of the infarct (hyper-enhancing artifact [MI]) on delayed contrast enhanced (DCE) MRI (b). (Adapted from Bulte et al. (5), with permission.)
Fig. 10.4.
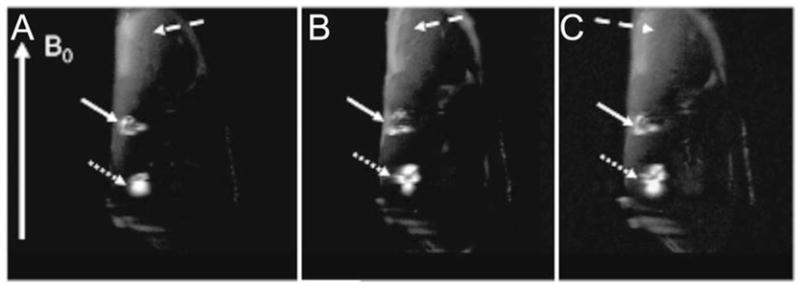
Positive contrast (IRON) imaging of Feridex® -labeled MSCs transplanted in the hindlimb muscle of an ischemic rabbit. Adjacent double-oblique slices (a–c) from an in vivo 3T FSE 3D IRON acquisition obtained in an ischemic rabbit hindlimb with two injection sites of SPIO-labeled MSCs (2.5 × 10⁵ cells at dotted white arrow and 1.25 × 10⁵ cells at solid white arrow). Note the excellent background suppression that leads to clear visualization of the stem cell injection sites with positive contrast and a larger volume of hyperintense signal for the 250,000-cell injection site. (Adapted from Stuber et al. (28), with permission.)
3.4.1. T2*-Weighted Imaging
For high-resolution imaging, images are acquired over multiple cardiac cycles using ECG-gating. Motion artifacts from breathing are suppressed using either navigator echo techniques or breath-holding.
While T2*-weighting can be obtained using several imaging techniques, gradient echo imaging with an extended echo time (TE) that does not degrade cardiac images appears to provide the best compromise in image quality on clinical scanners (2).
Typical gradient echo imaging parameters are 6 ms repetition time (TR); 1.6 ms TE; 20° flip angle; 512 × 512 image matrix; 5–8 mm slice thickness (ST): 32-kHz bandwidth (BW); and 2–4 number of signal averages (NSA). Images are acquired in the standard short or long axis planes to cover the extent of the left ventricle.
3.4.2. Off-Resonance Imaging
There are several types of off-resonance imaging techniques that have been used to image (U)SPIOs. One method uses a spectral excitation in combination with spin echo imaging, which is probably not well-suited for cardiac applications (26). Another method, GRadient echo Acquisition for Superparamagnetic particles/suscePtibility (GRASP), modifies the refocusing pulses to create positive contrast from iron-labeled cells (27, 30). Background suppression using this technique is excellent. A third method, Inversion-Recovery with ON-resonant water suppression (IRON), uses frequency-selective prepulses to suppress the water signal leaving positive contrast from iron-labeled cells (28). While not providing as much background suppression as the GRASP method, IRON MRI provides the flexibility to be combined with either spin echo or gradient echo techniques as well as two-dimensional single plane or three-dimensional volume acquisitions (seeFig. 10.4). Recently, it has been demonstrated that these off-resonance imaging techniques will not benefit from field strengths > 4.7T (31). Thus, these techniques are ideal for use on currently available clinical scanners.
As with T2*-weighted imaging, ECG-gating and respiratory gating or breath holds are used to suspend cardiac and respiratory motion, respectively.
Typical imaging parameters for three dimensional fast spin echo IRON imaging at 3T are 2 ms TR; 11.6 ms TE; 24 echo train length (ETL): 11.6 ms interecho spacing; 170 Hz bandwidth water suppression; 95° iron saturation pulse. In the heart, fat suppression is recommended. Depending on the number of (U)SPIO-labeled cells per voxel and the image resolution, the off-resonant positive contrast will appear as hyperintense areas surrounding the cells and with a typical dipole appearance. The volume of the hyperintensities can be measured to determine a relative concentration of labeled cells.
Footnotes
Instead of using complete medium, PLL-Feridex® complex formation may also be carried out in serum-free medium.
The amount of TA should be carefully titrated and optimized for each cell type. The suggested concentration of 375 ng/ml is only a guideline; this amount has been found to provide sufficient SPIO endocytosis without affecting cell proliferation or differentiation for most cell types.
Either PLL or protamine sulfate works well for cell labeling. For future clinical applications, protamine sulfate may be preferred as it is already clinically used as an anti-heparin product; however, in our experience, PLL labels most cells more effectively than protamine sulfate.
It is mandatory to first add the Feridex® to the medium and mix very well before adding the PLL or other TA. If this is not done, formation of large TA-SPIO aggregates and precipitation will occur.
If cell density per cuvette exceeds 5 × 10 (6), cell clumping can occur during MEP. Thus, using less than 2 × 10 (6) cells per cuvette is recommended to avoid cell clumping (16).
Iron uptake will be determined in part by of the type of cells. Cells with more cytoplasmic volume can be labeled with a larger amount of SPIOs. In addition, increasing the SPIO concentration can enhance intracellular iron uptake during MEP. Walczak et al. have demonstrated a correlation between concentrations ranging from 0.25 to 2 mg Fe/mL and cellular iron uptake (16).
References
- 1.Weissleder R, Cheng HC, Bogdanova A, Bogdanov A., Jr Magnetically labeled cells can be detected by MR imaging. J Magn Reson Imaging. 1997;7:258–63. doi: 10.1002/jmri.1880070140. [DOI] [PubMed] [Google Scholar]
- 2.Kraitchman DL, Heldman AW, Atalar E, et al. In vivo magnetic resonance imaging of mesenchymal stem cells in myocardial infarction. Circulation. 2003;107:2290–3. doi: 10.1161/01.CIR.0000070931.62772.4E. [DOI] [PubMed] [Google Scholar]
- 3.Hill JM, Dick AJ, Raman VK, et al. Serial cardiac magnetic resonance imaging of injected mesenchymal stem cells. Circulation. 2003;108:1009–14. doi: 10.1161/01.CIR.0000084537.66419.7A. [DOI] [PMC free article] [PubMed] [Google Scholar]
- 4.Garot J, Unterseeh T, Teiger E, et al. Magnetic resonance imaging of targeted catheter-based implantation of myogenic precursor cells into infarcted left ventricular myocardium. J Am Coll Cardiol. 2003;41:1841–6. doi: 10.1016/s0735-1097(03)00414-5. [DOI] [PubMed] [Google Scholar]
- 5.Bulte JW, Kraitchman DL. Monitoring cell therapy using iron oxide MR contrast agents. Curr Pharm Biotechnol. 2004;5:567–84. doi: 10.2174/1389201043376526. [DOI] [PubMed] [Google Scholar]
- 6.Rickers C, Gallegos R, Seethamraju RT, et al. Applications of magnetic resonance imaging for cardiac stem cell therapy. J Interv Cardiol. 2004;17:37–46. doi: 10.1111/j.1540-8183.2004.01712.x. [DOI] [PubMed] [Google Scholar]
- 7.Kustermann E, Roell W, Breitbach M, et al. Stem cell implantation in ischemic mouse heart: a high-resolution magnetic resonance imaging investigation. NMR Biomed. 2005;18:362–70. doi: 10.1002/nbm.967. [DOI] [PubMed] [Google Scholar]
- 8.de Vries IJ, Lesterhuis WJ, Barentsz JO, et al. Magnetic resonance tracking of dendritic cells in melanoma patients for monitoring of cellular therapy. Nat Biotechnol. 2005;23:1407–13. doi: 10.1038/nbt1154. [DOI] [PubMed] [Google Scholar]
- 9.Stuckey DJ, Carr CA, Martin-Rendon E, et al. Iron particles for noninvasive monitoring of bone marrow stromal cell engraftment into, and isolation of viable engrafted donor cells from, the heart. Stem Cells. 2006;24:1968–75. doi: 10.1634/stemcells.2006-0074. [DOI] [PubMed] [Google Scholar]
- 10.Amado LC, Schuleri KH, Saliaris AP, et al. Multimodality noninvasive imaging demonstrates in vivo cardiac regeneration after mesenchymal stem cell therapy. J Am Coll Cardiol. 2006;48:2116–24. doi: 10.1016/j.jacc.2006.06.073. [DOI] [PubMed] [Google Scholar]
- 11.Ebert SN, Taylor DG, Nguyen HL, et al. Noninvasive tracking of cardiac embryonic stem cells in vivo using magnetic resonance imaging techniques. Stem Cells. 2007;25:2936–44. doi: 10.1634/stemcells.2007-0216. [DOI] [PubMed] [Google Scholar]
- 12.Arai T, Kofidis T, Bulte JW, et al. Dual in vivo magnetic resonance evaluation of magnetically labeled mouse embryonic stem cells and cardiac function at 1.5 t. Magn Reson Med. 2006;55:203–9. doi: 10.1002/mrm.20702. [DOI] [PubMed] [Google Scholar]
- 13.Frank JA, Miller BR, Arbab AS, et al. Clinically applicable labeling of mammalian and stem cells by combining superparamagnetic iron oxides and transfection agents. Radiology. 2003;228:480–7. doi: 10.1148/radiol.2281020638. [DOI] [PubMed] [Google Scholar]
- 14.Frank JA, Zywicke H, Jordan EK, et al. Magnetic intracellular labeling of mammalian cells by combining (FDA-approved) superparamagnetic iron oxide MR contrast agents and commonly used transfection agents. Acad Radiol. 2002;9:S484–7. doi: 10.1016/s1076-6332(03)80271-4. [DOI] [PubMed] [Google Scholar]
- 15.Kalish H, Arbab AS, Miller BR, et al. Combination of transfection agents and magnetic resonance contrast agents for cellular imaging: relationship between relaxivities, electrostatic forces, and chemical composition. Magn Reson Med. 2003;50:275–82. doi: 10.1002/mrm.10556. [DOI] [PubMed] [Google Scholar]
- 16.Walczak P, Kedziorek D, Gilad AA, Lin S, Bulte JW. Instant MR labeling of stem cells using magnetoelectroporation. Magn Reson Med. 2005;54:769–74. doi: 10.1002/mrm.20701. [DOI] [PubMed] [Google Scholar]
- 17.Walczak P, Ruiz-Cabello J, Kedziorek DA, et al. Magnetoelectroporation: improved labeling of neural stem cells and leukocytes for cellular magnetic resonance imaging using a single FDA-approved agent. Nanomedicine. 2006;2:89–94. doi: 10.1016/j.nano.2006.01.003. [DOI] [PubMed] [Google Scholar]
- 18.Bulte JW, Kraitchman DL. Iron oxide MR contrast agents for molecular and cellular imaging. NMR Biomed. 2004;17:484–99. doi: 10.1002/nbm.924. [DOI] [PubMed] [Google Scholar]
- 19.Gilad AA, Walczak P, McMahon MT, et al. MR tracking of transplanted cells with “positive contrast” using manganese oxide nanoparticles. Magn Reson Med. 2008;60:1–7. doi: 10.1002/mrm.21622. [DOI] [PMC free article] [PubMed] [Google Scholar]
- 20.Suzuki Y, Zhang S, Kundu P, Yeung AC, Robbins RC, Yang PC. In vitro comparison of the biological effects of three transfection methods for magnetically labeling mouse embryonic stem cells with ferumoxides. Magn Reson Med. 2007;57:1173–9. doi: 10.1002/mrm.21219. [DOI] [PubMed] [Google Scholar]
- 21.Arbab AS, Yocum GT, Kalish H, et al. Efficient magnetic cell labeling with protamine sulfate complexed to ferumoxides for cellular MRI. Blood. 2004;104:1217–23. doi: 10.1182/blood-2004-02-0655. [DOI] [PubMed] [Google Scholar]
- 22.Janic B, Iskander AS, Rad AM, Soltanian-Zadeh H, Arbab AS. Effects of ferumoxides-protamine sulfate labeling on immunomodulatory characteristics of macrophage-like THP-1 cells. PLoS ONE. 2008;3:e2499. doi: 10.1371/journal.pone.0002499. [DOI] [PMC free article] [PubMed] [Google Scholar]
- 23.Rad AM, Janic B, Iskander AS, Soltanian-Zadeh H, Arbab AS. Measurement of quantity of iron in magnetically labeled cells: comparison among different UV/VIS spectrometric methods. Biotechniques. 2007;43:627–8. doi: 10.2144/000112599. [DOI] [PubMed] [Google Scholar]
- 24.Pawelczyk E, Arbab AS, Pandit S, Hu E, Frank JA. Expression of transferrin receptor and ferritin following ferumoxides-protamine sulfate labeling of cells: implications for cellular magnetic resonance imaging. NMR Biomed. 2006;19:581–92. doi: 10.1002/nbm.1038. [DOI] [PubMed] [Google Scholar]
- 25.Seppenwoolde JH, Viergever MA, Bakker CJ. Passive tracking exploiting local signal conservation: the white marker phenomenon. Magn Reson Med. 2003;50:784–90. doi: 10.1002/mrm.10574. [DOI] [PubMed] [Google Scholar]
- 26.Cunningham CH, Arai T, Yang PC, McConnell MV, Pauly JM, Conolly SM. Positive contrast magnetic resonance imaging of cells labeled with magnetic nanoparticles. Magn Reson Med. 2005;53:999–1005. doi: 10.1002/mrm.20477. [DOI] [PubMed] [Google Scholar]
- 27.Mani V, Saebo KC, Itskovich V, Samber DD, Fayad ZA. GRadient echo Acquisition for Superparamagnetic particles with Positive contrast (GRASP): sequence characterization in membrane and glass superparamagnetic iron oxide phantoms at 1.5T and 3T. Magn Reson Med. 2006;55:126–35. doi: 10.1002/mrm.20739. [DOI] [PubMed] [Google Scholar]
- 28.Stuber M, Gilson WD, Schär M, et al. Positive contrast visualization of iron oxide-labeled stem cells using inversion recovery with ON-resonant water suppression (IRON) Magn Reson Med. 2007;58:1072–77. doi: 10.1002/mrm.21399. [DOI] [PubMed] [Google Scholar]
- 29.Kraitchman DL, Bulte JW. Imaging of stem cells using MRI. Basic Res Cardiol. 2008;103:105–13. doi: 10.1007/s00395-008-0704-5. [DOI] [PMC free article] [PubMed] [Google Scholar]
- 30.Mani V, Briley-Saebo KC, Hyafil F, Itskovich V, Fayad ZA. Positive magnetic resonance signal enhancement from ferritin using a GRASP (GRE acquisition for superparamagnetic particles) sequence: ex vivo and in vivo study. J Cardiovasc Magn Reson. 2006;8:49–50. [Google Scholar]
- 31.Farrar CT, Dai G, Novikov M, et al. Impact of field strength and iron oxide nanoparticle concentration on the linearity and diagnostic accuracy of off-resonance imaging. NMR Biomed. 2008;21:453–63. doi: 10.1002/nbm.1209. [DOI] [PMC free article] [PubMed] [Google Scholar]