

Abstract
Background
Genome-wide association studies (GWAS) have identified loci associated with coronary heart disease (CHD) in Caucasians of European ancestry. This study evaluated whether genetic markers previously identified in Caucasians associated with nonfatal acute myocardial infarction (MI) in Hispanics.
Methods and Results
Cases (n=1,989) with a first nonfatal acute MI and population-based controls (n=2,096) living in Costa Rica were studied. Fourteen SNPs were genotyped. Seven SNPs at three independent loci showed significant associations with MI. The odds ratios (ORs) and 95% confidence interval (CI) for the loci with the strongest associations were 1.16 (1.05-1.27) for rs4977574 (CDKN2A/2B), 1.15 (1.03-1.29) for rs646776 (CELSR2-PSRC1-SORT1), and 1.22 (1.08-1.38) for rs501120 (CXCL12); and the corresponding population attributable risk (PAR) were 6.8%, 10.5%, and 15.2%; respectively. We developed a genetic risk score (GRS) by summing the number of the top three associated risk alleles. The OR for MI per GRS unit was 1.18 (95% CI 1.11- 1.25; P = 4.83*10-8). Discrimination of MI was significantly improved (P =0.02) when the GRS was added to a model including clinical predictors. However, the increment in the area under the receiver-operating characteristic curve (AUC) after adding GRS was moderate, from 0.67 (95% CI, 0.65 to 0.69) to 0.68 (95% CI, 0.66 to 0.70).
Conclusions
These results indicate both the consistency and disparity of genetic effects on risk of MI between Hispanic and Caucasian populations. The improvement of the identified genetic markers on discrimination of MI in Hispanics was modest.
Keywords: genetics, myocardial infarction, Hispanic
Introduction
Coronary heart disease (CHD) disproportionately affects certain ethnic groups.1-3 Compelling evidence has shown that Hispanics are affected by excessive rates of cardiovascular risk factors such as diabetes, overweight and obesity, dyslipidemia, and hypertension.4 However, it has also been documented that Hispanics have lower atherosclerotic burden and cardiovascular mortality compared with Caucasians.5 These puzzling observations may reflect the heterogeneity in genetic susceptibility or the interactions between genes and environmental factors that are specific to various ethnic groups.6
In the past few years, genome-wide association studies (GWAS) have identified several novel susceptibility loci for CHD.7-11 While most of the identified genetic variants showed reliably consistent associations with CHD in Caucasians of European ancestry, little is known about their effects in other populations such as Hispanics. To date, most variants identified have shown modest effects on cardiovascular risk. Nevertheless, when multiple genetic markers are considered together, they might be useful to improve the identification of individuals at high risk of disease.12 However, few studies have investigated the joint genetic effects in the discrimination of CHD status.13
The purpose of the present study was to examine the associations between the common single nucleotide polymorphisms (SNPs) reported by GWAS in Caucasians and the risk of nonfatal acute myocardial infarction (MI) in 1,898 cases of MI and 2,096 population-based controls from a Hispanic, Costa Rican population, which has a different genetic structure from Caucasians.14, 15 We also examined the joint genetic effects of these SNPs and their roles in discrimination of MI.
Subjects, Materials and Methods
Study Population
The Hispanic study population used in the present study has been described previously.16, 17 Briefly, the participants were from 34 counties in the Central Valley of Costa Rica, covered a full range of socioeconomic levels, as well as urban, peri-urban, and rural lifestyles. Eligible case subjects were adult residents who were diagnosed as survivors of a first acute MI by two independent cardiologists at any of the six recruiting hospitals in the catchment area between 1994 and 2004. All cases met the World Health Organization criteria for MI, which require typical symptoms plus either elevations in cardiac enzyme levels or diagnostic changes in the ECG. One free-living control subject for each case, matched for age (±5 years), sex, and area of residence (county), was randomly selected using the information available at the National Census and Statistics Bureau of Costa Rica. Because of the comprehensive social services provided in Costa Rica, all persons had access to medical care without regard to income. Therefore, control subjects came from the source population that gave rise to the cases and were not likely to have had CHD that was not diagnosed because of poor access to medical care. In total, 1,989 MI cases and 2,096 control subjects with genotyping data were included in the present study. All subjects gave informed consent on documents approved by the Human Subjects Committee of the Harvard School of Public Health and the University of Costa Rica.
All study participants were visited in their homes for collection of data. Information on sociodemographic characteristics, smoking, physical activity and medical history were collected by through an interview using closed-ended questionnaires. Alcohol consumption was assessed by a validated food frequency questionnaire. All anthropometric measurements were taken from subjects wearing light clothing and no shoes, and collected in duplicate and averaged out for analyses. Nonstretching fiberglass or metal tapes were used to measure the waist (smallest horizontal trunk- circumference) and hip (largest horizontal circumference around the hip and buttocks) girths. Biological samples were always collected in the morning after an overnight fast. Blood samples (20 ml) were drawn in 0.1% EDTA-containing tubes after a 12‐14 hour fast and immediately stored at 4 °C. Within 36 hours, the samples were centrifuged at 2,500 rpm for 20 minutes at 4 °C to isolate and aliquot plasma and white blood cells. The samples were then sealed and stored under N2 at -80 °C until analysis. Data and sample collection took place, on average, three weeks after hospital discharge.
SNP Selection and Genotype Determination
Genomic DNA was extracted from the buffy coat fraction of centrifuged blood using the QIAmp Blood Kit (Qiagen, Chatsworth, CA). For the present study, we selected SNPs previously associated with coronary artery disease and/or MI from GWAS studies.7-11 To increase the a priori likelihood of detecting associations in Costa Ricans, we selected SNPs that were associated with coronary artery disease (CAD) and/or MI in at least two studies and had r2 values less than 0.8 in the Caucasian, African, and Asian populations from the HAPMAP project for each respective locus. As a result, 14 SNPs were genotyped in the Costa Ricans: rs4977574, rs10757274, rs2383206, rs1333049 (CDKN2A/2B), rs646776, rs599839 (CELSR2-PSRC1-SORT1), rs501120, rs1746048 (CXCL12), rs2259816 (HNF1A, C12orf43), rs9818870 (MRAS), rs2048327 (SLC22A3), rs3127599 (LPAL2), rs7767084 and rs10755578 (LPA). Genotyping was performed using the TaqMan Allelic Discrimination system from Applied Biosystems, Inc. (Foster City, CA)18, 19, using custom genotyping assays from ABI's “assays by design” service. Replicate quality control samples yielded >99% concordance and the overall call rate was greater than 95%.
Statistical Analyses
A Chi-square test was used to assess whether the SNPs were in Hardy-Weinberg equilibrium (HWE) and to determine differences in genotype frequencies between MI cases and controls. Because some of the matched case-control pairs were broken due to missing genotyping, an unconditional logistic regression was used to calculate odds ratios (ORs), adjusting for age, sex, area of residence, waist-to-hip ratio, smoking, alcohol consumption, physical activity, total calories, and family history of CHD. Secondary analyses using conditional logistic regression with 1,864 case-control pairs for whom complete genotype were available generated similar results. General linear models were used to compare mean values of quantitative traits across groups. Population attributable risk (PAR%) was estimated for SNPs as follows: PAR%=100 × p(OR-1)/(p[OR-1]+1), where p is the frequency of the allele associated with MI among the control subjects. Haplotype analysis was conducted using the THESIAS program, which is based on the Stochastic-EM algorithm (SEM).20
A genetic risk score (GRS) was calculated with the three SNPs showing the strongest association with MI. For this purpose, we assumed that each SNP was independently associated with risk according to an additive genetic model, which performs well even when the true genetic model may not be known or incorrectly specified.21 We assumed that each SNP contributed equally to the risk of MI and calculated the GRS by summing the number of risk alleles at each locus. In sensitivity analyses, we also calculated a weighted GRS by multiplying the number of risk alleles at each locus (0, 1, or 2) for the corresponding beta coefficient from additive multivariate logistic regression model and then summing the products. We used receiver-operating-characteristic (ROC) curve analysis (plots=ROC function in ‘proc logistic’; SAS Version 9.2), and calculated the area under the curve (AUC; also known as a concordance [C] statistic) to evaluate discrimination. We tested the null hypothesis of no difference between the AUCs from models incorporating conventional risk factors (age, sex, area of residence, waist-to-hip ratio, family history of myocardial infarction, smoking, alcohol intake, total calories, and physical activity) with and without the GRS. The SAS statistical package was used for all analyses (SAS, Version 9.2; SAS Institute, Inc., Cary, NC) two-sided P-values less than 0.05 were considered significant.
Results
Table 1 shows the characteristics of the participants by MI status. The MI cases engaged in less physical activity, consumed more alcohol and total calories, had higher waist-to-hip ratio, and were more likely to be current smokers compared with the controls. All 14 SNPs tested were commonly distributed in the study samples, with minor allele frequency ranging from 0.09 to 0.50, and fit HWE. However, the allele frequencies of some SNPs including rs646776, rs599839, rs9818870, rs2048327, rs3127599, rs10755578, and rs2383206 did show significant differences (P<0.05) between our Hispanic population and the Caucasian population used in the HAPMAP project (CEU; Table 2). The two SNPs at chromosome 1 (rs646776 and rs599839) and the two SNPs at chromosome 10 (rs501120 and rs1746048) are respectively in strong LD (r2>0.8); whereas the four SNPs at chromosome 6 (rs2048327, rs3127599, rs7767084 and rs10755578) are in weak LD (r2<0.4). At chromosome 9, SNPs rs10757274 and rs4977574 are in near perfect LD (r2=0.99) and the pair-wise r2 among other SNPs are all less than 0.7.
Table 1. Characteristics of the participants by myocardial infarction (MI) status.
| MI Cases | Non-MI Controls | P* | |
|---|---|---|---|
| n of participants | 1989 | 2096 | |
| Age, years | 58.5 (11.1) | 58.3 (11.3) | 0.64 |
| Female, % | 26.1 | 26.2 | 0.94 |
| Area of residence, % rural | 26 | 26.4 | 0.87 |
| Waist-to-hip ratio | 0.97 (0.07) | 0.95 (0.07) | <0.0001 |
| Physical activity, MET hours/day | 34.3 (15.9) | 35.6 (16.2) | 0.01 |
| Alcohol consumption, g/day | 7.41 (19.53) | 5.95 (14.42) | 0.007 |
| Total calories, kcal/day | 2705 (945) | 2450 (771) | <0.0001 |
| Current smoker, % | 39.8 | 21.6 | <0.0001 |
| Family history of CHD, % | 12.2 | 7.7 | <0.0001 |
| Genotyping call rate, % | 98.5 | 98.5 | 0.99 |
MET, metabolic equivalent task; CHD, coronary heart disease
for continuous variables, we use general linear model for comparisons; and for categorical variables, we used chi-square test.
Table 2. Associations of reported CHD SNPs with CHD risk.
| SNP | Chromosome | Genes | Call rate% | Alleles Risk/Reference |
Risk allele frequency* | Odds Ratio (95% CI) |
P value┼ | PAR % | |
|---|---|---|---|---|---|---|---|---|---|
| Hispanics | Caucasians | ||||||||
| rs646776 | 1p13.3 | CELSR2-PSRC1-SORT1 | 0.988 | A/G | 0.78 | 0.75 | 1.15 (1.03-1.29) | 0.02 | 10.5 |
| rs599839 | 1p13.3 | CELSR2-PSRC1-SORT1 | 0.979 | A/G | 0.76 | 0.72 | 1.11 (0.99-1.24) | 0.07 | 7.7 |
| rs501120 | 10q11.21 | CXCL12 | 0.979 | A/G | 0.81 | 0.83 | 1.22 (1.08-1.38) | 0.00 | 15.2 |
| rs1746048 | 10q11 | CXCL12 | 0.982 | C/T | 0.81 | 0.85 | 1.21 (1.07-1.37) | 0.00 | 14.6 |
| rs2259816 | 12q24.31 | HNF1A,C12orf43 | 0.987 | A/C | 0.38 | 0.38 | 1.02 (0.92-1.12) | 0.73 | 0.8 |
| rs9818870 | 3q22.3 | MRAS | 0.988 | T/C | 0.09 | 0.17 | 1.00 (0.85-1.18) | 0.98 | 0.0 |
| rs2048327 | 6q26–q27 | SLC22A3 | 0.988 | G/A | 0.42 | 0.35 | 1.00 (0.91-1.10) | 0.93 | 0.0 |
| rs3127599 | 6q26–q27 | LPAL2 | 0.984 | A/G | 0.20 | 0.33 | 0.97 (0.86-1.09) | 0.59 | 0.6 |
| rs7767084 | 6q26–q27 | LPA | 0.985 | C/T | 0.17 | 0.16 | 1.02 (0.90-1.15) | 0.80 | 0.3 |
| rs10755578 | 6q26–q27 | LPA | 0.986 | G/C | 0.37 | 0.50 | 0.96 (0.87-1.06) | 0.45 | 1.5 |
| rs10757274 | 9p21.3 | CDKN2A,CDKN2B | 0.987 | G/A | 0.46 | 0.50 | 1.16 (1.05-1.28) | 0.00 | 6.8 |
| rs4977574 | 9p21.3 | CDKN2A,CDKN2B | 0.987 | G/A | 0.45 | 0.46 | 1.16 (1.05-1.27) | 0.00 | 6.8 |
| rs2383206 | 9p21.3 | CDKN2A,CDKN2B | 0.984 | G/A | 0.59 | 0.53 | 1.14 (1.03-1.26) | 0.01 | 7.6 |
| rs1333049 | 9p21.3 | CDKN2A,CDKN2B | 0.988 | C/G | 0.50 | 0.46 | 1.12 (1.02-1.24) | 0.02 | 5.7 |
The risk alleles are highlighted in bold; EAF, effect allele frequency; PAR, population attributable risk
P values were two-sided from the 1 df test for trend from unconditional logistic regression model
risk allele frequency in the study samples of hispanics; and in the CEU samples from HapMap
We first examined the associations between individual genetic variants and MI risk. Seven SNPs at three loci including CELSR2-PSRC1-SORT1 (rs646776), CXCL12 (rs501120, rs1746048), and CDKN2A/2B (rs10757274, rs4977574, rs2383206, and rs1333049), showed significant associations with MI risk, with odds ratios (ORs; 95% confidence interval) ranging from 1.12 (1.02-1.24) to 1.22 (1.08-1.38) (Table 2). Even after considering a conservative Bonferroni adjustment for the number of statistical tests carried out (0.05/14 = 0.004), two loci on chromosomes 10q11 and 9p21.3 were still significantly associated with MI, demonstrating the robust nature of these results. Importantly, the direction of these associations was consistent with previous GWAS7-11 and adjustment for matching variables and conventional risk factors, such as age, sex, area of residence, waist-to-hip ratio, smoking, alcohol consumption, physical activity, total calories, and family history of CHD, did not change the results.
Previous studies had reported that SNPs at the SLC22A3-LPAL2-LPA gene cluster on chromosome 6q26 were associated with CHD risk as part of two risk haplotypes.11 Therefore, we inferred the same haplotypes based on rs2048327, rs3127599, rs7767084, and rs10755578 (Table 3) where the most common haplotype in the Costa Ricans was TCTC, similar to Caucasian populations. Compared TCTC, the ORs (95% CI) for the two previously reported risk haplotypes CCTC; CTTG were 1.05 (0.92-1.20) and 0.98 (0.81-1.17), respectively. In addition, we observed that a more rare haplotype TTTC was also associated with an increased risk of MI (OR=1.94; 1.15-3.28) compared with the most common TCTC haplotype. However, the overall test for these haplotype associations did not achieve significance (P=0.15; χ2=10.8, with 7 d.f.).
Table 3. Haplotype associations with MI.
| SLC22A3-LPAL2-LPA haplotype | Frequency | Odds Ratios (95% CI) |
||||
|---|---|---|---|---|---|---|
| rs2048327 | rs3127599 | rs7767084 | rs10755578 | Cases | Controls | |
| T | C | T | C | 0.437 | 0.442 | 1.0 |
| T | T | T | G | 0.107 | 0.108 | 1.01 (0.85-1.19) |
| C | C | C | G | 0.148 | 0.148 | 1.01 (0.89-1.16) |
| C | T | T | G | 0.078 | 0.081 | 0.98 (0.98-1.17) |
| C | C | T | G | 0.013 | 0.018 | 0.73 (0.50-1.09) |
| C | C | T | C | 0.181 | 0.175 | 1.05 (0.92-1.20) |
| T | T | T | C | 0.012 | 0.006 | 1.94 (1.15-3.28) |
| T | C | C | G | 0.016 | 0.012 | 1.30 (0.83-2.04) |
| Overall test of haplotype association | χ2=10.8, with 7 d.f P=0.15 |
|||||
Previously reported risk haplotypes are shown in bold. ORs were calculated in comparison to the most common haplotype TCTC.
We next evaluated the joint effects of the best-associated SNPs at the three loci showing evidence of association with MI (rs4977574 at CDKN2A/2B; rs646776 at CELSR2-PSRC1-SORT1, and rs501120 at CXCL12). We calculated a GRS representing the sum of the risk alleles and observed that increasing GRS was significantly associated with higher risk of MI, with an OR of 1.18 (95% CI, 1.11-1.25) corresponding to one risk allele (P=4.83*10-8) (Table 4). As compared with subjects with GRS=1 (1.3% of the control subjects), there was step-wise increase in the risk of MI with increasing GRS and those with GRS=5 (25.6% of the control subjects) and 6 (7.4% of the control subjects) had nearly 2-fold high risk of MI (Table 4). Adjustment for covariates did not appreciably change these results (Figure 1; Table 4). We did not detect interactions between GRS and waist-to-hip ratio (low vs high by median value), smoking (current vs. never and past smoker), alcohol consumption (low vs high; by median value), and physical activity (low vs high; by median value).
Table 4. Association between genotype risk score (GRS) and MI.
| GRS | Cases N=1911 |
Controls N=2024 |
Odds ratios (95% CI) | |
|---|---|---|---|---|
| Unadjusted | Adjusted* | |||
| 1 | 16 (0.8) | 26 (1.3) | 1.0 | 1.0 |
| 2 | 83 (4.3) | 138 (6.8) | 0.98 (0.49-1.93) | 1.09 (0.51-2.34) |
| 3 | 344 (18.0) | 423 (20.9) | 1.32 (0.70-2.50) | 1.54 (0.75-3.15) |
| 4 | 684 (35.8) | 768 (37.9) | 1.45 (0.77-2.72) | 1.69 (0.83-3.42) |
| 5 | 618 (32.3) | 519 (25.6) | 1.93 (1.03-3.65) | 2.31 (1.14-4.69) |
| 6 | 166 (8.7) | 150 (7.4) | 1.80 (0.93-3.48) | 2.01 (0.96-4.20) |
| Per allele | 1.18 (1.11-1.25) | 1.19 (1.12-1.27) | ||
| P for trend | 4.83*10-8 | 1.49*10-7 | ||
In GRS analyses, individuals with missing genotyping were excluded
Adjusted for age, sex, area of residence, waist-to-hip ratio, smoking, alcohol consumption, physical activity and family history of coronary heart disease
FIGURE 1. Combined effect of risk alleles on myocardial infarction (MI).
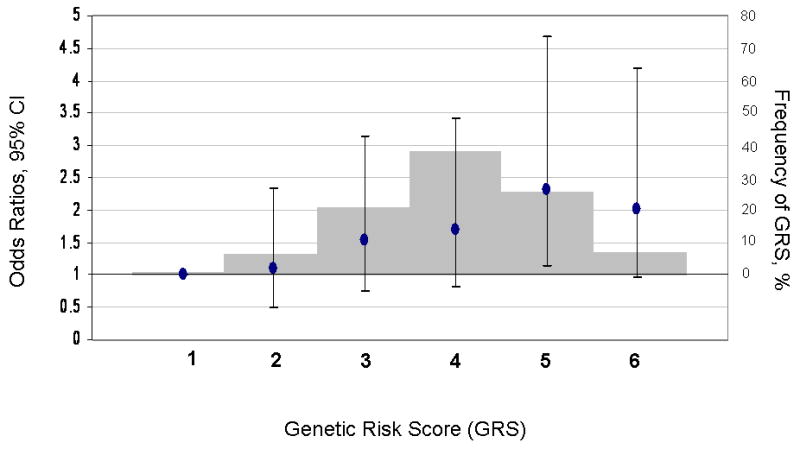
For each individual, the number of best-associated risk alleles of three loci CDKN2A/2B, CELSR2-PSRC1-SORT1, and CXCL12 were summed to represent an individual's GRS (range 1-6). Along the x-axis, individuals in each risk allele category are shown, and the odds ratios are plotted (y axis on left), with the error bars representing the 95% confidence intervals. The histogram (y axis on right) represents the frequency of each GRS category. GRS = genetic risk score
We further examined whether addition of the genetic markers improved the discrimination of MI status. Figure 2 presents the ROC curves for the logistic regression model incorporating conventional clinical risk factors (age, waist-to-hip ratio, smoking, alcohol consumption, physical activity, total calories, and family history of CHD) with and without inclusion of the GRS. The AUC, which measures how well the model discriminates between case subjects and control subjects, was 0.67 (95% CI, 0.65 to 0.69) for the conventional model and slightly but significantly increased to 0.68 (95% CI, 0.66 to 0.70) when the GRS was added (P = 0.02).
FIGURE 2. Receiver-operating characteristic curves for MI.
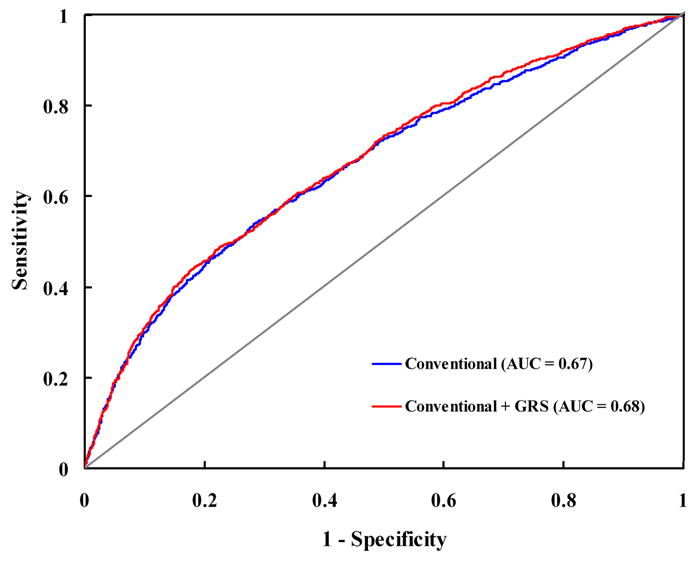
The curves are based on logistic regression models incorporating conventional risk factors (age, sex, area of residence, waist-to-hip ratio, family history of myocardial infarction, smoking, alcohol intake, total calories, and physical activity) with and without the GRS. AUC = area under the curve; GRS = genetic risk score.
We finally assessed whether the genetic markers could account for part of the variance of CHD family history and explain its predisposing effect on MI. A family history of CHD was significantly associated with an increased risk of MI (OR=1.63; 1.30-2.05), adjusting for other covariates. However, we did not observe significant association of family history with the individual genetic markers and GRS.
Discussion
In this case-control genetic study, we report that common variants of three loci identified from GWAS in Caucasians, CELSR2-PSRC1-SORT1, CXCL12, and CDKN2A/2B, were also significantly associated with MI risk in a Hispanic population. In addition, we found that the improvement of MI case-control discrimination by addition of a GRS combining three genetic markers significantly associated with MI was modest, although statistically significant.
The directions of the associations for the three significantly-associated loci were consistent with previous reports in Europeans.7-11 While the effect sizes of CDKN2A/2B variants appear weaker than those observed in Europeans, those of CELSR2-PSRC1-SORT1 and CXCL12 are comparable.9, 10 Thus, our results indicate that the genetic effects for these susceptibility loci for CHD may persist across different ethnic groups.
SNPs in some other loci such as HNF1A and MRAS were not significantly related to CHD risk in Hispanics. In addition, we did not confirm the associations between haplotypes at the SLC22A3-LPAL2-LPA locus 11 with MI risk. One possibility for these discrepancies may be due, in part, ethnic differences in genetic structure. Such population differences in genetic associations have been exemplified by some studies.22 It is likely that most identified SNPs in Caucasian populations themselves are not the causal variants but the markers in LD with the effective variants. Our study samples are derived from the admixture of a relatively small number of founders of Southern European, Amerindian, and West African origin. This admixture is likely to result in unique underlying linkage structure. Interestingly, we did not find regional differences in the admixture proportions or between cases and controls. The mean individual ancestry proportions in cases and controls were 57.5 versus 57.8% for the European, 38.4 versus 38.3% for the Amerindian and 4.1 versus 3.8% for the West African ancestry.15 Thus, it is possible the markers we tested are correlated with the causal variants, if any, in Caucasians but not in Hispanic populations. These observations highlight the importance of comprehensively fine-mapping susceptibility loci across different ethnicities. Another potential explanation for the heterogeneity in the genetic associations across ethnicities could be because of a modification by environmental factors, such as dietary and behavioral habits.23, 24 Future studies are warranted to investigate such potential gene-environment interactions and to improve our understanding of the influence of environment on the penetrance of genetic risk factors. Finally, it is possible that the definition of the disease outcome were not entirely identical in previous GWAS,7-11 and in our study. This may also partly explain some between-study variation in the associations.
In the analyses of the joint effects of these variants on MI risk, we found that a GRS based on the three MI-associated loci was associated with a significant 18% increased MI risk per risk allele. Individuals harboring 5 or 6 risk alleles, which constituted 25.6% and 7.4% of control subjects, had up to 2-fold high risk of MI compared to those with 1 risk allele (1.3% of controls). These findings suggest that a significant fraction of this Hispanic population carries multiple risk alleles and may help to identify individuals with a high genetic predisposition to MI. However, our analyses indicate that the addition of genetic risk factors did not materially improve the discrimination of MI status, although the test for such an improvement was statistically significant. These results are in line with observations that currently identified genetic variants might have low discriminatory ability and contribute modestly to disease prediction.12, 25
The genetic makers tested in our study did not explain the association between family history of CHD and MI risk. A similar pattern has been observed for other common disorders, such as type 2 diabetes,12 suggesting the existence of other, as yet unidentified genetic determinants for the “missing heritability”.26
Several limitations of the present study need to be considered. The genetic effects on complex diseases such as CHD are in general modest. Although the present study had a reasonable number of MI cases, we cannot exclude the possibility that some SNPs associated with MI have small effect size and therefore are not detectable in this sample. In addition, because we designed our study with specific prior hypotheses based on SNPs reported in European Caucasians, we interpreted our findings primarily on the basis of consistency between our results and those in previous GWAS.7-11 However, even after considering a conservative Bonferroni adjustment for the number of statistical tests carried out (0.05/14=0.004), two loci on chromosome 10q11 and 9p21.3 were still significantly associated with MI, demonstrating the robust nature of these results. Lastly, because of potential differences in LD structure between Hispanics and Europeans, it is possible the SNPs we examined are not correlated with the causal genetic variants in our study samples compared to European Caucasians.14 In addition, we acknowledge that some reported CHD-associated genetic variants were not included in our study, which warrants future studies to fine-map these previously reported regions by comprehensive genotyping and to test more additional relevant loci.
In summary, our findings demonstrate that certain susceptibility loci identified in Europeans may also increase MI risk in Hispanics. The improvement of disease discrimination by incorporating associated genetic markers with conventional risk factors was modest. Our data suggest that more association analyses in various ethnicities are required before generalizable conclusions can be made regarding genetic effects on CHD across multiple populations.
Acknowledgments
We thank all the participants of the study.
Funding Sources: This study was supported by grants HL071981 from the National Institutes of Health, the American Heart Association Scientist Development Award (0730094N), and DK46200 from the Boston Obesity Nutrition Research Center. A portion of this work was conducted in a facility constructed with support from the National Institute of Health Research Facilities Improvement Program (RR10600-01, CA62528-01, RR14514-01) from the National Center for Research Resources.
Footnotes
Disclosures: None
References
- 1.American Heart Association. Heart Disease and Stroke Statistics—2008 Update. Dallas, Tex: American Heart Association; 2008. [Google Scholar]
- 2.D'Agostino RB, Jr, Burke G, O'Leary D, Rewers M, Selby J, Savage PJ, Saad MF, Bergman RN, Howard G, Wagenknecht L, Haffner SM. Ethnic differences in carotid wall thickness. The Insulin Resistance Atherosclerosis Study. Stroke; a journal of cerebral circulation. 1996;27:1744–1749. doi: 10.1161/01.str.27.10.1744. [DOI] [PubMed] [Google Scholar]
- 3.Lai CQ, Tucker KL, Choudhry S, Parnell LD, Mattei J, Garcia-Bailo B, Beckman K, Burchard EG, Ordovas JM. Population admixture associated with disease prevalence in the Boston Puerto Rican health study. Human genetics. 2009;125:199–209. doi: 10.1007/s00439-008-0612-7. [DOI] [PMC free article] [PubMed] [Google Scholar]
- 4.Rosamond W, Flegal K, Furie K, Go A, Greenlund K, Haase N, Hailpern SM, Ho M, Howard V, Kissela B, Kittner S, Lloyd-Jones D, McDermott M, Meigs J, Moy C, Nichol G, O'Donnell C, Roger V, Sorlie P, Steinberger J, Thom T, Wilson M, Hong Y. Heart disease and stroke statistics--2008 update: a report from the American Heart Association Statistics Committee and Stroke Statistics Subcommittee. Circulation. 2008;117:e25–146. doi: 10.1161/CIRCULATIONAHA.107.187998. [DOI] [PubMed] [Google Scholar]
- 5.Lerman-Garber I, Villa AR, Caballero E. Diabetes and cardiovascular disease Is there a true Hispanic paradox? Revista de investigacion clinica; organo del Hospital de Enfermedades de la Nutricion. 2004;56:282–296. [PubMed] [Google Scholar]
- 6.Helgadottir A, Manolescu A, Helgason A, Thorleifsson G, Thorsteinsdottir U, Gudbjartsson DF, Gretarsdottir S, Magnusson KP, Gudmundsson G, Hicks A, Jonsson T, Grant SF, Sainz J, O'Brien SJ, Sveinbjornsdottir S, Valdimarsson EM, Matthiasson SE, Levey AI, Abramson JL, Reilly MP, Vaccarino V, Wolfe ML, Gudnason V, Quyyumi AA, Topol EJ, Rader DJ, Thorgeirsson G, Gulcher JR, Hakonarson H, Kong A, Stefansson K. A variant of the gene encoding leukotriene A4 hydrolase confers ethnicity-specific risk of myocardial infarction. Nature genetics. 2006;38:68–74. doi: 10.1038/ng1692. [DOI] [PubMed] [Google Scholar]
- 7.Helgadottir A, Thorleifsson G, Manolescu A, Gretarsdottir S, Blondal T, Jonasdottir A, Jonasdottir A, Sigurdsson A, Baker A, Palsson A, Masson G, Gudbjartsson DF, Magnusson KP, Andersen K, Levey AI, Backman VM, Matthiasdottir S, Jonsdottir T, Palsson S, Einarsdottir H, Gunnarsdottir S, Gylfason A, Vaccarino V, Hooper WC, Reilly MP, Granger CB, Austin H, Rader DJ, Shah SH, Quyyumi AA, Gulcher JR, Thorgeirsson G, Thorsteinsdottir U, Kong A, Stefansson K. A common variant on chromosome 9p21 affects the risk of myocardial infarction. Science (New York, NY) 2007;316:1491–1493. doi: 10.1126/science.1142842. [DOI] [PubMed] [Google Scholar]
- 8.Samani NJ, Erdmann J, Hall AS, Hengstenberg C, Mangino M, Mayer B, Dixon RJ, Meitinger T, Braund P, Wichmann HE, Barrett JH, Konig IR, Stevens SE, Szymczak S, Tregouet DA, Iles MM, Pahlke F, Pollard H, Lieb W, Cambien F, Fischer M, Ouwehand W, Blankenberg S, Balmforth AJ, Baessler A, Ball SG, Strom TM, Braenne I, Gieger C, Deloukas P, Tobin MD, Ziegler A, Thompson JR, Schunkert H. Genomewide association analysis of coronary artery disease. The New England journal of medicine. 2007;357:443–453. doi: 10.1056/NEJMoa072366. [DOI] [PMC free article] [PubMed] [Google Scholar]
- 9.Erdmann J, Grosshennig A, Braund PS, Konig IR, Hengstenberg C, Hall AS, Linsel-Nitschke P, Kathiresan S, Wright B, Tregouet DA, Cambien F, Bruse P, Aherrahrou Z, Wagner AK, Stark K, Schwartz SM, Salomaa V, Elosua R, Melander O, Voight BF, O'Donnell CJ, Peltonen L, Siscovick DS, Altshuler D, Merlini PA, Peyvandi F, Bernardinelli L, Ardissino D, Schillert A, Blankenberg S, Zeller T, Wild P, Schwarz DF, Tiret L, Perret C, Schreiber S, El Mokhtari NE, Schafer A, Marz W, Renner W, Bugert P, Kluter H, Schrezenmeir J, Rubin D, Ball SG, Balmforth AJ, Wichmann HE, Meitinger T, Fischer M, Meisinger C, Baumert J, Peters A, Ouwehand WH, Deloukas P, Thompson JR, Ziegler A, Samani NJ, Schunkert H. New susceptibility locus for coronary artery disease on chromosome 3q22.3. Nature genetics. 2009;41:280–282. doi: 10.1038/ng.307. [DOI] [PMC free article] [PubMed] [Google Scholar]
- 10.Kathiresan S, Voight BF, Purcell S, Musunuru K, Ardissino D, Mannucci PM, Anand S, Engert JC, Samani NJ, Schunkert H, Erdmann J, Reilly MP, Rader DJ, Morgan T, Spertus JA, Stoll M, Girelli D, McKeown PP, Patterson CC, Siscovick DS, O'Donnell CJ, Elosua R, Peltonen L, Salomaa V, Schwartz SM, Melander O, Altshuler D, Ardissino D, Merlini PA, Berzuini C, Bernardinelli L, Peyvandi F, Tubaro M, Celli P, Ferrario M, Fetiveau R, Marziliano N, Casari G, Galli M, Ribichini F, Rossi M, Bernardi F, Zonzin P, Piazza A, Mannucci PM, Schwartz SM, Siscovick DS, Yee J, Friedlander Y, Elosua R, Marrugat J, Lucas G, Subirana I, Sala J, Ramos R, Kathiresan S, Meigs JB, Williams G, Nathan DM, MacRae CA, O'Donnell CJ, Salomaa V, Havulinna AS, Peltonen L, Melander O, Berglund G, Voight BF, Kathiresan S, Hirschhorn JN, Asselta R, Duga S, Spreafico M, Musunuru K, Daly MJ, Purcell S, Voight BF, Purcell S, Nemesh J, Korn JM, McCarroll SA, Schwartz SM, Yee J, Kathiresan S, Lucas G, Subirana I, Elosua R, Surti A, Guiducci C, Gianniny L, Mirel D, Parkin M, Burtt N, Gabriel SB, Samani NJ, Thompson JR, Braund PS, Wright BJ, Balmforth AJ, Ball SG, Hall AS, Schunkert H, Erdmann J, Linsel-Nitschke P, Lieb W, Ziegler A, Konig I, Hengstenberg C, Fischer M, Stark K, Grosshennig A, Preuss M, Wichmann HE, Schreiber S, Schunkert H, Samani NJ, Erdmann J, Ouwehand W, Hengstenberg C, Deloukas P, Scholz M, Cambien F, Reilly MP, Li M, Chen Z, Wilensky R, Matthai W, Qasim A, Hakonarson HH, Devaney J, Burnett MS, Pichard AD, Kent KM, Satler L, Lindsay JM, Waksman R, Epstein SE, Rader DJ, Scheffold T, Berger K, Stoll M, Huge A, Girelli D, Martinelli N, Olivieri O, Corrocher R, Morgan T, Spertus JA, McKeown P, Patterson CC, Schunkert H, Erdmann E, Linsel-Nitschke P, Lieb W, Ziegler A, Konig IR, Hengstenberg C, Fischer M, Stark K, Grosshennig A, Preuss M, Wichmann HE, Schreiber S, Holm H, Thorleifsson G, Thorsteinsdottir U, Stefansson K, Engert JC, Do R, Xie C, Anand S, Kathiresan S, Ardissino D, Mannucci PM, Siscovick D, O'Donnell CJ, Samani NJ, Melander O, Elosua R, Peltonen L, Salomaa V, Schwartz SM, Altshuler D. Genome-wide association of early-onset myocardial infarction with single nucleotide polymorphisms and copy number variants. Nature genetics. 2009;41:334–341. doi: 10.1038/ng.327. [DOI] [PMC free article] [PubMed] [Google Scholar]
- 11.Tregouet DA, Konig IR, Erdmann J, Munteanu A, Braund PS, Hall AS, Grosshennig A, Linsel-Nitschke P, Perret C, DeSuremain M, Meitinger T, Wright BJ, Preuss M, Balmforth AJ, Ball SG, Meisinger C, Germain C, Evans A, Arveiler D, Luc G, Ruidavets JB, Morrison C, van der Harst P, Schreiber S, Neureuther K, Schafer A, Bugert P, El Mokhtari NE, Schrezenmeir J, Stark K, Rubin D, Wichmann HE, Hengstenberg C, Ouwehand W, Ziegler A, Tiret L, Thompson JR, Cambien F, Schunkert H, Samani NJ. Genome-wide haplotype association study identifies the SLC22A3-LPAL2-LPA gene cluster as a risk locus for coronary artery disease. Nature genetics. 2009;41:283–285. doi: 10.1038/ng.314. [DOI] [PubMed] [Google Scholar]
- 12.Cornelis MC, Qi L, Zhang C, Kraft P, Manson J, Cai T, Hunter DJ, Hu FB. Joint effects of common genetic variants on the risk for type 2 diabetes in U.S. men and women of European ancestry. Annals of internal medicine. 2009;150:541–550. doi: 10.7326/0003-4819-150-8-200904210-00008. [DOI] [PMC free article] [PubMed] [Google Scholar]
- 13.Paynter NP, Chasman DI, Pare G, Buring JE, Cook NR, Miletich JP, Ridker PM. Association between a literature-based genetic risk score and cardiovascular events in women. Jama. 2010;303:631–637. doi: 10.1001/jama.2010.119. [DOI] [PMC free article] [PubMed] [Google Scholar]
- 14.Price AL, Weale ME, Patterson N, Myers SR, Need AC, Shianna KV, Ge D, Rotter JI, Torres E, Taylor KD, Goldstein DB, Reich D. Long-range LD can confound genome scans in admixed populations. American journal of human genetics. 2008;83:132–135. doi: 10.1016/j.ajhg.2008.06.005. [DOI] [PMC free article] [PubMed] [Google Scholar]
- 15.Ruiz-Narvaez EA, Bare L, Arellano A, Catanese J, Campos H. West African and Amerindian ancestry and risk of myocardial infarction and metabolic syndrome in the Central Valley population of Costa Rica. Human genetics. 2010;127:629–638. doi: 10.1007/s00439-010-0803-x. [DOI] [PubMed] [Google Scholar]
- 16.Ruiz-Narvaez EA, Sacks FM, Campos H. Abdominal obesity and hyperglycemia mask the effect of a common APOC3 haplotype on the risk of myocardial infarction. The American journal of clinical nutrition. 2008;87:1932–1938. doi: 10.1093/ajcn/87.6.1932. [DOI] [PMC free article] [PubMed] [Google Scholar]
- 17.Campos H, Baylin A, Willett WC. Alpha-linolenic acid and risk of nonfatal acute myocardial infarction. Circulation. 2008;118:339–345. doi: 10.1161/CIRCULATIONAHA.107.762419. [DOI] [PMC free article] [PubMed] [Google Scholar]
- 18.Livak KJ. Allelic discrimination using fluorogenic probes and the 5′ nuclease assay. Genet Anal. 1999;14:143–149. doi: 10.1016/s1050-3862(98)00019-9. [DOI] [PubMed] [Google Scholar]
- 19.Livak KJ. SNP genotyping by the 5′-nuclease reaction. Methods Mol Biol. 2003;212:129–147. doi: 10.1385/1-59259-327-5:129. [DOI] [PubMed] [Google Scholar]
- 20.Tregouet DA, Escolano S, Tiret L, Mallet A, Golmard JL. A new algorithm for haplotype-based association analysis: the Stochastic-EM algorithm. Ann Hum Genet. 2004;68:165–177. doi: 10.1046/j.1529-8817.2003.00085.x. [DOI] [PubMed] [Google Scholar]
- 21.Balding DJ. A tutorial on statistical methods for population association studies. Nature reviews. 2006;7:781–791. doi: 10.1038/nrg1916. [DOI] [PubMed] [Google Scholar]
- 22.Haiman CA, Le Marchand L, Yamamato J, Stram DO, Sheng X, Kolonel LN, Wu AH, Reich D, Henderson BE. A common genetic risk factor for colorectal and prostate cancer. Nature genetics. 2007;39:954–956. doi: 10.1038/ng2098. [DOI] [PMC free article] [PubMed] [Google Scholar]
- 23.Qi L, Hu FB, Hu G. Genes, environment, and interactions in prevention of type 2 diabetes: a focus on physical activity and lifestyle changes. Current molecular medicine. 2008;8:519–532. doi: 10.2174/156652408785747915. [DOI] [PubMed] [Google Scholar]
- 24.Qi L, Cho YA. Gene-environment interaction and obesity. Nutr Rev. 2008;66:684–694. doi: 10.1111/j.1753-4887.2008.00128.x. [DOI] [PMC free article] [PubMed] [Google Scholar]
- 25.Kraft P, Hunter DJ. Genetic risk prediction--are we there yet? The New England journal of medicine. 2009;360:1701–1703. doi: 10.1056/NEJMp0810107. [DOI] [PubMed] [Google Scholar]
- 26.Vineis P, Pearce N. Missing heritability in genome-wide association study research. Nature reviews. 2010;11:589. doi: 10.1038/nrg2809-c2. [DOI] [PubMed] [Google Scholar]