

Abstract
Traumatic axonal injury (TAI) is a consistent component of traumatic brain injury (TBI) and is associated with much of its morbidity. Little is known regarding the long-term retrograde neuronal consequences of TAI and/or the potential that TAI could lead to anterograde axonal reorganization and repair. To investigate the repertoire of anterograde and retrograde responses triggered by TIA, Thy1-YFP-H mice were subjected to mild central fluid percussion injury and killed at various times between 15 min and 28 d post-injury. Based upon confocal assessment of the endogenous neuronal fluorescence, such injury was found to result in diffuse TAI throughout layer V of the neocortex within yellow fluorescent protein (YFP)-positive axons. When these fluorescent approaches were coupled with various quantitative and immunohistochemical approaches, we found that this TAI did not result in neuronal death over the 28 d period assessed. Rather, it elicited neuronal atrophy. Within these same axotomized neuronal populations, TAI was also found to induce an early and sustained activation of the transcription factors c-Jun and ATF-3 (activating transcription factor 3), known regulators of axon regeneration. Parallel ultrastructural studies confirmed that these reactive changes are consistent with atrophy in the absence of neuronal death. Concurrent with those events ongoing in the neuronal cell bodies, their downstream axonal segments revealed, as early as 1 d post-injury, morphological changes consistent with reactive sprouting that was accompanied by significant axonal elongation over time. Collectively, these TAI-linked events are consistent with sustained neuronal recovery, an activation of a regenerative genetic program, and subsequent axonal reorganization suggestive of some form of regenerative response.
Introduction
Traumatic axonal injury (TAI) is now appreciated to be a significant component of traumatic brain injury (TBI) (Povlishock et al., 1983; Cordobés et al., 1986; Smith et al., 2003) and a major contributor to patient morbidity (Inglese et al., 2005; Povlishock and Katz, 2005; Lipton et al., 2008, 2009). At present it is unknown whether this morbidity is the result of the axonal injury itself or the retrograde consequences for the sustaining neuronal somata and/or the resulting ongoing anterograde structural plasticity of the affected axon. Axonal injury resulting from direct transection or cortical contusion commonly results in neuronal death (Barron, 2004), although our findings in the diffusely injured brain suggest otherwise (Singleton et al., 2002; Lifshitz et al., 2007). Furthermore, axonal injury can evoke spontaneous structural plasticity (Erb and Povlishock, 1991), with the suggestion that in diffuse TBI this structural plasticity can be either adaptive or maladaptive, depending upon injury severity (Erb and Povlishock, 1991; Phillips and Reeves, 2001). A limiting factor in these studies has been the inability to follow the specific spatiotemporal progression of TAI and to link the observed axonal injury to individual neuronal somatic change and/or anterograde axonal repair or plasticity.
To this end our laboratory has identified, within the neocortex following experimental diffuse TBI, the presence of TAI in close proximity to the sustaining neuronal cell bodies of origin, therefore allowing for the assessment of the somatic response to TAI (Singleton et al., 2002; Lifshitz et al., 2007). Previous studies revealed that TAI, even in close proximity to the sustaining cell body, does not result in acute neuronal death (Singleton et al., 2002) but induces a transient and presumably protective activation of the unfolded protein response. This response occurs concomitantly with an increase in the length of the remaining proximal process (Singleton et al., 2002), suggesting somatic recovery and axonal outgrowth. Given that TAI occurs in the diffusely injured brain within a relatively intact CNS microenvironment uncomplicated by contusion, robust inflammatory response, or significant astrocytic gliosis (Csuka et al., 2000; Singleton et al., 2002; Kelley et al., 2006), we recognized that this provided an unprecedented opportunity to probe the long-term fate of these neurons and their potential for sustained, structural axonal plasticity.
To further facilitate these investigations, the current study used a novel mouse model of diffuse TBI and, via the use of a transgenic mouse strain (Thy1-YFP-H) (Feng et al., 2000), we succeeded in the routine fluorescent microscopic identification of neurons sustaining TAI and in following the chronic fate of this axotomized neuronal population, which was not possible with our previous immunohistochemical approaches. Importantly, TAI within the neocortex induced persistent neuronal atrophy, not neuronal death, within the affected neuronal population and occurred concomitantly with the persistent activation of the transcription factor c-Jun, a known regulator of axonal plasticity (Raivich and Behrens, 2006). Additionally within the same injured neuronal population, we found unprecedented morphological evidence for enduring spontaneous structural plasticity of injured axons following TAI as a consequence of diffuse TBI.
Materials and Methods
Breeding and genotyping of YFP-H transgenic mice
The Thy1-YFP-H line [B6Cg-TgN(Thy1-YFP-H)2Jrs, stock number 003782] was obtained from the Jackson Laboratory and maintained as heterozygotes. Inheritance of the fluorescent transgene was determined from an ear punch taken at weaning (∼21 d). Tissue was mounted on a glass slide and examined using a FITC filter on a Olympus DP71 digital camera (Olympus) where yellow fluorescent protein (YFP)-positive axons could easily be identified in animals carrying the YFP transgene. YFP expression in these mice is under the control of the neuronal-specific Thy1 promoter, resulting in YFP expression in within the neocortex that is primarily restricted to layer V pyramidal neurons (Feng et al., 2000).
Surgical preparation and injury induction
The procedures by which mice were subjected to central fluid percussion injury (cFPI) were modified, with the appropriate scaling, from those previously described using rats (Dixon et al., 1987). Briefly, 45 YFP-H mice weighing 20–26 g were surgically prepared for the induction of cFPI. Each animal was anesthetized in an anesthesia chamber with 4% isoflurane in 100% O2. After induction, each animal's thigh was shaved for intraoperative physiological monitoring and placed in a stereotactic frame (David Kopf Instruments) fitted with a nose cone to maintain anesthesia with 1–2% isoflurane in 100% O2. A thermostatically controlled heating pad (Harvard Apparatus) was then placed under the animal and set to monitor the rectal temperature and, via feedback control, maintain the body temperature at 37°C during the surgery. Pulse rate, respiratory rate, and blood oxygenation were monitored intraoperatively via pulse oximetry using a thigh sensor (STARR Life Sciences) to ensure the maintenance of normal physiologic homeostasis with the exclusion of animals sustaining any physiological anomaly. A midline sagittal incision was made to expose the skull from bregma to lambda. The skull was cleaned and dried and a 3.0 mm circular craniotomy was then made along the sagittal suture midway between bregma and lambda, leaving the underlying dura intact. A sterile Leur-Loc syringe hub was then cut away from a 20 gauge needle and affixed to the craniotomy site using cyanoacrylate. Upon confirming the integrity of the seal between the hub and the skull, dental acrylic was then applied around the hub to provide stability during the induction of injury. After the dental acrylic hardened, the scalp was sutured around the hub, topical bacitracin and lidocaine ointment were applied to the incision site, and the animal was removed from anesthesia and monitored in a warmed cage until fully ambulatory (∼60–90 min). For the induction of injury, each animal was reanesthetized with 4% isoflurane in 100% O2, and the male end of a spacing tube was inserted into the hub. The female end of the hub spacer assembly, filled with normal saline, was attached on to the male end of the fluid percussion apparatus (Custom Design and Fabrication; Virginia Commonwealth University; Richmond, VA). An injury of mild to moderate severity (1.7 ± 0.04 atmospheres) was administered by releasing a pendulum onto a fluid-filled piston to induce a brief fluid pressure pulse upon the intact dura. The pressure pulse measured by the transducer was displayed on a storage oscilloscope (Tektronix 5111), and the peak pressure was recorded. After injury, the animals were visually monitored for recovery of spontaneous respiration. The hub and dental acrylic were removed en bloc, and the incision was rapidly sutured before recovery from anesthesia/unconsciousness. Topical bacitracin and lidocaine were then applied to the closed scalp incision. The duration of transient unconsciousness was determined by measuring the time it took each animal to recover the following reflexes: toe pinch, tail pinch, corneal blink, pinnal, and righting. After recovery of the righting reflex, animals were placed in a warmed holding cage to ensure the maintenance of normothermia and monitored during recovery before being returned to the vivarium. For animals receiving a sham injury, all of the above steps were followed with the exception of the release of the pendulum to induce the injury. To verify a significant injury effect, righting reflex recovery times were analyzed with a two-way ANOVA with a Tukey's honestly significant difference (HSD) post hoc analysis.
Tissue preparation for single and double label immunofluorescence
After injury, animals were allowed to recover for times ranging from 15 min to 28 d (sham, n = 14; 15 min, n = 3; 1 h, n = 3; 1 d, n = 12; 3 d, n = 9; 7 d, n = 8; 14 d, n = 10; 28 d, n = 8). At the predetermined survival times, mice were intraperitoneally injected with an overdose of sodium pentobarbital and then transcardially perfused with heparinized normal saline followed by 4% paraformaldehyde in Millonig's buffer. Several animals (n = 4) were perfused with 4% paraformaldehyde/0.2% glutaraldehyde for optimal processing by electron microscopy. After perfusion, the occipital and parietal bones were removed and the brain and remaining skull were immersed in the perfusion fixative for 24 h at 4°C. Each brain was then removed from the skull and blocked coronally at the optic chiasm and the midbrain to include the parietal and temporal cortices, hippocampus, and thalamus. Blocked brains were flat mounted with cyanoacrylate and embedded in agar, and 40 μm free-floating coronal serial tissue sections were cut using a vibratome (Leica VT1000S; Leica Microsystems). Sections were collected from −0.58 mm to −2.5 mm posterior to bregma (Paxinos and Franklin, 2003) for a total of 48 sections. The tissue was stored in Millonig's buffer in 24-well culture plates until further use (Falcon; BD Biosciences).
Single and double labeling immunofluorescence protocol
Primary antibodies used include polyclonal rabbit anti-APP (amyloid-β precursor protein) (C terminus) (1:700; Zymed Laboratories), polyclonal rabbit anti-phospho-c-Jun (Ser63) (1:100; Cell Signaling Technology), polyclonal rabbit anti-ATF-3 (activating transcription factor 3) (1:100; Santa Cruz Biotechnology), monoclonal mouse anti-NeuN (neuronal-specific nuclear protein) (1:500; clone A60; Millipore), monoclonal mouse anti-GFAP (glial fibrillary acidic protein) (1:500; clone G-A5; Sigma-Aldrich), and monoclonal mouse anti-APC (adenomatous polyposis coli; CC-1) (1:100; EMD Biosciences). Phospho-c-Jun antibodies were used to aid in the identification of neurons sustaining TAI and to assess the fate of their related proximal axonal segments at later time points, as elevated expression and activation, via phosphorylation, of c-Jun has been characterized following a variety of both PNS and CNS axonal injury paradigms (Hughes et al., 1999; Richardson et al., 2009). General immunostaining protocols were as follows: endogenous peroxidase activity was blocked with 0.5% H2O2 in PBS for 30 min. Following three 10 min rinses in PBS or Tris-buffered saline (TBS) (for antibodies targeting phosphorylated antigens), sections were then processed using a previously described protocol for temperature-controlled microwave antigen retrieval (Stone et al., 1999). After microwave antigen retrieval, sections were preincubated for 2 h in 10% normal goat serum (NGS) with 1.5% Triton X-100 and 2% bovine serum albumin (BSA) in PBS (or TBS). When necessary, endogenous mouse IgG was blocked when using primary antibodies derived from a mouse host (Mouse on Mouse Kit, MOM; Vector Laboratories). The tissue was then incubated overnight in the primary antibody (or antibodies) in 10% NGS with 0.5% Triton X-100 and 2% BSA in PBS (or TBS). Following primary incubation, tissue sections were rinsed six times for 10 min each in 1% NGS with 0.2% Triton X-100 and 1% BSA in PBS (or TBS) and then incubated in the appropriate Alexa Fluor secondary antibody (Alexa 568, Alexa 594, and Alexa 633) (Invitrogen) diluted 1:200 in the above 1% NGS solution with care to avoid exposure to light. Following incubation in secondary antibody, tissue sections were rinsed in PBS (or TBS), mounted on gelatin-coated glass slides, and coverslipped using Vectashield HardSet mounting medium with 4′,6-diamidino-2-phenylindole (Vector Laboratories).
Electron microscopy immunolabeling protocol
Selected sections from animals killed at 1, 3, 7, 14, and 28 d after injury were subjected to further processing, using antibodies to YFP or phospho-c-Jun, for EM analysis to ascertain the effect of axonal injury on subcellular organization and to survey for any signs indicative of cellular fate. For tissue sections processed with antibodies targeting YFP, select sections were briefly wet mounted and coverslipped. Neurons displaying overt axonal pathology were identified and digital images (4× and 10×) were acquired to use following EM processing (see below, Electron microscopy) to aid in identifying the neurons of interest. Tissue sections were then postfixed by immersion in 4% paraformaldehyde/0.2% glutaraldehyde in Millonig's buffer for 1 h before immunolabeling. Sections were rinsed four times (10 min) in PBS (or TBS) and endogenous peroxidase activity was blocked with 0.5% H2O2 in PBS (or TBS) for 30 min. Sections were then processed using the temperature-controlled microwave antigen retrieval approach described previously (Stone et al., 1999). After microwave antigen retrieval, sections were preincubated for 1 h in 10% NGS with 0.2% Triton X-100 in PBS (or TBS). The tissue was then incubated overnight in a 1:100 dilution of the phospho-c-Jun antibody or a 1:7500 dilution of a rabbit polyclonal anti-green fluorescent protein (GFP) antibody (AB3080, Millipore), which also recognizes YFP. Sections were then incubated for 1 h in biotinylated goat anti-rabbit secondary antibody (IgG) (Vector Laboratories) and diluted at 1:200 in 1% NGS in PBS and then for 1 h in a 1:200 dilution of an avidin-horseradish peroxidase complex (ABC Standard Elite Kit, Vector Laboratories). The reaction product was visualized with 0.05% diaminobenzidine, 0.01% hydrogen peroxide, and 0.3% imidazole in 0.1 m phosphate buffer for 10–20 min. Sections were rinsed and stored in buffer until further processing for EM.
TUNEL immunohistochemistry
To identify nuclear fragmentation within degenerating cells, tissue sections from selected injured and sham-injured animals surviving 1, 3, 7, 14, and 28 d were processed using a TUNEL (terminal deoxynucleotidyl transferase dUTP nick end labeling) kit (ApoTag Peroxidase In Situ Apoptosis Detection Kit; Millipore), according to the manufacturer's protocol. Sections were rinsed in PBS for 5 min and pretreated with 0.5% Triton X-100 (Sigma) for 10 min. Sections were treated with 3.0% H2O2 for 5 min to quench endogenous peroxidase activity and washed twice for 5 min in PBS. The proprietary equilibration buffer was applied to the sections for 10 min, after which terminal deoxynucleotidyl transferase (TdT) was applied for 60 min while incubated in a humidified chamber at 37°C for 1 h. The slides were then immersed in the proprietary stop/wash buffer for 10 min, and the sections were then incubated at room temperature in a humidified chamber for 45 min in the anti-digoxigenin peroxidase conjugate. After four 2 min rinses in PBS, the reaction product was developed with 0.05% diaminobenzidine (Sigma) and 0.01% H2O2 in 0.1 m phosphate buffer for 10 min. After rinsing three times for 1 min in double-distilled H2O, sections were dehydrated and slides were coverslipped for routine light microscopic analysis. Coronal sections (40 μm) from postnatal day (P) 4/5 YFP-H mouse pups and sham-injured tissue sections, pretreated with DNase, were used as positive controls, and omission of the TdT enzyme and/or anti-digoxigenin antibody was used to generate negative controls.
Routine fluorescent image acquisition and quantitative analyses
Quantitative analyses were performed on coronal sections corresponding to −0.58 mm to −2.5 mm posterior to bregma. A blinded investigator performed all quantitative analyses. For quantitative APP and phospho-c-Jun studies, a random starting well was selected (wells 1–6) and eight coronal tissue sections from each case, each 240 μm apart, were selected for immunolabeling by APP with adjacent sections used for immunolabeling by phospho-c-Jun. The remaining tissue sections were processed either for qualitative immunofluorescent or ultrastructural analysis. Quantitative fluorescent microscopic analyses and image acquisition were performed using a Nikon Eclipse 800 microscope fitted with an Olympus DP71 digital camera (Olympus) with the appropriate excitation/emission filters.
Quantification of the percentage of YFP+ neurons with overt axonal swellings.
To determine the number of YFP neurons sustaining axotomy, one section per injured animal (corresponding to 2.22 mm posterior to bregma) at 1 d post-injury was selected for quantitative analysis. Quantification was restricted to YFP+ neurons within a neocortical region extending from a point delineated by the lateral extent of the hippocampus in one hemisphere to a point at the lateral extent of the hippocampus in the contralateral hemisphere. YFP+ neurons within layer V of this region were counted together with those YFP+ neurons revealing axonal swellings.
Quantification of APP expression within YFP+ swellings.
To determine the extent to which the pathology evident in YFP+ axons correlates with a traditional marker of axonal injury, APP-immunostained sections from YFP+ mice killed at 1 d after injury were subjected to quantitative immunofluorescent microscopic analysis. Briefly, YFP+ swellings throughout the neocortex bilaterally were classified as one of the following: (1) proximal YFP+ swellings demonstrating unequivocal connectivity to their neuronal somata of origin; (2) distal YFP+ swellings located in or below layer VI; or (3) YFP+ swellings located within the subcortical white matter (corpus callosum and external capsule). Within each category, the number of YFP+ swellings colabeling with APP was determined and then evaluated for significance with a split-plot ANOVA followed by individual paired sample t tests with a Bonferroni correction for multiple comparisons.
Quantification of YFP+ neurons in layer V following injury.
To determine whether cFPI induced YFP neuronal loss, the number of YFP neurons within the above-described APP-immunostained tissue sections was quantified. Low-power epifluorescent images (4×) were captured and tiled together using Photoshop CS3 (Adobe Systems). Quantification and analyses of tiled images was conducted using the IPLab software package (BioVision Technologies). Images were converted to gray scale. Quantification was confined to a defined region of interest (1.0 mm × 0.5 mm) centered over the mediodorsal neocortex. A cyan overlay (based upon predetermined image intensity threshold levels) was projected over the gray scale image, and a computer-automated count of the number of YFP+ cells was conducted employing an exclusion criteria based upon size (>50 and <300 μm2). The data were evaluated for significance with a two-way ANOVA with a least significant difference (LSD) post hoc analysis.
Quantification of YFP+ axotomized neurons with somatic expression of phospho-c-Jun.
To determine the percentage of axotomized YFP+ neurons that also express phospho-c-Jun, coronal tissue sections from mice killed at 1 d and 3 d post-injury were subjected to quantitative fluorescent microscopic analysis. These time points were chosen because of the ease with which consistent axonal pathology could be identified within the YFP+ population. Briefly, two distinct YFP+ populations were identified: (1) neurons exhibiting proximal swellings, demonstrating unequivocal connectivity to their neuronal somata of origin; or (2) neurons maintaining intact axons, passing through the neocortical gray matter and into the underlying white matter while showing no morphological evidence of pathology (swelling or vacuolization). Following identification, each population was quantitatively assessed for expression of phospho-c-Jun. The data were evaluated for significance via a split-plot ANOVA followed by individual paired sample t tests with a Bonferroni correction for multiple comparisons.
Quantification of somatic area of YFP+/phospho-c-jun+ neurons.
To evaluate for atrophic change in the somata of axotomized neurons, phospho-c-Jun-labeled tissue sections from mice killed at 1, 3, 7, 14, and 28 d post-injury were subjected to quantitative fluorescent microscopic analysis. YFP+/phospho-c-Jun+ cells within layer V were identified throughout the entire neocortex, and 40× images were acquired of each neuron. The somata of YFP+/phospho-c-Jun+ neurons were outlined, and the somatic area of each was measured (IPLab, BioVision Technologies). YFP+/phospho-c-Jun-negative neurons from layer V in comparable regions in sham animals were used as controls. The data were evaluated for significance via a two-way ANOVA with a LSD post hoc analysis.
Quantification of the length of YFP+/phospho-c-Jun+ axons.
Utilizing the same images detailed above, the length of the remaining proximal processes of YFP+/phospho-c-Jun+ neurons at each time point (1, 3, 7, 14, and 28 d post-injury) was measured (Photoshop CS3; Adobe) from the beginning of the axon hillock to the visualized axon termination, where continuity with the neuronal somata of origin was unequivocal. The data were evaluated for significance with a one-way ANOVA and a LSD post hoc analysis.
Assessment of injury-induced, generalized neocortical atrophy.
To assess for any injury-induced generalized neocortical atrophy, two sections from each animal (corresponding to 1.58 and 2.22 mm caudal to bregma) from 1, 3, 7, 14, and 28 d post-injury were selected and the cortical thickness measured. For each tissue section measurements were made over the extent of the neocortex at a point dorsal to the lateral extent of the hippocampus, employing a line parallel to the YFP fibers in that region. The measurements were initiated at the neocortical surface and terminated at the ventral extent of the subcortical white matter (SCWM). Moving medially in 300 μm steps, three more measurements of neocortical thickness were made in similar fashion. This was repeated in the opposite hemisphere and all the values were averaged for each tissue section. Measurements were made for each animal and analyzed for significant changes with a two-way ANOVA and a Tukey's HSD post hoc analysis.
Quantification of YFP+/phospho-c-Jun+ axonal profiles.
Quantitative analyses of the different axonal morphologies within the YFP+/phospho-c-Jun+ neuronal population were conducted. Briefly, under 40× magnification YFP+/phospho-c-Jun+ neurons were identified in layer V throughout the entire coronal section (approximately eight sections per animal) from injured animals at 1, 3, 7, 14, and 28 d post-injury. Neurons were subsequently categorized based upon the morphology of their remaining proximal axonal processes into three distinct populations: (1) neurons with proximal processes showing clear axonal pathology in the form of axonal swellings and/or vacuolization; (2) neurons with axons that were truncated and terminated near the cell body of origin (<50 μm) with no pathological swellings, often showing evidence for local sprouting; and (3) neurons with relatively long axons (>50 μm) displaying no evidence of axonal pathology (no axonal swelling or vacuolization) and terminating within the gray matter below layer V. The populations were statistically analyzed for any significant change in the populations over time post-injury with a split-plot ANOVA with a LSD post hoc analysis. The number of truncated axonal segments displaying reactive sprouting, as evident by more than one process originating from the proximal stump, was quantified for each time point and the data analyzed for significant change over time with a one-way ANOVA with a LSD post hoc analysis.
Confocal microscopy and image deconvolution
Images of axotomized YFP+ neurons were acquired with a Leica TCS-SP2 AOBS confocal microscope (Leica Microsystems). Images presented are z-axis projections compiled using ImageJ (NIH). When capturing images of YFP+ swellings and/or putative growth cones, care was taken to select swellings/growth cones in the center of the tissue sections only, so as to avoid sectioning artifacts. A sequential scan was used to eliminate the potential for crosstalk between the YFP fluorophore and the Alexa Fluor dyes used for immunolabeling. Projection images were deconvolved using the IPLab software package (BioVision Technologies) with the in focus two-dimensional blind deconvolution algorithm. For three-dimensional rendering, the Volocity software package (PerkinElmer) was used to reconstruct putative growth cones in three dimensions to verify their shape and characteristics.
Electron microscopy
Selected GFP- (or YFP-) and phospho-c-Jun-labeled cortical sections from animals killed at 3, 7, 14, and 28 d after injury were subjected to further processing for EM analysis to ascertain the effect of axonal injury on subcellular organization and to survey for any signs indicative of cellular fate. The tissue was osmicated, dehydrated, and flat embedded between plastic slides in Medcast resin (Ted Pella). The embedded slides were then scanned to identify axotomized YFP+ neurons previously identified at the fluorescent microscopic level or to identify phospho-c-Jun+ neurons within neocortical layer V. Once identified, these sites were removed, mounted on plastic studs, and thick sectioned to the depth of the immunoreactive sites of interest. One thick section cut before collection of the serial thin sections was retained and used to identify the location of labeled neurons of interest and their location relative to fiduciary markers within the tissue section to enable accurate identification when collecting images with the transmission electron microscope. Serial 70 nm sections were cut and picked up onto Formvar-coated slotted grids. The grids were then stained in 5% uranyl acetate in 50% methanol for 2 min and in 0.5% lead citrate for 1 min. Ultrastructural analysis was performed using a JEM-1230 transmission electron microscope (JEOL) equipped with an UltraScan 4000SP 4000 × 4000 pixel CCD camera (Gatan).
Results
Mild to moderate cFPI in mice induced a transient behavioral suppression of the righting reflex in all injured animals of 7.5 ± 0.3 min that was significantly longer than that of 3.3 ± 0.1 min for sham-injured animals (p < 0.05). Furthermore, no significant difference in righting reflex suppression was noted between injury groups (p > 0.05), indicating that all groups received injuries of comparable severity. No hindlimb seizures were noted in any animals, though a transient apnea was observed in several animals following injury. This apneic episode was of short duration (<1 min) and resolved spontaneously without intervention. Of 53 injured mice used in the study, 48 survived the fluid percussion injury, resulting in a mortality rate of 9.4%, consistent with previous mortality rates for mild central fluid percussion injury in rats.
TAI in YFP-H mice following mild to moderate cFPI
Consistent with previous studies using the YFP-H transgenic strain of mice (Sugino et al., 2006; Carter et al., 2008; Li and Murphy, 2008), YFP+ neurons in the neocortex of injured and sham-injured control animals were observed primarily within layer V, although isolated, scattered YFP+ neurons could also be observed within more superficial neocortical layers. Following sham-injury, no YFP+ axonal swellings indicative of axonal damage were observed in the neocortex or the underlying SCWM. Axons arising from YFP+ pyramidal neurons in sham-injured animals were continuous and of fine caliber and could be routinely followed from their neuronal cell body of origin in layer V into the underlying SCWM. Following injury, all tissue sections processed for YFP visualization as well as parallel immunohistochemical analyses revealed a pattern of macroscopic and microscopic change consistent with that routinely described in the rat cFPI model of mild to moderate severity (Dixon et al., 1987; Singleton et al., 2002). The dorsal neocortex showed no evidence of contusion or cavitation. The brain parenchyma itself was devoid of overt hemorrhage, with only isolated petechial hemorrhages observed in the corpus callosum. Limited subarachnoid bleeding was found over the dorsal convexity incident to the site of injury; however, beyond this focus of subarachnoid hemorrhage there was no involvement of the subarachnoid compartment. At all survival times, the ventricular system maintained a normal appearance with no evidence of trauma-induced ventricular enlargement. Despite this preservation of brain parenchymal integrity typical of a mild diffuse TBI, the forces of injury consistently evoked YFP+ axonal swellings consistent with TAI over a specific temporal framework as detailed below. These axonal swellings were localized within the mediodorsal neocortex in layer V (Fig. 1B,C,E, arrows) and scattered within the SCWM (see Fig. 3A, red arrowheads) where they were found adjacent to other intact axonal profiles. Quantitatively, within this region 4.8 ± 0.7% of the YFP+ neurons (at 1 d post-injury) displayed axonal swellings. Many YFP+ axonal swellings were observed in direct continuity with their neuronal cell bodies of origin in neocortical layer V (Fig. 1B,C,E). Underscoring the diffuse nature of the injury, YFP+ neurons sustaining TAI and their related axonal swellings could be found interspersed among YFP+ neurons showing no morphological evidence of either primary axonal injury or retrograde neuronal involvement (Fig. 1D). Importantly, YFP+ neurons sustaining TAI were consistently identified within the same neocortical regions of all injured animals, indicating a generalized diffuse response to injury rather than an isolated focal event.
Figure 1.

Diffuse brain trauma results in traumatically induced axotomy in YFP-H mice (1 d post-injury). A, YFP-H mice express YFP predominantly within layer V of the neocortex. B–E, Moderate cFPI in YFP-H mice induces axotomy throughout the mediodorsal neocortex (B, C, E, arrows). Note the diffuse nature of the injury with the axons of several neurons sustaining axotomy (B, C, E) situated adjacent to what appear to be healthy neurons with intact axonal projections (D). Further note that this diffuse axotomy occurs without any evidence of hemorrhage or overt tissue damage. Cells in B–D are located within the closed box area in A, while the cell in D is located within dotted boxed area in A. Scale bars: A, 500 μm, (in E) B–E, 20 μm.
Figure 3.

β-APP is predominantly localized to proximal but not distal or SCWM YFP+ swellings. A–C, Representative image of an axotomized YFP+ neuron (A) labeled with APP (B). The percentage of proximal YFP+ swellings (white/black arrows) exhibiting APP immunoreactivity is significantly greater (C) than the percentage of distal (white/black arrowheads) and SCWM (red arrowheads) YFP+ swellings that are immunopositive for APP. +p < 0.001; *p < 0.01. Scale bar: (in B) A, B, 40 μm.
The axonal swellings noted above were observed as early as 15 min following injury, both in layer V of the neocortex (Fig. 2A, arrowhead) and scattered within the SCWM. At these early time points, many of these small (∼5 μm) YFP+ swellings showed no evidence of disconnection and often consisted of an injured, multilobulated axonal segment with a proximal swelling (Fig. 2A,B, arrowheads) in continuity with distal swelling (Fig. 2A,B, arrows). By 1 d post-injury, however, the majority of proximal YFP+ swellings (those in continuity with the neuronal cell body of origin) had increased in size (∼20 μm) and now demonstrated clear disconnection from the distal axonal segment (Fig. 2C, arrowhead). Similarly, distal YFP+ axonal swellings capping the distally disconnected axonal segment could be identified between layer V and the SCWM. Similar to the proximal swellings, the distal swellings at 1 d post-injury had increased in size relative to earlier time points post-injury. Many of these distal swellings displayed a spatial regression whereby they were no longer found adjacent to the correlating proximal axonal swelling (Fig. 3A, black arrowhead). Rather, they were found approximating the SCWM, suggesting axonal dieback. By 2 d post-injury, the number of robust proximal axonal swellings was diminished, transitioning to more subtle axonal alterations reflected as smaller and more tapered swellings at the terminal end of proximal processes (Fig. 2G) that persisted up to 7 d following injury (Fig. 2I). Assessment of the morphology of injured axons with a high degree of fidelity beyond 7 d post-injury, however, proved challenging without the use of other investigative tools. Beyond this time point, no overt evidence for pathological alteration within YFP+ axons could be readily detected. Although, when a somatic marker of axotomy was employed to aid in the identification (detailed below in Activation of c-Jun as a somatic marker of TAI) of this axotomized neuronal population, more subtle alterations were readily apparent. Despite the inability to identify alterations within proximal processes at later time points, many distal YFP+ swellings remained visible, scattered throughout the neocortex through 14 d post-injury (data not shown).
Figure 2.

β-APP is localized to proximal axotomized YFP+ processes at early time points following cFPI but is absent at chronic time points post-injury. A–L, Representative images of YFP+ axons demonstrating pathological alteration at 15 m (A, D), 1 h (B, E), 1 d (C, F), 2 d (G, J), 3 d (H, K), and 7 d (I, L) post-injury. Arrowheads indicate proximal swellings. Arrows indicate distal swellings. Note the lack of APP immunoreactivity within proximal YFP+ axonal profiles at 2 d (J), 3 d (K), and 7 d (L) post-injury. Also, where visible, note the lack of APP immunoreactivity within distal YFP+ swellings (arrows). YFP, Green; APP, red. Scale bar: 20 μm.
APP expression following cFPI and correlation to YFP-linked axonal changes
To determine the extent to which pathology evident from YFP expression in axons correlates with a known and routinely used marker of TAI, qualitative and quantitative immunohistochemical studies using antibodies against APP were performed. While detailed analyses of APP expression within injured YFP-H mice were restricted to the neocortex and underlying SCWM, scattered APP+ swellings were also observed in the dorsolateral thalamus and the dentate gyrus of the hippocampus following injury (Fig. 4E,I) consistent with the spatial distribution of APP swellings within gray matter observed in previous studies using a rat model of mild to moderate cFPI (Singleton et al., 2002; Kelley et al., 2006, 2007; Lifshitz et al., 2007). Sections from sham-injured animals exhibited limited background APP staining within the gray matter of the neocortex, hippocampus, and thalamus. Within these areas, isolated neuronal somata immunoreactive for APP were observed, particularly within layers II–III. However, no APP+ axons were discerned in continuity with these immunoreactive somata, nor were APP+ swellings observed in the SCWM of sham-injured animals (data not shown).
Figure 4.
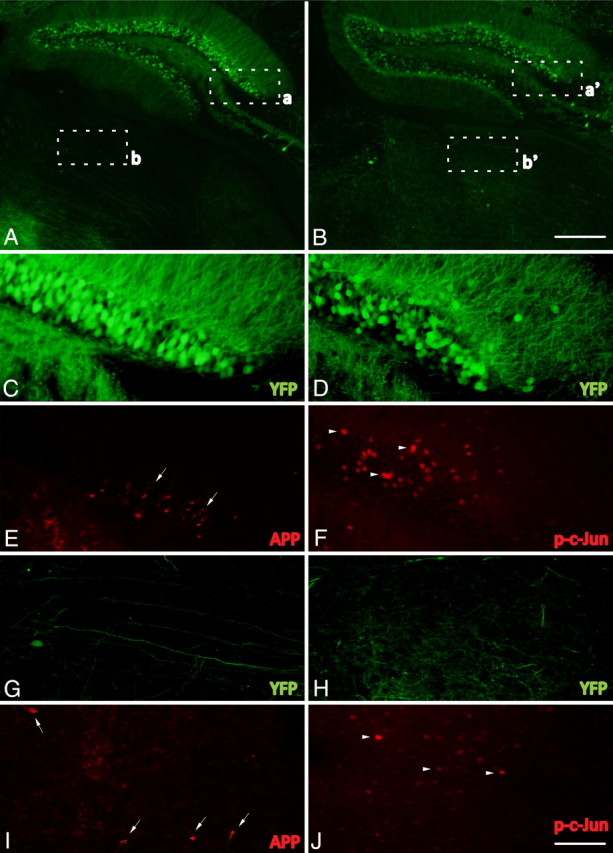
Phospho-c-Jun expression is spatially restricted to regions associated with TAI following cFPI. A–J, Representative images of the hippocampus and the thalamus of injured YFP+ mice 1 d following cFPI (A, B) immunolabeled with antibodies targeting β-APP (APP) (C, E, G, I) and phospho-c-Jun (p-c-Jun) (D, F, H, J). Note that APP+ axonal swellings can be observed within the dentate gyrus of the hippocampus (C, E, arrows) as well as the dorsolateral thalamic nuclei (G, I, arrows). Also note that phospho-c-Jun+ cells (D, F, H, J, arrowheads) can be found within the same anatomical regions. Insets: a, C and E; b, G and I; a′, D and F; b′, H and J. Scale bars: (in B) A, B, 250 μm; (in J) C–J, 50 μm.
At 15 min (Fig. 2D) and 1 h (Fig. 2E) post-injury, the small YFP+ proximal axonal swellings in layer V of the neocortex were consistently found to be immunoreactive for APP. In the YFP+ axonal swellings at these early time points post-injury, APP immunoreactivity was restricted to the evolving proximal swellings and did not appear in the intervening axonal segment between the swelling and the neuronal cell body of origin. In contrast to the proximal swellings (Fig. 2D,E, arrowheads), the distal swellings (Fig. 2D,E, arrows) were consistently devoid of APP immunoreactivity. At 1 d post-injury the majority of YFP+ proximal swellings remained positive for APP immunoreactivity (Fig. 2F), while the enlarged distal swellings again revealed no APP immunoreactivity (see Fig. 3B, arrowhead). Importantly, proximal axons demonstrating pathological alterations identified via YFP expression observed at 2 d (Fig. 2G, arrowhead), 3 d (Fig. 2H, arrowhead), and 7 d (Fig. 2I, arrowhead) following injury were now devoid of APP immunoreactivity (Fig. 2J,K,L arrowheads), consistent with previous reports of a diminished number of APP+ swellings at these later time points post-injury (Singleton et al., 2002). Additionally, this temporal loss of APP reactivity within the neocortex was mirrored within the hippocampus and thalamus (data not shown).
Quantitative assessment confirmed that the majority (89.7 ± 1.3%) of proximal YFP+ swellings at 1 d following injury also exhibited APP immunoreactivity (Fig. 3). In contrast to proximal swellings, only 3.1 ± 1.5% of distal YFP+ swellings and 12.4 ± 2.5% of SCWM YFP+ swellings exhibited APP immunoreactivity. This resulted in a statistically significant difference between the proximal and distal APP localization (p < 0.001), the proximal and SCWM APP localization (p < 0.001), and the distal and SCWM APP localization (p < 0.01). Thus, while APP immunoreactivity revealed early YFP+ proximal swellings with a high degree of fidelity, it failed to label the majority of the distal and SCWM YFP+ swellings.
As noted previously, YFP expression routinely revealed axonal alterations up to 7 d post-injury, yet it was not a consistent marker of the altered proximal axonal segments or their linkage to the neuronal cell body of origin beyond 7 d post-injury. Thus, to more rigorously follow these disconnected proximal axonal profiles while also assessing the fate of their cell bodies of origin, a parallel somatic marker of axonal injury was employed to enable the precise and consistent identification of this injured population at more chronic time points post-injury.
Activation of c-Jun as a somatic marker of TAI following cFPI
Following cFPI, phospho-c-Jun immunoreactivity was observed throughout the neocortex, dorsolateral thalamus (Fig. 4J) and the hilus of the dentate gyrus of the hippocampus (Fig. 4F), regions previously demonstrated to sustain TAI following cFPI. Phospho-c-Jun expression in the injured neocortex was restricted primarily to layer V of the neocortex (Fig. 5B,F,J,N,R), with many cells exhibiting expression as late as 28 d post-injury (Fig. 5R). Importantly, expression of phospho-c-Jun in the neocortex, hippocampus, and thalamus was absent throughout this time course in sham-injured animals (Fig. 5D,H,L,P,T). Phospho-c-Jun+ cells routinely colabeled with the neuronal marker NeuN (Fig. 6A–D) following injury, with only rare phospho-c-Jun cells colocalizing with a common oligodendrocytic marker, APC (CC1) (Fig. 6E–H). No GFAP+ astrocytes labeling positive for phospho-c-Jun were observed within the neocortex (Fig. 6I–L).
Figure 5.

Phospho-c-Jun expression in the neocortex is restricted to cells within layer V and persists up to 28 d post-injury. A–T, Representative images of phospho-c-Jun expression in injured (Inj) YFP mice at 1 d (A, B), 3 d (E, F), 7 d (I, J), 14 d (M, N), and 28 d (Q, R) and in sham-injured animals at 1 d (C, D), 3 d (G, H), 7 d (K, L), 14 d (O, P), and 28 d (S, T). Elevated expression of phospho-c-Jun (p-c-Jun) is evident at 1 d post-injury (B) and persists as late as 28 d post-injury (R). Phospho-c-Jun expression is predominantly restricted to cells residing within layer V, the same neocortical layer that contains YFP+ neurons sustaining TAI (see dotted lines). No phospho-c-Jun+ cells within layer V were observed in sham-injured animals (D, H, L, P, T). Scale bar: 200 μm.
Figure 6.

Phospho-c-Jun is predominantly expressed within neurons following cFPI. A–L, At 1 d post-injury, the majority of phospho-c-Jun+ (p-c-Jun) cells exhibit positive labeling for the neuronal marker NeuN (B–D, arrowheads) and are negative for the astrocytic marker GFAP (J–L). Only the occasional APC (CC1)+ oligodendrocyte expresses phospho-c-Jun following injury (F–H, arrowheads), and these can be easily distinguished from YFP+/phospho-c-Jun+ neurons. Note that all axotomized YFP+ neurons exhibiting swellings (A, E, I, arrows) also reveal phospho-c-Jun+ nuclei (B, F, J, arrows). Scale bar: (in L) A–L, 100 μm.
To establish the precise relationship between c-Jun activation and TAI in our model, a quantitative analysis of c-Jun activation in axotomized YFP+ neurons was conducted at 1 and 3 d following injury. These time points were chosen due to the ease with which consistent axonal pathology could be identified within the YFP+ population. At 1 d following injury 84.9 ± 4.0% of YFP+ neurons (Fig. 7A, red arrow) with axonal swellings (Fig. 7A, red arrowhead) expressed phospho-c-Jun (Fig. 7B, red arrow), whereas only 2.5 ± 1.1% of YFP+ neurons with intact, nonaxotomized axons (Fig. 7A, yellow arrowhead) expressed phospho-c-Jun (Fig. 7A,B, yellow arrows). Similarly, at 3 d post-injury 94.1 ± 3.7% of axotomized YFP+ neurons expressed phospho-c-Jun (Fig. 7C,D, red arrows), while only 0.9 ± 0.5% of intact, nonaxotomized YFP+ neurons expressed phospho-c-Jun (Fig. 7C,D, yellow arrows). Collectively, these findings demonstrate a highly significant linkage between the presence of neuronal somatic c-Jun activation and the occurrence of TAI (p < 0.001). Having identified c-Jun activation as a rigorous somatic marker of TAI following cFPI, as well as establishing the advantages of fluorescent-based methodologies for evaluating axonal morphology, we next evaluated the chronic retrograde, somatic changes occurring in the neuronal population sustaining TAI as well as the long-term fate of their proximal axonal segments.
Figure 7.

Expression of phospho-c-Jun correlates with TAI following cFPI. A–E, YFP+ neurons at 1 d (A, B) and 3 d (C, D) post-injury were identified and classified into two groups: YFP+ neurons (red arrows) exhibiting unequivocal axon pathology (red arrowheads), and those YFP+ neurons (yellow arrows) with intact axons (yellow arrowheads) coursing into the SCWM. The percentage of neurons in each group that also express phospho-c-Jun (p-c-Jun) (B, C) at each time point is presented quantitatively in E. *p < 0.001 Scale bar: (in D) A–D, 40 μm.
Evidence for persistent TAI-induced neuronal atrophy, not neuronal death
To assess for chronic atrophic change within the axotomized YFP+ neuronal population that also expressed phospho-c-Jun following injury, the neuronal somatic area of YFP+/phospho-c-Jun+ neurons was quantified. At 1 d post-injury there was no significant difference in the area of YFP+/phospho-c-Jun+ somata compared to that of sham animals (Fig. 8A). However, a significant reduction in somatic area relative to that of sham animals was observed as early as 3 d post-injury, and this atrophy extended throughout the time course studied (p < 0.01) (Fig. 8A). Additionally, this decline in somatic area revealed significant progression at the more chronic time points post-injury (7, 14, and 28 d) compared to the more acute time points of 1 and 3 d (p < 0.05, p < 0.01, p < 0.01, respectively) (Fig. 8A). Importantly, these changes occurred without evidence of generalized neocortical atrophy as reflected by the fact that the neocortical thickness was unaltered within injured groups when compared to sham-injured controls (data not shown).
Figure 8.
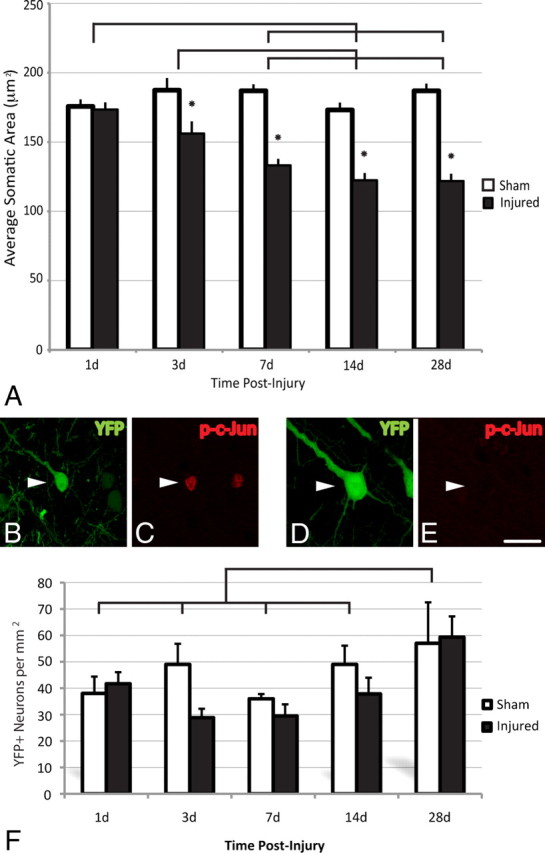
TAI results in chronic neuronal atrophy, not neuronal loss. A–F, Representative images of YFP+ neurons (see arrowheads) at 28 d post-injury (B, D) immunostained for phospho-c-Jun (p-c-Jun) (C, E). Note the atrophic change within the YFP+/phospho-c-Jun+ neuronal population (B, C) when compared to the YFP+/phospho-c-Jun-negative population (D, E), which is demonstrated quantitatively in A. No significant loss of YFP+ pyramidal neurons was observed at any time point studied (1–28 d) (F). The significant increase in the total number of YFP+ neurons observed at 28 d post-injury when compared to all other groups likely reflects an increase in the expression of YFP as animals age. Lines indicate a significant difference (p < 0.05) between time points, and the asterisk (*) indicates a significant difference from sham (p < 0.001). Scale bar: (in E) B–E, 20 μm.
Given that these studies suggested atrophic change, parallel studies were also conducted to assess the potential for any injury-induced loss of YFP-expressing neurons. These studies revealed no significant reduction in the number of YFP+ neurons in the mediodorsal neocortex (Fig. 8F) following cFPI at any time point post-injury. This finding of a lack of TAI-induced reduction in YFP neuronal number was also validated by the use of TUNEL methodologies to identify nuclear fragmentation within any degenerating cells as a consequence of injury. Positive control brain sections from either P4 mice pups or from DNase-treated YFP+ sham tissue sections demonstrated robust staining of TUNEL+ cells. In sections from sham-injured animals, no TUNEL+ cells were observed. Importantly, no TUNEL+ cells were observed within layer V of the neocortex at any time point assessed post-injury (data not shown).
Qualitative ultrastructural analysis of axotomized, YFP+ and phospho-c-Jun+ neurons
A detailed ultrastructural analysis of YFP+ neurons displaying altered axonal morphology (as depicted in Fig. 2) was undertaken at 3 and 7 d post-injury. Following identification of YFP+ neurons displaying altered axonal morphology at the fluorescent microscopic level, tissue sections were immunostained using an antibody against YFP and processed for EM. Axotomized YFP+ neurons examined at both 3 and 7 d post-injury via electron microscopy showed consistent evidence of reactive change, with degranulation of the rough endoplasmic reticulum (RER) and dispersion of the endoplasmic reticulum and polysomes. Within this population no evidence for mitochondrial damage was found, and the cytoskeleton appeared normal. Importantly, no evidence of apoptosis or necrosis, reflected in a lack of chromatin condensation, apoptotic bodies, or mitochondrial damage and membrane disruption, was observed within axotomized YFP+ neurons (data not shown).
Ultrastructural analysis of phospho-c-Jun+ neurons was undertaken to identify the ultrastructural changes occurring within this population at later time points post-injury (7, 14, and 28 d). Again, throughout this time period phospho-c-Jun+ neurons could easily be identified by punctate immunoreactivity, which was restricted to the nucleus (Fig. 9). Examination of phospho-c-Jun-negative neurons within layer V at all time points revealed neuronal somata with centrally located nuclei, well organized arrays of RER, and compact mitochondria, consistent with findings in the uninjured neocortex described previously (Peters et al., 1991). At 7, 14, and 28 d post-injury, phospho-c-Jun+ neurons did not manifest overt structural change and displayed an intact cytoskeleton and intact mitochondria. However, comparable to those observations made at 3 and 7 d post-injury within axotomized YFP+ neurons, the phospho-c-Jun+ neurons assessed throughout the three chronic time points post-injury consistently displayed alterations in the endoplasmic reticulum and polysomes, with dispersal and degranulation of the RER and disaggregation of polysomes. Additionally, at these later time points many phospho-c-Jun+ neurons post-injury contained accumulated lysosomal debris and lipofuscin content (Fig. 9A,B, white arrows). Furthermore, the nuclei of a subset of phospho-c-Jun+ neurons at 28 d post-injury contained giant fibrillar centers (Fig. 9C, asterisk), a nucleolar morphological alteration associated with increased ribosome biogenesis (Casafont et al., 2007). Comparable to YFP+ axotomized neurons, no phospho-c-Jun+ neurons examined exhibited ultrastructural evidence of apoptosis or necrosis.
Figure 9.

Ultrastructural evidence of persistent reactive change within axotomized neurons. A–D, Representative images from phospho-c-Jun+ neurons at 7 d (A), 14 d (B, D, 2× inset), and 28 d (C) post-injury. In all cells phospho-c-Jun immunoreactivity is restricted to the nuclear compartment. Evidence for enduring chromatolytic change can be found in the lack of substantial RER profiles (A, D, white arrowheads) within phospho-c-Jun+ neurons at all time points examined. A neighboring phospho-c-Jun-negative neuron (B, D, upper cell) can be seen to contain abundant arrays of RER (B, D, black arrowheads delineate plasmalemmal border). Additionally, many neurons contain lysosomal debris and/or lipofuscin content (A, B, white arrows). At 28 d, scattered phospho-c-Jun+ neurons showed evidence for nucleolar reorganization in the form of giant fibrillar centers (C, asterisk), surrounded by the dense fibrillar component (C; f). Scale bars: A–C, 2 μm; D, 4 μm.
Expression of ATF-3 Following cFPI
In concert with the above, the expression of ATF-3, also suggested to play a role in axon regeneration (Campbell et al., 2005; Seijffers et al., 2006, 2007; Reid et al., 2010), was elevated following cFPI. Similar to the time course of c-Jun activation, although slightly delayed, isolated ATF-3-expressing neurons were observed within layer V at 1 d post-injury and this expression was elevated at 3 and 7 d post-injury (Fig. 10). Beyond this time point, expression levels fell to those seen in sham-injured animals. Similar to c-Jun activation, ATF-3 expression colocalized to axotomized YFP+ neurons within layer V at all time points following injury (Fig. 10B).
Figure 10.
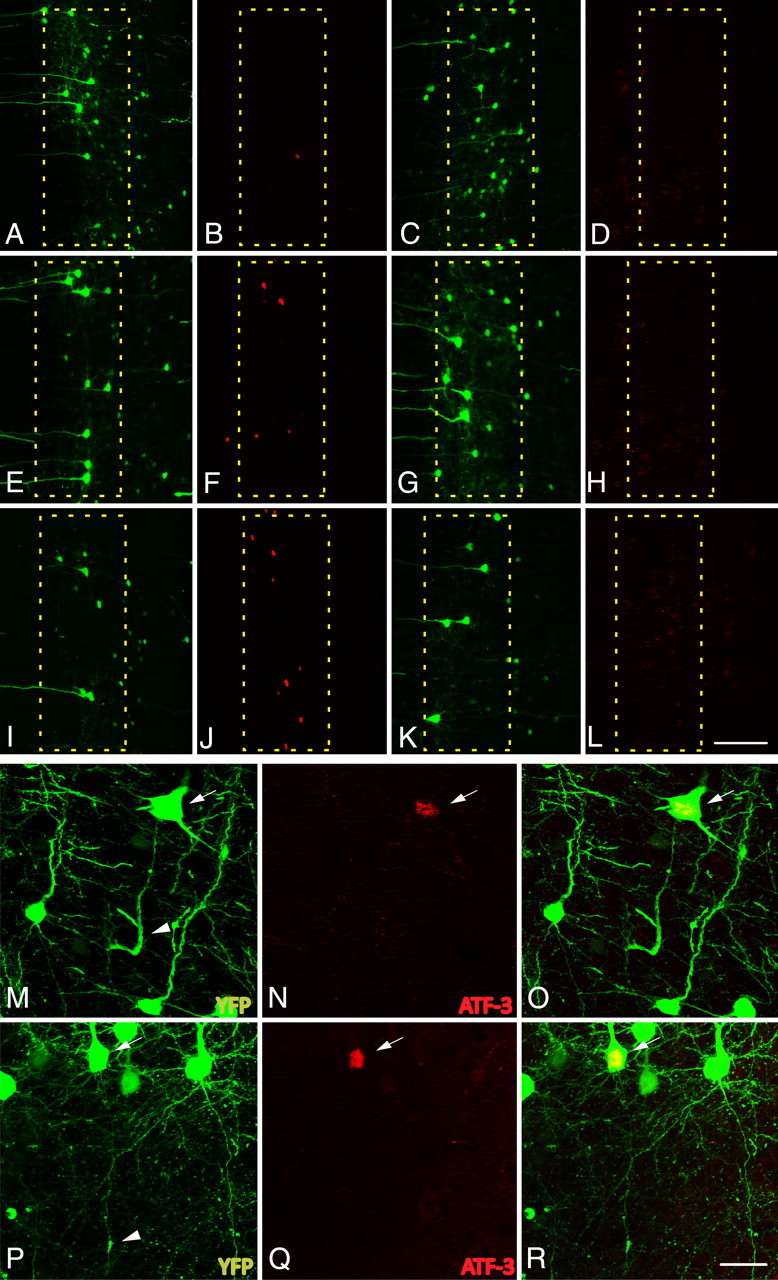
The expression of activating transcription factor 3, ATF-3, is elevated in axotomized neurons following cFPI. A–L, Following cFPI in YFP+ mice (1 d, A; 3 d, E; 7 d, I; 14 d, C; 28, G; 3 d sham, K), ATF-3 expression is elevated as early as 1 d post-injury (B) in a very limited number of neurons. The number of ATF-3-positive neurons increases at both 3 d (F) and 7 d (J) post-injury. By 14 d (D) and 28 d (H) post-injury, expression returns to levels observed within layer V of sham-injured animals (L). M–R, YFP+ neurons at 3 d (M) and 7 d (P) with demonstrable axon pathology (arrowheads) are consistently found to express ATF-3 (arrows: 3 d, N; 7 d, Q; 3 d merged, O; 7 d merged, R). Scale bars: (in L) A–L, 100 μm; (in R) M–R, 25 μm.
Fate of the proximal axonal segment: implications for axonal regeneration
Having demonstrated persistent atrophic changes following TAI without evidence of neuronal death, we next investigated those changes ongoing in the proximal axonal segments linked to these neuronal somata. While many YFP+/phospho-c-Jun+ axons at 1 d following injury formed robust swellings (as described previously, see Fig. 2), a subpopulation of neurons failed to do so. In this population of axotomized neurons, the disconnected proximal axon segments were truncated within 50 μm of the neuronal cell body, with many displaying evidence of post-injury reactive sprouting (Fig. 11C,F, arrowheads). When quantified, both types of axon morphologies, swollen and truncated, constituted roughly the same percentage of YFP+/phospho-c-Jun+ axonal profiles, 39.1 and 42.0%, respectively (Fig. 13A). In addition to these two axon morphologies, the remaining axonal profiles of YFP+/phospho-c-Jun+ neurons (18.8%) were neither swollen nor truncated, and these axons were observed to extend from 50 to 350 μm to terminate within the gray matter underlying layer V. Over the 28 d observation period, the overall percentage of neurons displaying the truncated axonal morphology did not change significantly, still approximating 40% of the axons of the YFP+/phospho-c-Jun+ neuronal population (Fig. 13A). At 1 and 3 d post-injury, 20.8 ± 1.7 and 25.6 ± 6.4%, respectively, of the truncated axons displayed evidence for local sprouting. At later time points the percentage of truncated axons showing evidence of local sprouting was significantly decreased to 5.6 ± 23, 3.7 ± 2.3, and 4.9 ± 2.2% (p < 0.01) at 7, 14, and 28 d, respectively.
Figure 11.

Early reactive sprouting in YFP+/phospho-c-Jun neurons following cFPI. A–F, Representative images show a subpopulation of axotomized neurons at 1 d (A–C) and 3 d (D–F) post-injury detailing the morphology of their proximal axonal processes. This population of YFP+ (A, D, arrowheads), phospho-c-Jun (p-c-Jun)-expressing (B, E, arrowheads) neurons revealed evidence for sprouting following injury. Small axon sprouts (C, F, arrowheads) arise from what remained of the proximal axonal segment. Note the remaining disconnected distal YFP+ swellings (A, D, arrows). Scale bars: A, B, D, E, 20 μm; C, F, 10 μm.
Figure 13.

YFP+/phospho-c-Jun+ axonal morphological change with time post-injury. A, In this bar graph the percentage of axons with prominent swellings within the YFP+/phospho-c-Jun+ population is seen to decrease significantly at 3 d post-injury. Note that this trend continues with a further significant decrease at 7, 14, and 28 d post-injury. Concurrently, the percentage of nonswollen, elongated axons increases as early as 3 d post-injury and continued to increase significantly at 7, 14, and 28 d post-injury. In contrast, also note that the percentage of truncated YFP+/phospho-c-Jun+ axons does not change significantly over the same time course, although the percentage of this population showing evidence for reactive sprouting (values in brackets) diminishes over time post-injury. B, The average proximal axon length was significantly increased at 3, 7, 14, and 28 d post-injury relative to 1 d post-injury. *p < 0.05, significantly different from 1 d; +p < 0.001, significantly different from 3 d; Δp < 0.001, significantly different from 7 d.
While, as noted above, there was no change in the percentage of truncated axons with respect to time post-injury, the percentage of swollen axons and those displaying nonswollen, extended axonal profiles changed significantly with respect to time post-injury (Fig. 13A). Specifically, the percentage of swollen axons was significantly reduced to 31.0% (p < 0.05) by 3 d post-injury with a further significant reduction to 9.1, 3.9, and 2.6% (p < 0.001) at 7, 14, and 28 d post-injury, respectively. Accompanying this decrease in swollen axons, the percentage of nonswollen axons extending into the gray matter was significantly increased with time following injury. Beginning at 3 d post-injury, the percentage of axons with this morphology was significantly increased to 33.5% (p < 0.05, relative to 1 d post-injury). This trend continued with a further significant increase relative to both 1 and 3 d post-injury to 50.4% at 7 d (p < 0.01). At 14 and 28 d the population with this extended axonal morphology increased even further to 64.6 and 59.7%, respectively (p < 0.01).
Following confocal image analysis with image deconvolution, we observed that many of the axons demonstrating this third axon morphology consisted of long, thin axonal profiles, often with several small dilations along their length (Fig. 12B,F,J, arrowheads) capped by small, torpedo-shaped endings (∼10 μm in length) (Fig. 12B,F,J, arrows). Several of the longest proximal axonal processes of YFP+/phospho-c-Jun+ neurons were observed to traverse the gray matter and terminate in small club-like appendages in the vicinity of the SCWM (Fig. 12J), yet never enter the SCWM. Quantitatively, no YFP+/phospho-c-Jun+ neurons (of 1230 analyzed at 7, 14, and 28 d post-injury) revealed proximal axonal projections that traversed the gray matter and continued into the SCWM. Importantly, the axons of YFP+/phospho-c-Jun-negative neurons within both injured and sham-injured animals demonstrated no evidence of this axonal morphology, and in the majority of cases their axonal projections were observed to traverse the gray matter to enter the SCWM (Fig. 12A).
Figure 12.

YFP+ neurons expressing phospho-c-Jun at later time points post-injury exhibit morphological evidence of continued axon regeneration and/or plasticity. A, Representative image of normal YFP+ axonal morphology (arrowheads) present in 28 d sham-injured animals. B–M, Representative images of YFP+/phospho-c-Jun+ neurons at 14 d (B–I) and 28 d (J–M) post-injury. Detailed axonal morphology of YFP+ neurons is shown in B, F, and J. The same YFP+ neurons (C, G, K) all expressed phospho-c-Jun (p-c-Jun) (D, H, L, arrowheads). These YFP+/phospho-c-Jun+ neurons at 14 and 28 d consistently maintained axons that were no longer swollen nor displayed overt pathological alteration. Rather, they now displayed long, thin axonal profiles decorated by several small dilations along their length (B, F, J, arrowheads). These were capped by torpedo-shaped swellings (B, F, J, arrows). Reconstructed three-dimensional images depicting the terminal swellings for each neuron are shown in E, I, M. Scale bars: A, B, J, 50 μm; F, 25 μm.
Proximal axonal segments significantly lengthen over time post-injury
Concurrent with the shift in axon morphology beginning at 3 d post-injury, a significant increase in the length of the proximal process, regardless of morphology, was observed (Fig. 13B). The average proximal axon length at 1 d post-injury was 45.8 ± 9.6 μm in length. As early as 3 d post-injury the average length of the proximal axon was significantly greater than that observed at 1 d, having an average length of 88.0 ± 11.1 μm (p < 0.05). At 7, 14, and 28 d, proximal axon segments remained longer, with average lengths of 86.2 ± 9.6, 92.2 ± 10.5, and 78.4 ± 7.2 μm, respectively, all representing a significantly increased proximal axon length when compared to 1 d post-injury (p < 0.05). No significant difference was found between proximal axon lengths at 7, 14, or 28 d post-injury.
Discussion
The results of this communication demonstrate the utility of a YFP-expressing transgenic mouse model of TBI in providing exquisite insight into the pathogenesis of TAI and its implications for the related neuronal cell body of origin and the axotomized axonal process. The demonstration of axonal swelling and disconnection occurring adjacent to intact, unaltered axons is consistent with the phenomenon of diffuse axonal injury described previously in both animals and humans (Povlishock et al., 1983; Adams et al., 1989; Smith et al., 2003). Of note in the current communication was the use of YFP-expressing mice interfaced with other approaches to follow this neuronal population over a prolonged posttraumatic course, therein demonstrating that axotomized neurons consistently undergo atrophy without evidence of cell death. Equally important is the fact that these same atrophic neurons demonstrate elongation of their disconnected, proximal axonal segments over time (1–28 d), manifesting features consistent with regeneration and reorganization. Together, these studies provide unprecedented insight into the neuronal response most likely occurring with diffuse TBI in both animals and humans. Via these approaches, we dismiss the potential for traumatic neuronal cell death while also emphasizing the potential for dynamic posttraumatic reorganization and repair.
While the novel animal model system introduced in the current study allows for the critical evaluation of traumatic axonal injury, it more importantly permits the assessment of the fate of the neuronal cell body related to the axotomized process as well as the long-term outcome for the axotomized appendage itself in terms of any potential regeneration and repair. Most striking was our consistent finding that the generation of diffuse axotomy, even in close proximity to the cell body of origin, never resulted in neuronal cell death. Rather, it resulted in long-term neuronal atrophy that persisted over a 28 d period. The evidence supporting atrophy versus neuronal cell death is compelling and derives from multiple endpoints. The routine quantification of the YFP+ neurons failed to demonstrate reduced neuronal number over time. Similarly, the use of TUNEL approaches did not reveal any immunoreactive change associated with neuronal death. Furthermore, parallel ultrastructural analyses (discussed below), did not reveal any morphological evidence of necrosis or apoptosis. Rather, atrophic change was consistently identified and was again confirmed by multiple tools. Measurements of YFP+/phospho-c-Jun+ neuronal size revealed a reduction in cellular area over time. In addition, parallel ultrastructural analyses of axotomized YFP+ neurons confirmed that this cell shrinkage was associated with the loss of RER, consistent with ongoing chromatolytic/atrophic alteration (Barron et al., 1975; Barron and Dentinger, 1979; Kreutzberg, 1995). Whereas our previous studies suggested axotomy-mediated atrophic change, their linkage to the actual process of axotomy was indirect (Lifshitz et al., 2007). The current communication clearly confirms and extends these findings.
Although all approaches used in the study were complementary, perhaps one of the most useful approaches was linked to the finding that axotomized YFP+ neurons concomitantly exhibited phosphorylation of c-Jun. Importantly, these phospho-c-Jun+ neurons could also be easily followed over time, providing confirmation that the YFP+/phospho-c-Jun+ neurons consistently revealed atrophic change. Specifically, the ultrastructural analysis of phospho-c-Jun-labeled neurons always revealed evidence of persistent atrophy reflected in decreased cell body size and the dispersion of the RER, together with the accumulation of lysosomal debris and lipofuscin content. Furthermore, the consistent finding of these atrophic phospho-c-Jun+ neurons adjacent to nonimmunoreactive neurons displaying normal ultrastructural detail provided further support for the premise that phosphorylated c-Jun immunohistochemistry mapped exclusively to axotomized neurons.
In contrast to our finding of TAI-mediated neuronal atrophy, primary axonal transection in the CNS in close proximity to the cell body has been traditionally associated with neuronal death (Giehl and Tetzlaff, 1996; Giehl et al., 1997; Bonatz et al., 2000), while atrophy has been associated with more distal lesions (Barron and Dentinger, 1979; Barron et al., 1988; McBride et al., 1989; Merline and Kalil, 1990; Tang et al., 2004; Carter et al., 2008). This unique atrophic response to nearby axotomy underscores a key distinction between direct mechanical transection, used in most experimental paradigms of injury, and the secondary axotomy of TAI (Povlishock and Christman, 1995; Büki and Povlishock, 2006) wherein injured axons reveal focal changes in axolemmal permeability that lead to progressive axonal swelling and disconnection (Povlishock, 1992; Maxwell et al., 1997). This differs from mechanical transection, which causes massive focal disruption of ionic homeostasis (Mandolesi et al., 2004) that then initiates neuronal death (Weber, 2004). It is likely that the slow, progressive pathological changes associated with TAI reduce the degree of ionic disruption, allowing for neuronal survival, although it does entail atrophic change.
Not only does our investigation support the premise of persistent neuronal atrophy following TAI, but it also demonstrates that these same neurons can mount a regenerative attempt. Noteworthy is the fact that these same atrophic neurons revealed the activation of the c-Jun pathway, which has been suggested to promote axonal regeneration in neurons surviving axotomy (Broude et al., 1997; Raivich et al., 2004, Raivich, 2008). Following cFPI, a significant association between TAI and the phosphorylation of c-Jun was observed with phospho-c-Jun immunoreactivity localized to neurons within anatomical regions that also demonstrated axonal injury following cFPI. At 1 and 3 d post-injury the overwhelming majority of axotomized YFP+ neurons were also phospho-c-Jun+, and this expression was maintained through 28 d following injury, consistent with other reports of persistent, axotomy-induced c-Jun activation in the CNS (Brecht et al., 1995; Herdegen et al., 1998; Kenney and Kocsis, 1998). Paradoxically, activation of c-Jun has also been associated with both axon regeneration as well as neuronal death (Herdegen et al., 1997; Ham et al., 2000; Raivich and Makwana, 2007; Raivich, 2008). Genetic deletion of c-Jun is neuroprotective but diminishes the axon regenerative potential for surviving neurons (Raivich et al., 2004). Importantly, in the current study ATF-3, another transcription factor linked to axon regeneration, was elevated within axotomized neurons following injury, consistent with its potential role in determining neuronal fate following c-Jun activation (Nakagomi et al., 2003). In our study, c-Jun and ATF-3 activation occurred in the absence of neuronal death, suggesting the activation of a somatic program targeting neuronal recovery and/or axon regeneration.
Perhaps the most intriguing and unique finding of the current communication resides in the fact that these atrophic neurons could mount a complex and enduring regenerative response. Evidence for reactive sprouting was seen as early as 1 d following cFPI and is in line with previous reports of axonal regeneration/sprouting in other experimental models of TBI (Emery et al., 2000; Harris et al., 2010). However, these models generate cortical contusions, with neuronal loss and reactive astrogliosis (Lighthall, 1988; McIntosh et al., 1989). As these phenomena are absent following mild to moderate cFPI (Dixon et al., 1987, 1988; Kelley et al., 2007), this may result in a more permissive microenvironment for axon growth (Gervasi et al., 2008). While inhibitory proteoglycans can inhibit axonal plasticity beyond 2 weeks post-injury following contusional brain injury (Harris et al., 2009, 2010), the current study presents morphological evidence for early and sustained axonal plasticity following diffuse TBI. Sprouting from truncated axons decreased beyond 3 d post-injury, and concurrent with this decline in sprouting the average length of all YFP+/phospho-c-Jun+ axons increased significantly. Furthermore, in relation to this issue a significant shift in the axon morphology occurred between 3 and 7 d post-injury, when axons with swellings decreased significantly while nonswollen, extended axons increased significantly. This population, largely present at later survival times, was often found to terminate in small torpedo-shaped endings reminiscent of in vivo growth cones (Li et al., 1998; Iseda et al., 2003; Pan et al., 2003; Dray et al., 2009), suggesting a transition within axotomized neurons from early sprouting to later axonal elongation. Of note was the parallel observation that in contrast to those fibers originating from neighboring phospho-c-Jun-negative neurons, no YFP+/phospho-c-Jun+ axons, even those with the most elongated processes, penetrated the SCWM, suggesting that although these neurons mounted a regenerative attempt this anatomical boundary impeded further growth. Inhibitory proteins present in intact fibers (Huber et al., 2002) have been suggested to inhibit branching and maintain proper fiber orientation within uninjured white matter tracts (Raisman, 2004; Pettigrew and Crutcher, 1999, 2001) and may function following diffuse TBI to limit further axon growth from these axotomized neurons.
In summary, the current communication reports a novel mouse model of diffuse TAI that will enable future therapeutic and genetically based studies to further probe the mechanisms underlying TAI and any associated regenerative response. Additionally, the current observation that proximal axotomy, in the context of TAI, results in persistent neuronal atrophy with a regenerative response provides, in our estimation, a unique model system that can be exploited in future studies to better understand the brain's ability to undergo repair following TBI. Such future studies may allow us to test whether this regenerative response is adaptive or maladaptive in nature.
Footnotes
This research was supported by National Institutes of Health (NIH) Grants HD055813, NS047463, and NS007288. Microscopy was performed at the VCU Department of Anatomy and Neurobiology Microscopy Facility, supported, in part, with funding from NIH-NINDS Center core grant (5P30NS047463-02). We thank Scott Henderson, PhD, Robert J Hamm, PhD, Thomas Reeves, PhD, Susan A Walker, Carol Lynn Davis, and Audrey Lafrenaye, PhD, for their technical assistance and guidance in various aspects of this study.
References
- Adams JH, Doyle D, Ford I, Gennarelli TA, Graham DI, McLellan DR. Diffuse axonal injury in head injury: definition, diagnosis and grading. Histopathology. 1989;15:49–59. doi: 10.1111/j.1365-2559.1989.tb03040.x. [DOI] [PubMed] [Google Scholar]
- Barron KD. The axotomy response. J Neurol Sci. 2004;220:119–121. doi: 10.1016/j.jns.2004.03.009. [DOI] [PubMed] [Google Scholar]
- Barron KD, Dentinger MP. Cytologic observations on axotomized feline Betz cells. 1. Qualitative electron microscopic findings. J Neuropathol Exp Neurol. 1979;38:128–151. doi: 10.1097/00005072-197903000-00005. [DOI] [PubMed] [Google Scholar]
- Barron KD, Dentinger MP, Nelson LR, Mincy JE. Ultrastructure of axonal reaction in red nucleus of cat. J Neuropathol Exp Neurol. 1975;34:222–248. doi: 10.1097/00005072-197505000-00002. [DOI] [PubMed] [Google Scholar]
- Barron KD, Dentinger MP, Popp AJ, Mankes R. Neurons of layer Vb of rat sensorimotor cortex atrophy but do not die after thoracic cord transection. J Neuropathol Exp Neurol. 1988;47:62–74. doi: 10.1097/00005072-198801000-00008. [DOI] [PubMed] [Google Scholar]
- Bonatz H, Röhrig S, Mestres P, Meyer M, Giehl KM. An axotomy model for the induction of death of rat and mouse corticospinal neurons in vivo. J Neurosci Methods. 2000;100:105–115. doi: 10.1016/s0165-0270(00)00238-7. [DOI] [PubMed] [Google Scholar]
- Brecht S, Martin-Villalba A, Zuschratter W, Bravo R, Herdegen T. Transection of rat fimbria-fornix induces lasting expression of c-Jun protein in axotomized septal neurons immunonegative for choline acetyltransferase and nitric oxide synthase. Exp Neurol. 1995;134:112–125. doi: 10.1006/exnr.1995.1042. [DOI] [PubMed] [Google Scholar]
- Broude E, McAtee M, Kelley MS, Bregman BS. c-Jun expression in adult rat dorsal root ganglion neurons: differential response after central or peripheral axotomy. Exp Neurol. 1997;148:367–377. doi: 10.1006/exnr.1997.6665. [DOI] [PubMed] [Google Scholar]
- Büki A, Povlishock JT. All roads lead to disconnection?–Traumatic axonal injury revisited. Acta Neurochir (Wien) 2006;148:181–193. doi: 10.1007/s00701-005-0674-4. [DOI] [PubMed] [Google Scholar]
- Campbell G, Hutchins K, Winterbottom J, Grenningloh G, Lieberman AR, Anderson PN. Upregulation of activating transcription factor 3 (ATF3) by intrinsic CNS neurons regenerating axons into peripheral nerve grafts. Exp Neurol. 2005;192:340–347. doi: 10.1016/j.expneurol.2004.11.026. [DOI] [PubMed] [Google Scholar]
- Carter LM, Starkey ML, Akrimi SF, Davies M, McMahon SB, Bradbury EJ. The yellow fluorescent protein (YFP-H) mouse reveals neuroprotection as a novel mechanism underlying chondroitinase ABC-mediated repair after spinal cord injury. J Neurosci. 2008;28:14107–14120. doi: 10.1523/JNEUROSCI.2217-08.2008. [DOI] [PMC free article] [PubMed] [Google Scholar]
- Casafont I, Bengoechea R, Navascués J, Pena E, Berciano MT, Lafarga M. The giant fibrillar center: a nucleolar structure enriched in upstream binding factor (UBF) that appears in transcriptionally more active sensory ganglia neurons. J Struct Biol. 2007;159:451–461. doi: 10.1016/j.jsb.2007.05.004. [DOI] [PubMed] [Google Scholar]
- Cordobés F, Lobato RD, Rivas JJ, Cabrera A, Sarabia M, Castro S, Cisneros C, Torres ID, Lamas E. Post-traumatic diffuse axonal brain injury. Analysis of 78 patients studied with computed tomography. Acta Neurochir (Wien) 1986;81:27–35. doi: 10.1007/BF01456261. [DOI] [PubMed] [Google Scholar]
- Csuka E, Hans VH, Ammann E, Trentz O, Kossmann T, Morganti-Kossmann MC. Cell activation and inflammatory response following traumatic axonal injury in the rat. Neuroreport. 2000;11:2587–2590. doi: 10.1097/00001756-200008030-00047. [DOI] [PubMed] [Google Scholar]
- Dixon CE, Lyeth BG, Povlishock JT, Findling RL, Hamm RJ, Marmarou A, Young HF, Hayes RL. A fluid percussion model of experimental brain injury in the rat. J Neurosurg. 1987;67:110–119. doi: 10.3171/jns.1987.67.1.0110. [DOI] [PubMed] [Google Scholar]
- Dixon CE, Lighthall JW, Anderson TE. Physiologic, histopathologic, and cineradiographic characterization of a new fluid-percussion model of experimental brain injury in the rat. J Neurotrauma. 1988;5:91–104. doi: 10.1089/neu.1988.5.91. [DOI] [PubMed] [Google Scholar]
- Dray C, Rougon G, Debarbieux F. Quantitative analysis by in vivo imaging of the dynamics of vascular and axonal networks in injured mouse spinal cord. Proc Natl Acad Sci U S A. 2009;106:9459–9464. doi: 10.1073/pnas.0900222106. [DOI] [PMC free article] [PubMed] [Google Scholar]
- Emery DL, Raghupathi R, Saatman KE, Fischer I, Grady MS, McIntosh TK. Bilateral growth-related protein expression suggests a transient increase in regenerative potential following brain trauma. J Comp Neurol. 2000;424:521–531. [PubMed] [Google Scholar]
- Erb DE, Povlishock JT. Neuroplasticity following traumatic brain injury: a study of GABAergic terminal loss and recovery in the cat dorsal lateral vestibular nucleus. Exp Brain Res. 1991;83:253–267. doi: 10.1007/BF00231151. [DOI] [PubMed] [Google Scholar]
- Feng G, Mellor RH, Bernstein M, Keller-Peck C, Nguyen QT, Wallace M, Nerbonne JM, Lichtman JW, Sanes JR. Imaging neuronal subsets in transgenic mice expressing multiple spectral variants of GFP. Neuron. 2000;28:41–51. doi: 10.1016/s0896-6273(00)00084-2. [DOI] [PubMed] [Google Scholar]
- Gervasi NM, Kwok JC, Fawcett JW. Role of extracellular factors in axon regeneration in the CNS: implications for therapy. Regen Med. 2008;3:907–923. doi: 10.2217/17460751.3.6.907. [DOI] [PubMed] [Google Scholar]
- Giehl KM, Tetzlaff W. BDNF and NT-3, but not NGF, prevent axotomy-induced death of rat corticospinal neurons in vivo. Eur J Neurosci. 1996;8:1167–1175. doi: 10.1111/j.1460-9568.1996.tb01284.x. [DOI] [PubMed] [Google Scholar]
- Giehl KM, Schacht CM, Yan Q, Mestres P. GDNF is a trophic factor for adult rat corticospinal neurons and promotes their long-term survival after axotomy in vivo. Eur J Neurosci. 1997;9:2479–2488. doi: 10.1111/j.1460-9568.1997.tb01665.x. [DOI] [PubMed] [Google Scholar]
- Ham J, Eilers A, Whitfield J, Neame SJ, Shah B. c-Jun and the transcriptional control of neuronal apoptosis. Biochem Pharmacol. 2000;60:1015–1021. doi: 10.1016/s0006-2952(00)00372-5. [DOI] [PubMed] [Google Scholar]
- Harris NG, Carmichael ST, Hovda DA, Sutton RL. Traumatic brain injury results in disparate regions of chondroitin sulfate proteoglycan expression that are temporally limited. J Neurosci Res. 2009;87:2937–2950. doi: 10.1002/jnr.22115. [DOI] [PMC free article] [PubMed] [Google Scholar]
- Harris NG, Mironova YA, Hovda DA, Sutton RL. Pericontusion axon sprouting is spatially and temporally consistent with a growth-permissive environment after traumatic brain injury. J Neuropathol Exp Neurol. 2010;69:139–154. doi: 10.1097/NEN.0b013e3181cb5bee. [DOI] [PMC free article] [PubMed] [Google Scholar]
- Herdegen T, Skene P, Bähr M. The c-Jun transcription factor–bipotential mediator of neuronal death, survival and regeneration. Trends Neurosci. 1997;20:227–231. doi: 10.1016/s0166-2236(96)01000-4. [DOI] [PubMed] [Google Scholar]
- Herdegen T, Claret FX, Kallunki T, Martin-Villalba A, Winter C, Hunter T, Karin M. Lasting N-terminal phosphorylation of c-Jun and activation of c-Jun N-terminal kinases after neuronal injury. J Neurosci. 1998;18:5124–5135. doi: 10.1523/JNEUROSCI.18-14-05124.1998. [DOI] [PMC free article] [PubMed] [Google Scholar]
- Huber AB, Weinmann O, Brösamle C, Oertle T, Schwab ME. Patterns of Nogo mRNA and protein expression in the developing and adult rat and after CNS lesions. J Neurosci. 2002;22:3553–3567. doi: 10.1523/JNEUROSCI.22-09-03553.2002. [DOI] [PMC free article] [PubMed] [Google Scholar]
- Hughes PE, Alexi T, Walton M, Williams CE, Dragunow M, Clark RG, Gluckman PD. Activity and injury-dependent expression of inducible transcription factors, growth factors and apoptosis-related genes within the central nervous system. Prog Neurobiol. 1999;57:421–450. doi: 10.1016/s0301-0082(98)00057-4. [DOI] [PubMed] [Google Scholar]
- Inglese M, Makani S, Johnson G, Cohen BA, Silver JA, Gonen O, Grossman RI. Diffuse axonal injury in mild traumatic brain injury: a diffusion tensor imaging study. J Neurosurg. 2005;103:298–303. doi: 10.3171/jns.2005.103.2.0298. [DOI] [PubMed] [Google Scholar]
- Iseda T, Nishio T, Kawaguchi S, Kawasaki T, Wakisaka S. Spontaneous regeneration of the corticospinal tract after transection in young rats: collagen type IV deposition and astrocytic scar in the lesion site are not the cause but the effect of failure of regeneration. J Comp Neurol. 2003;464:343–355. doi: 10.1002/cne.10786. [DOI] [PubMed] [Google Scholar]
- Kelley BJ, Farkas O, Lifshitz J, Povlishock JT. Traumatic axonal injury in the perisomatic domain triggers ultrarapid secondary axotomy and Wallerian degeneration. Exp Neurol. 2006;198:350–360. doi: 10.1016/j.expneurol.2005.12.017. [DOI] [PubMed] [Google Scholar]
- Kelley BJ, Lifshitz J, Povlishock JT. Neuroinflammatory responses after experimental diffuse traumatic brain injury. J Neuropathol Exp Neurol. 2007;66:989–1001. doi: 10.1097/NEN.0b013e3181588245. [DOI] [PubMed] [Google Scholar]
- Kenney AM, Kocsis JD. Peripheral axotomy induces long-term c-Jun amino-terminal kinase-1 activation and activator protein-1 binding activity by c-Jun and junD in adult rat dorsal root ganglia In vivo. J Neurosci. 1998;18:1318–1328. doi: 10.1523/JNEUROSCI.18-04-01318.1998. [DOI] [PMC free article] [PubMed] [Google Scholar]
- Kreutzberg G. Reaction of the neuronal cell body to axonal damage. In: Waxman SG, Kocsis JD, Stys PK, editors. The axon. New York: Oxford UP; 1995. pp. 355–374. [Google Scholar]
- Li P, Murphy TH. Two-photon imaging during prolonged middle cerebral Artery occlusion in mice reveals recovery of dendritic structure after reperfusion. J Neurosci. 2008;28:11970–11979. doi: 10.1523/JNEUROSCI.3724-08.2008. [DOI] [PMC free article] [PubMed] [Google Scholar]
- Li Y, Field PM, Raisman G. Regeneration of adult rat corticospinal axons induced by transplanted olfactory ensheathing cells. J Neurosci. 1998;18:10514–10524. doi: 10.1523/JNEUROSCI.18-24-10514.1998. [DOI] [PMC free article] [PubMed] [Google Scholar]
- Lifshitz J, Kelley BJ, Povlishock JT. Perisomatic thalamic axotomy after diffuse traumatic brain injury is associated with atrophy rather than cell death. J Neuropathol Exp Neurol. 2007;66:218–229. doi: 10.1097/01.jnen.0000248558.75950.4d. [DOI] [PubMed] [Google Scholar]
- Lighthall JW. Controlled cortical impact: a new experimental brain injury model. J Neurotrauma. 1988;5:1–15. doi: 10.1089/neu.1988.5.1. [DOI] [PubMed] [Google Scholar]
- Lipton ML, Gellella E, Lo C, Gold T, Ardekani BA, Shifteh K, Bello JA, Branch CA. Multifocal white matter ultrastructural abnormalities in mild traumatic brain injury with cognitive disability: a voxel-wise analysis of diffusion tensor imaging. J Neurotrauma. 2008;25:1335–1342. doi: 10.1089/neu.2008.0547. [DOI] [PubMed] [Google Scholar]
- Lipton ML, Gulko E, Zimmerman ME, Friedman BW, Kim M, Gellella E, Gold T, Shifteh K, Ardekani BA, Branch CA. Diffusion-tensor imaging implicates prefrontal axonal injury in executive function impairment following very mild traumatic brain injury. Radiology. 2009;252:816–824. doi: 10.1148/radiol.2523081584. [DOI] [PubMed] [Google Scholar]
- Mandolesi G, Madeddu F, Bozzi Y, Maffei L, Ratto GM. Acute physiological response of mammalian central neurons to axotomy: ionic regulation and electrical activity. FASEB J. 2004;18:1934–1936. doi: 10.1096/fj.04-1805fje. [DOI] [PubMed] [Google Scholar]
- Maxwell WL, Povlishock JT, Graham DL. A mechanistic analysis of nondisruptive axonal injury: a review. J Neurotrauma. 1997;14:419–440. doi: 10.1089/neu.1997.14.419. [DOI] [PubMed] [Google Scholar]
- McBride RL, Feringa ER, Garver MK, Williams JK., Jr Prelabeled red nucleus and sensorimotor cortex neurons of the rat survive 10 and 20 weeks after spinal cord transection. J Neuropathol Exp Neurol. 1989;48:568–576. doi: 10.1097/00005072-198909000-00007. [DOI] [PubMed] [Google Scholar]
- McIntosh TK, Vink R, Noble L, Yamakami I, Fernyak S, Soares H, Faden AL. Traumatic brain injury in the rat: characterization of a lateral fluid-percussion model. Neuroscience. 1989;28:233–244. doi: 10.1016/0306-4522(89)90247-9. [DOI] [PubMed] [Google Scholar]
- Merline M, Kalil K. Cell death of corticospinal neurons is induced by axotomy before but not after innervation of spinal targets. J Comp Neurol. 1990;296:506–516. doi: 10.1002/cne.902960313. [DOI] [PubMed] [Google Scholar]
- Nakagomi S, Suzuki Y, Namikawa K, Kiryu-Seo S, Kiyama H. Expression of the activating transcription factor 3 prevents c-Jun N-terminal kinase-induced neuronal death by promoting heat shock protein 27 and Akt activation. J Neurosci. 2003;23:5187–5196. doi: 10.1523/JNEUROSCI.23-12-05187.2003. [DOI] [PMC free article] [PubMed] [Google Scholar]
- Pan YA, Misgeld T, Lichtman JW, Sanes JR. Effects of neurotoxic and neuroprotective agents on peripheral nerve regeneration assayed by time-lapse imaging in vivo. J Neurosci. 2003;23:11479–11488. doi: 10.1523/JNEUROSCI.23-36-11479.2003. [DOI] [PMC free article] [PubMed] [Google Scholar]
- Paxinos G, Franklin K. The mouse brain in stereotaxic coordinates. New York: Academic; 2003. [Google Scholar]
- Peters A, Palay S, Webster H. The fine structure of the nervous system. New York: Oxford UP; 1991. [Google Scholar]
- Pettigrew DB, Crutcher KA. White matter of the CNS supports or inhibits neurite outgrowth in vitro depending on geometry. J Neurosci. 1999;19:8358–8366. doi: 10.1523/JNEUROSCI.19-19-08358.1999. [DOI] [PMC free article] [PubMed] [Google Scholar]
- Pettigrew DB, Crutcher KA. Myelin contributes to the parallel orientation of axonal growth on white matter in vitro. BMC Neurosci. 2001;2:9. doi: 10.1186/1471-2202-2-9. [DOI] [PMC free article] [PubMed] [Google Scholar]
- Phillips LL, Reeves TM. Interactive pathology following traumatic brain injury modifies hippocampal plasticity. Restor Neurol Neurosci. 2001;19:213–235. [PubMed] [Google Scholar]
- Povlishock JT. Traumatically induced axonal injury: pathogenesis and pathobiological implications. Brain Pathol. 1992;2:1–12. [PubMed] [Google Scholar]
- Povlishock JT, Christman CW. The pathobiology of traumatically induced axonal injury in animals and humans: a review of current thoughts. J Neurotrauma. 1995;12:555–564. doi: 10.1089/neu.1995.12.555. [DOI] [PubMed] [Google Scholar]
- Povlishock JT, Katz DI. Update of neuropathology and neurological recovery after traumatic brain injury. J Head Trauma Rehabil. 2005;20:76–94. doi: 10.1097/00001199-200501000-00008. [DOI] [PubMed] [Google Scholar]
- Povlishock JT, Becker DP, Cheng CL, Vaughan GW. Axonal change in minor head injury. J Neuropathol Exp Neurol. 1983;42:225–242. doi: 10.1097/00005072-198305000-00002. [DOI] [PubMed] [Google Scholar]
- Raisman G. Myelin inhibitors: does NO mean GO? Nat Rev Neurosci. 2004;5:157–161. doi: 10.1038/nrn1328. [DOI] [PubMed] [Google Scholar]
- Raivich G. c-Jun expression, activation and function in neural cell death, inflammation and repair. J Neurochem. 2008;107:898–906. doi: 10.1111/j.1471-4159.2008.05684.x. [DOI] [PubMed] [Google Scholar]
- Raivich G, Behrens A. Role of the AP-1 transcription factor c-Jun in developing, adult and injured brain. Prog Neurobiol. 2006;78:347–363. doi: 10.1016/j.pneurobio.2006.03.006. [DOI] [PubMed] [Google Scholar]
- Raivich G, Makwana M. The making of successful axonal regeneration: genes, molecules and signal transduction pathways. Brain Res Rev. 2007;53:287–311. doi: 10.1016/j.brainresrev.2006.09.005. [DOI] [PubMed] [Google Scholar]
- Raivich G, Bohatschek M, Da Costa C, Iwata O, Galiano M, Hristova M, Nateri AS, Makwana M, Riera-Sans L, Wolfer DP, Lipp HP, Aguzzi A, Wagner EF, Behrens A. The AP-1 transcription factor c-Jun is required for efficient axonal regeneration. Neuron. 2004;43:57–67. doi: 10.1016/j.neuron.2004.06.005. [DOI] [PubMed] [Google Scholar]
- Reid A, Welin D, Wiberg M, Terenghi G, Novikov LN. Peripherin and ATF3 genes are differentially regulated in regenerating and non-regenerating primary sensory neurons. Brain Res. 2010;1310:1–7. doi: 10.1016/j.brainres.2009.11.011. [DOI] [PubMed] [Google Scholar]
- Richardson PM, Miao T, Wu D, Zhang Y, Yeh J, Bo X. Responses of the nerve cell body to axotomy. Neurosurgery. 2009;65:A74–A79. doi: 10.1227/01.NEU.0000352378.26755.C3. [DOI] [PubMed] [Google Scholar]
- Seijffers R, Allchorne AJ, Woolf CJ. The transcription factor ATF-3 promotes neurite outgrowth. Mol Cell Neurosci. 2006;32:143–154. doi: 10.1016/j.mcn.2006.03.005. [DOI] [PubMed] [Google Scholar]
- Seijffers R, Mills CD, Woolf CJ. ATF3 increases the intrinsic growth state of DRG neurons to enhance peripheral nerve regeneration. J Neurosci. 2007;27:7911–7920. doi: 10.1523/JNEUROSCI.5313-06.2007. [DOI] [PMC free article] [PubMed] [Google Scholar]
- Singleton RH, Zhu J, Stone JR, Povlishock JT. Traumatically induced axotomy adjacent to the soma does not result in acute neuronal death. J Neurosci. 2002;22:791–802. doi: 10.1523/JNEUROSCI.22-03-00791.2002. [DOI] [PMC free article] [PubMed] [Google Scholar]
- Smith DH, Meaney DF, Shull WH. Diffuse axonal injury in head trauma. J Head Trauma Rehabil. 2003;18:307–316. doi: 10.1097/00001199-200307000-00003. [DOI] [PubMed] [Google Scholar]
- Stone JR, Walker SA, Povlishock JT. The visualization of a new class of traumatically injured axons through the use of a modified method of microwave antigen retrieval. Acta Neuropathol. 1999;97:335–345. doi: 10.1007/s004010050996. [DOI] [PubMed] [Google Scholar]
- Sugino K, Hempel CM, Miller MN, Hattox AM, Shapiro P, Wu C, Huang ZJ, Nelson SB. Molecular taxonomy of major neuronal classes in the adult mouse forebrain. Nat Neurosci. 2006;9:99–107. doi: 10.1038/nn1618. [DOI] [PubMed] [Google Scholar]
- Tang XQ, Wang Y, Huang ZH, Han JS, Wan Y. Adenovirus-mediated delivery of GDNF ameliorates corticospinal neuronal atrophy and motor function deficits in rats with spinal cord injury. Neuroreport. 2004;15:425–429. doi: 10.1097/00001756-200403010-00009. [DOI] [PubMed] [Google Scholar]
- Weber JT. Calcium homeostasis following traumatic neuronal injury. Curr Neurovasc Res. 2004;1:151–171. doi: 10.2174/1567202043480134. [DOI] [PubMed] [Google Scholar]