Abstract
We developed second-generation (G2) optical-resolution photoacoustic microscopy (OR-PAM). Incorporation of a novel acoustic detection scheme improved upon the sensitivity of our first-generation (G1) system by 18.4 dB, deepening the in vivo tissue penetration to 1.2 mm at 570 nm. Moreover, translating the imaging head instead of the living object accelerated the scanning speed by a factor of 5, widening the field of view within the same acquisition time. Mouse ears, as well as mouse brains with intact craniums, were imaged in vivo in both total concentration and oxygen saturation of hemoglobin.
Optical-resolution photoacoustic microscopy (OR-PAM), which can detect both physiologically specific endogenous contrasts (e.g., oxy-hemoglobin (HbO2) and deoxy-hemoglobin (HbR) [1]) and molecular-specific exogenous contrasts (e.g., congo red labeled amyloid plaques [2]) with cellular or subcellular spatial resolution, has found broad biomedical applications in such fields as neurology [2], ophthalmology [3, 4], and vascular biology [5]. In our first-generation (G1) OR-PAM, the optical-acoustic combiner suffers significant acoustic loss [2]. Moreover, the G1 system could cover only a small field of view (FOV) within a reasonable acquisition time because translating the living object for scanning must be slow enough to avoid possible disturbance to the object. Here, we report our second-generation (G2) OR-PAM with improved detection sensitivity and imaging speed. In G2 OR-PAM, we have designed a novel optical-acoustic combiner, which improves the detection sensitivity by 18.4 dB over the G1 system. Moreover, the fiber-based light delivery allows scanning the imaging head rather than the living object, thereby enabling fast in vivo imaging (5 times as fast as the G1 system) over a large FOV (centimeters along the lateral dimensions). More valuably, instrument-scanning extends the scope of G2 OR-PAM to objects that are impractical to move mechanically for scanning (e.g., humans).
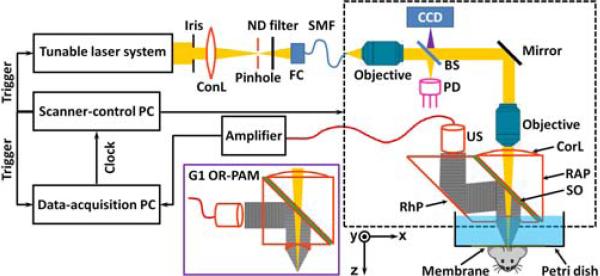
Our G2 OR-PAM system (Fig. 1) employs a wavelength-tunable laser system, consisting of a diode-pumped solid-state laser (INNOSLAB, Edgewave) and a dye laser (CBR-D, Sirah), for photoacoustic irradiation at single or multiple optical wavelengths. A mirror-loaded piezo actuator (P-287, Physik Instrumente) is incorporated into the cavity of the dye laser for fast wavelength tuning (0.3 nm/ms). The output laser beam (pulse width: 7 ns) is reshaped by an iris (ID25SS, Thorlabs; the aperture size is set to 2 mm), and then focused by a condenser lens (LA1131, Thorlabs) before passing through a 50-μm pinhole (P50C, Thorlabs). The pinhole is positioned slightly away from the focus of the condenser lens (focal diameter: 18 μm) to match the diameters of the pinhole and the fundamental-mode beam for effective spatial filtering. The filtered beam is attenuated by a neutral density filter (NDC-50C-2M, Thorlabs) and launched into a single-mode fiber coupler (F-91-C1, Newport). The output of the single-mode fiber (P1-460A-FC-2, Thorlabs) is collimated by a microscope objective (RMS4X, Thorlabs), reflected by a stationary mirror, and fills the back aperture of another identical objective (imaging objective) to achieve nearly diffraction-limited optical focusing. A beam sampler (BSF05-A, Thorlabs) and a photodiode are inserted between the collimation objective and the stationary mirror to monitor the fluctuation in laser intensity. Different from the G1 OR-PAM system (solid-boundary inset in Fig. 1), where two right-angle prisms sandwich a thin layer of silicone oil for acoustic-optical coaxial alignment [6], G2 OR-PAM replaces the lower right-angle prism with a rhomboid prism (NT49-419, Edmund Optics) to enhance the detection sensitivity (as discussed later). An acoustic lens [numerical aperture (NA): 0.5] is ground in the bottom of the rhomboid prism, and provides an acoustic focal diameter of 43 μm at the 50-MHz central frequency of the ultrasonic transducer (V214-BB-RM, Olympus-NDT). The optical and acoustic foci are aligned confocally to maximize the detection sensitivity. The acoustic lens is submerged in a water-filled Petri dish (9 cm in diameter) for acoustic coupling. An imaging window is opened in the bottom of the Petri dish and sealed with a polyethylene membrane for optical and acoustic transmission. Two-dimensional raster scanning of the imaging head (dashed box in Fig. 1), in combination with time-resolved acoustic detection, provides volumetric imaging of tissue optical absorption. A charge-coupled device camera (MEDSI3, Meade Instruments) is added to view the imaging region through the reverse path of the optical illumination.
Fig. 1.
Schematic of G2 OR-PAM. The solid-boundary inset shows the configuration of the acoustic-optical combiner in G1 OR-PAM. ConL: condenser lens; ND: neutral density; FC: fiber collimator; SMF: single-mode fiber; CCD: charge-coupled device; BS: beam splitter; PD: photodiode; CorL: correction lens; RAP: right-angle prism; SO: silicone oil; RhP: rhomboid prism; US: ultrasonic transducer.
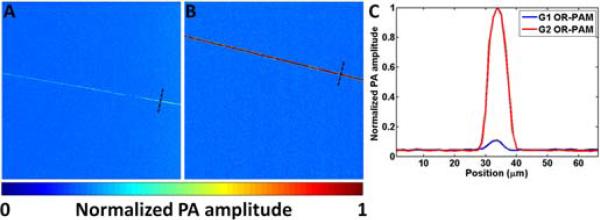
In the G1 system, the obliquely incident (45°) acoustic signal is reflected by a single solid-liquid interface (Fig. 1), where the energy of the longitudinal acoustic wave is coupled into both shear and longitudinal waves [7]. According to the boundary conditions and Snell's Law [8], 85.1% of the incident acoustic energy is transformed from longitudinal mode to shear mode at the interface, and only 0.8% of the acoustic energy remains in longitudinal mode. The second inclined surface provided by the rhomboid prism in the G2 system is able to transform 97.2% of the shear-wave energy back into longitudinal waves, to which the ultrasonic transducer is much more sensitive. In comparison to the combiner in the G1 system, the new design can theoretically result in a 20-dB increase in the detected longitudinal-wave energy, which was expected to provide much higher detection sensitivity. As an experimental validation, we imaged the same 6 μm carbon fiber using both the G1 and G2 systems (Fig. 2). Our results show that, at the same optical irradiation level (6.5 nJ/pulse), the signal-to-noise ratio (SNR) of the G2 system was 18.4 dB higher than that of the G1 system. The actual improvement in SNR is in good agreement with the theoretical estimation.
Fig. 2.
(Color online) Sensitivity comparison. The same carbon fiber is imaged by (A) G1 and (B) G2 OR-PAM at the same laser fluence level. (C) Photoacoustic signal profiles of the representative carbon fiber cross sections indicated in panels A and B (black dashed lines). PA: photoacoustic.
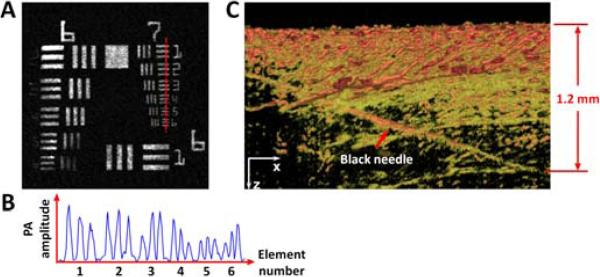
In the G2 OR-PAM system, the NAs of both microscope objectives are 0.1 in air. However, the imaging objective is compensated for water immersion by the correction lens, so the effective NA of the imaging objective is 0.133. Thus, the theoretical lateral resolution [measured in full width at half maximum (FWHM)] of the G2 system (i.e., the diffraction-limited optical focal diameter) is calculated to be 2.14 μm at 570 nm. The lateral resolution of the G2 system was experimentally quantified by imaging an Air Force resolution test target (04TRN003, CVI Melles Griot) at 570 nm. As shown in Figs. 3A and 3B, the G2 system is capable of resolving the finest line pairs (Group 7, Element 6) with a modulation depth of 62%. Modulation transfer function analysis [6] reveals a cutoff spatial frequency (i.e., the frequency at which the modulation depth reaches zero) of 390 cycles/mm, which corresponds to a FWHM resolution of 2.56 μm. The experimentally measured lateral resolution is slightly worse than the diffraction-limit estimate, which is likely due to imperfect aberration compensation. The maximum tissue penetration was also experimentally quantified by inserting a 250-μm-diameter black needle obliquely into a living mouse leg (Hsd:Athymic Nude-Foxn1NU, Harlan). As shown in Fig. 3C, the G2 system can clearly image the needle down to 1.2 mm beneath the tissue surface. Compared with the 0.7-mm ex vivo penetration of G1 OR-PAM at 630 nm (where blood absorption is ~25 times lower than at 570 nm), the 1.2-mm in vivo penetration of G2 OR-PAM at 570 nm is much deeper, due to the enhanced detection sensitivity.
Fig. 3.
(Color online) Spatial resolution and in vivo tissue penetration of G2 OR-PAM. (A) OR-PAM image of an Air Force resolution test target. (B) The cross-sectional profile of the 6 elements in group 7 of the resolution target, as indicated by the red dashed line in (A). (C) OR-PAM image of a black needle inserted obliquely in a living mouse leg. PA: photoacoustic.
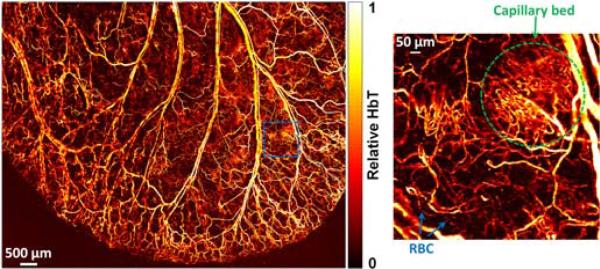
The much improved system performance enables G2 OR-PAM to image a large FOV with single red-blood-cell (RBC) resolution and sensitivity. Figure 4 shows the whole-ear vascular anatomy in a 10-week-old living nude mouse (Hsd:Athymic Nude-Foxn1NU, Harlan). Acquired at the isosbestic wavelength of 570 nm, Fig. 4 also reflects the distribution of total hemoglobin concentration (HbT) in relative values. The laser pulse energy after the imaging objective was measured to be 80 nJ. Since the optical focus is 150-μm beneath the skin surface, the surface laser fluence is 22 mJ/cm2, which is close to the American National Standards Institute safety limit (20 mJ/cm2 in the visible spectral region). Densely packed capillary beds as well as discrete RBCs traveling along capillaries are clearly resolved. The typical acquisition time of such a single-wavelength, bidirectionally scanned image (image size: 7.8 mm × 10 mm; step size: 2.5 μm × 2.5 μm) is 70 min, which is 5 times as fast as that for the G1 system. The B-scan rate of 7.8 mm across is 0.95 Hz. Because the absorption coefficient of blood at 570 nm is estimated to be 241.1 cm-1 and the SNR within the dual foci is 42.7 dB, the sensitivity of G2 OR-PAM in terms of the noise-equivalent optical absorption coefficient and hemoglobin concentration are 1.8 cm-1 and 17 μM, respectively.
Fig. 4.
OR-PAM of relative HbT in a living mouse ear, revealing the vascular anatomy. Insert shows a densely packed capillary bed and individual red blood cells traveling along a capillary.
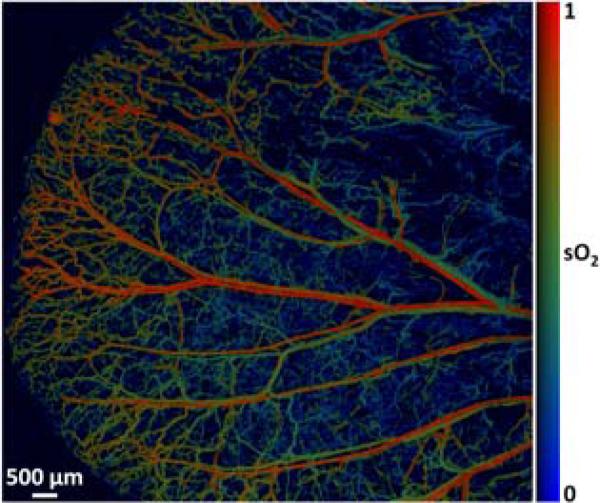
With dual-wavelength measurements (561 nm and 570 nm), G2 OR-PAM can also reveal the hemoglobin oxygen saturation (sO2) of the whole-ear vasculature at the capillary level (Fig. 5). The image acquisition time of such a detailed sO2 map is 80 min (image size: 10.6 mm ×10 mm; step size: 2.5 μm × 5 μm). Note that the scanning speed of the G2 OR-PAM system can be further improved by using a high-repetition-rate laser. Our recent experimental results show another 3-fold improvement in speed with a 40-kHz pulsed laser.
Fig. 5.
(Color online) Dual-wavelength (561 nm and 570 nm) OR-PAM of sO2 in a living mouse ear.
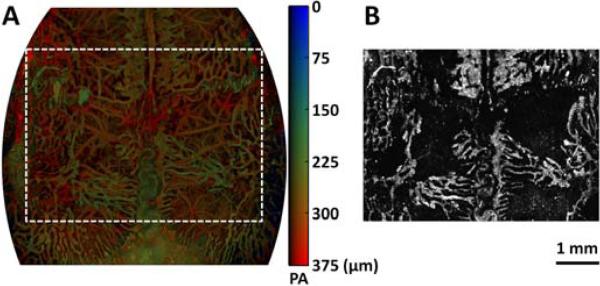
Taking advantage of the time-resolved acoustic detection, G2 OR-PAM can clearly differentiate skull vessels and cortical vessels in living mice. As a validation, we perfused the skull vessels in a 3-month-old Swiss Webster mouse (Hsd:ND4, Harlan) with methylene blue dye. At 570 nm, both the methylene-blue-perfused skull vessels and the RBC-perfused cortical vessels provide strong photoacoustic signals, which are shown in different colors in the depth-encoded image (Fig. 6A). At 650 nm, where hemoglobin has very low optical absorption (~40 times lower than at 570 nm), only the skull vessels remain visible (Fig. 6B), which show perfect agreement with the green-encoded skull vasculature in Fig. 6A. Note that the depth range (0–375 μm) in Fig. 6A does not reflect the maximum cortical penetration of G2 OR-PAM through the intact skull, because the maximum signal rather than the deepest signal is projected along each A-line.
Fig. 6.
(Color online) Transcranial OR-PAM of a living adult mouse brain. (A) depth-encoded maximum-amplitude-projection (MAP) image of both methylene-blue-perfused skull vasculature and blood-perfused cortical vasculature at 570 nm. (B) MAP image of methylene-blue-perfused skull vasculature at 650 nm. PA: photoacoustic.
We have developed G2 OR-PAM with high-sensitivity acoustic detection and instrument-scanning. Compared with G1 OR-PAM, the detection sensitivity and the scanning speed are improved by 18.4 dB and 5-fold, respectively. Large-FOV, volumetric microscopy of vascular anatomy and sO2 are demonstrated. The imaging speed can be further improved without compromising the FOV by combining optical and mechanical scanning.
Acknowledgments
The authors appreciate Prof. James Ballard's close reading of the manuscript, and thank Ernie Gonzales and Christopher Favazza for experimental assistances. This work was sponsored by National Institutes of Health Grants R01 EB000712, R01 EB008085, R01 CA134539, U54 CA136398, and 5P60 DK02057933. Lihong Wang has a financial interest in Microphotoacoustics, Inc. and Endra, Inc., which, however, did not support this work.
References
- 1.Hu S, Maslov K, Wang LV. Opt. Express. 2009;17:7688. doi: 10.1364/oe.17.007688. [DOI] [PMC free article] [PubMed] [Google Scholar]
- 2.Hu S, Yan P, Maslov K, Lee J-M, Wang LV. Opt. Lett. 2009;34:3899. doi: 10.1364/OL.34.003899. [DOI] [PMC free article] [PubMed] [Google Scholar]
- 3.Hu S, Rao B, Maslov K, Wang LV. Opt. Lett. 2010;35:1. doi: 10.1364/OL.35.000001. [DOI] [PMC free article] [PubMed] [Google Scholar]
- 4.Jiao SL, Jiang MS, Hu JM, Fawzi A, Zhou QF, Shung KK, Puliafito CA, Zhang HF. Opt. Express. 2010;18:3967. doi: 10.1364/OE.18.003967. [DOI] [PMC free article] [PubMed] [Google Scholar]
- 5.Oladipupo S, Hu S, Santeford A, Yao J, Kovalski JR, Shohet R, Maslov K, Wang LV, Arbeit JM. Blood. doi: 10.1182/blood-2010-09-307538. (in press) [DOI] [PMC free article] [PubMed] [Google Scholar]
- 6.Maslov K, Zhang HF, Hu S, Wang LV. Opt. Lett. 2008;33:929. doi: 10.1364/ol.33.000929. [DOI] [PubMed] [Google Scholar]
- 7.Kinsler LE. Fundamentals of acoustics. Wiley; 2000. [Google Scholar]
- 8.Brekhovskikh LM. Waves in layered media. Academic Press; 1980. [Google Scholar]


