Abstract
This letter presents a useful method that combines the full-range complex Fourier domain optical coherence tomography (OCT) with the ultrahigh sensitive optical microangiography (OMAG) to achieve full range complex imaging of blood flow within microcirculatory tissue beds in vivo. We propose to use the fast scanning axis to realize the full range complex imaging, while using the slow axis to achieve OMAG imaging of blood flow. We demonstrate the proposed method by using a high speed 1310nm OCT/OMAG system running at 92 kHz line scan rate to image the flow phantoms in vitro, and the blood flows in tissue beds in vivo.
As a variation of Fourier domain optical coherence tomography (OCT)1, optical microangiography (OMAG) was recently developed to image blood perfusion within microcirculatory tissue beds in vivo 2. An unprecedented sensitivity to the blood flow down to 4µm/s was reported with the most recent development of ultrahigh sensitive OMAG (UHS-OMAG)3. The modality has been successfully employed to image the microcirculations within cortical brain4 and lymph node5 in mice, and within human skin3 and retina6. However, because it is based on Fourier domain configuration, UHS-OMAG has limited imaging depth due to the finite spectral resolution of the spectrometer that is used to capture the real-valued spectral interferograms. The consequences of this fact include: 1) the finite spectral resolution causes characteristic system-sensitivity falling off along the depth with higher sensitivity approaching the zero delay line from both the positive and negative spaces, 2) the real-valued spectral interferograms leads to a complex conjugate mirror image coexisted with the true image in the output plane, implying that only half of the output plane are useful for imaging purposes. Thus, in practice, one has to position the sample entirely within the positive or negative space so that the overlap between the real image and its conjugate counterpart is avoided in order to make interpretation of the resulting OCT/OMAG images unambiguous. On the contrary, because the system sensitivity is the highest around the zero delay line, it is highly desirable that the imaging is performed by placing the zero-delay line inside the sample.
To take the advantage of high system-sensitivity around the region of the zero delay line for imaging the blood flow within microcirculatory tissue beds, several methods have been recently proposed in which the full-range complex (FRC) OCT technology is combined with the phase-resolved Doppler OCT7 to achieve the FRC-imaging of blood flow. For example, researchers in8 demonstrated a method for the FRC-imaging of flow by combining the phase-modulation FRC technique with the joint time and spectral domain OCT. However, according to the analyses in 9, to fully reconstruct the FRC-OCT image, the modulation frequency (Doppler frequency shift) in the interferogram induced by the axial component, fx, of the flow velocity must fall within a range of −(fs/4 −BW/2)<fx< (fs/4 −BW/2), where fs is the sampling frequency of the system; BW is the spatial frequency bandwidth of the sample. Any flow that gives a Doppler frequency shift outside this range is beyond the capability of this technique. To mitigate this problem, an easiest way is to increase the acquisition speed of the system. The consequence of increasing system scanning speed is, however, an evident sensitivity loss to the slow blood flow due to the limitation of the phase-resolved OCT used. Another way to solve aforementioned problem is to use a parabolic phase modulation method, which was proposed in10. Although this method could increase the ability for FRC-imaging of the fast flows, the inevitable increase of the phase noise determined a loss of flow sensitivity in imaging slow blood flows.
In this letter, we propose a useful method to provide full range complex imaging of blood flow within tissue beds that is realized by combining our unique UHS-OMAG approach with the full-range complex OCT technique. The basic idea behind this method is based on the fact that the X (fast axis) and Y (slow axis) scanning directions of the 2D galvoscanner are independent to each other. This fact gives us an opportunity to achieve the full range complex OCT by the use of the fast axis, while achieving UHS-OMAG by the use of the slow axis. As a result, full-range complex imaging of blood flow is achieved with high sensitivity to both the slow (attained by UHS-OMAG) and the fast flows (attained by the fast scanning speed).
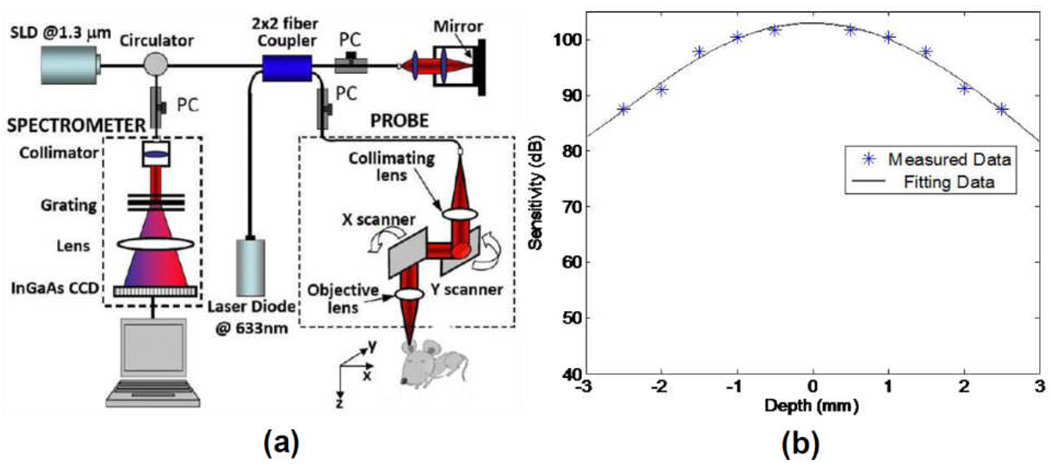
The schematic of our FRC-UHS-OMAG system is illustrated in Fig. 1(a), which is similar to that used in the previous work11 except the use of a high speed line scan camera operating at 92 kHz. Briefly, the system parameters are: 1310 nm light source (DL-CS3159A, DenseLight Ltd. Singapore), ~12µm axial resolution in the air, and ~16 µm lateral resolution, ranging distance of ~3mm on both sides of the system zero-delay line. An important element of this system is the employment of a high speed InGaAs camera (SU-LDH2, Goodrich Ltd, USA) capable of achieving an imaging speed of 92 kHz line scan rate. This imaging speed is important because it can provide a measurement of maximum axial component of a flow speed at ~60.3 mm/s. At 92 kHz speed, the system-sensitivity was measured and shown in Fig. 1(b), where it is 102 dB at the zero-delay line, and then characteristically falls off due to the finite spectral resolution of the spectrometer as expected. At the maximum depth of 3mm, it is ~82 dB, representing 20dB falling off across the entire range. However, within a range between ±1.5 mm, the sensitivity falling-off is only ~6 dB. Therefore, it can be advantageous if the sample is placed across the zero-delay line (between +1.5mm and −1.5mm). During imaging, we used a 70 Hz saw-tooth waveform to drive the X-scanner (B frame rate, i.e., fast axis), and a 0.035 Hz triangle waveform to drive the Y-scanner (C scan rate, i.e., slow axis). For fast scanning, we captured 1000 A-lines that covered ~2 mm range for one B-scan to provide sufficient correlation between adjacent A-lines required for full range complex imaging for each B scan. For slow scanning, we also acquired 1000 frames in ~ 2 mm (one C-scan) to provide sufficient correlation between frames required for UHS-OMAG imaging of blood flow. The entire 3D scan took ~14 seconds.
Fig.1.
(a) Schematic system setup used in this study, with (b) its measured system sensitivity. PC: polarization controller.
There are a number of approaches that can be used in the setup to achieve full range complex imaging, for example those proposed in12. However, here we used a simple approach to demonstrate our proposed method, in which we simply offset the incident beam of the sample arm from the pivot of X-scanner to introduce the required modulation frequency, fx, in the interferograms13–15. With an offset of 3.1 mm, fx = 23 kHz15. However for the Y-scanner, the sample beam was adjusted to impinge onto its pivot, giving no modulation-frequency upon the interferograms.
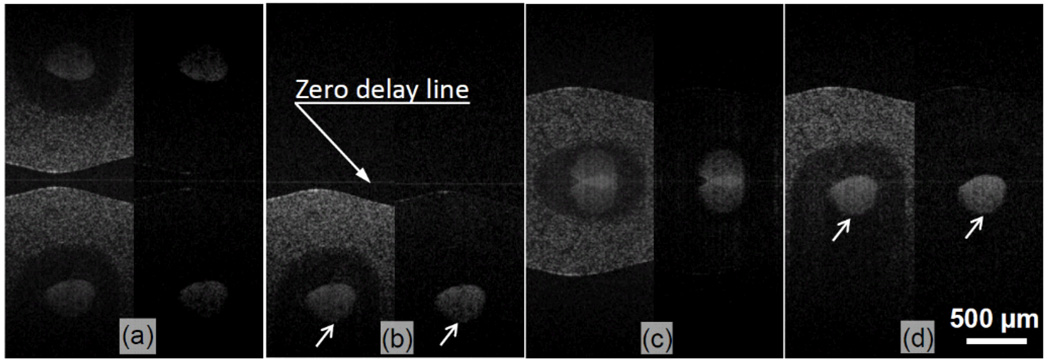
In order to demonstrate the proposed FRC-UHS-OMAG imaging of flow, we first performed experiments to image in-vitro flows within a plastic capillary tube buried within a tissue phantom. The phantom was made from mixing the gelatin with 2% milk to simulate the tissue background scattering. A syringe pump was used to control the 2% intralipid water solution flowing in the capillary tube. We first placed the sample on one side of the zero-delay line to simulate the conventional case. Then we moved the sample to cross over the zero-delay line to demonstrate the sensitivity advantage. The results are given in Fig.2. Fig. 2(a) is a pair of images, representing the traditional OCT structural image (left) and UHS-OMAG flow image (right) when the sample was placed on one side of the zero-delay line. Due to the complex conjugate artifacts, half of the imaging depth was wasted. The corresponding pair of FRC images is shown in Fig. 2(b). Compared to the conventional approach, the FRC mode could successfully get rid of the mirror images with a rejection ratio of up to ~40 dB. When the sample is crossed over the zero-delay line, the pairs of results from the conventional and FRC approaches are shown in Figs. 2(c) and 2(d), respectively. As we can see, the traditional OCT and UHS-OMAG are totally failed to provide clear cross sectional images since the existence of mirror artifacts [Fig. 2(c)], while FRC mode successfully retrieved the true structure and flow images [Fig. 2(d)). Particular attention should be paid to the flow signals pointed by the arrows, where there is about ~15dB enhancement in signal strength by placing the sample around the zero-delay line region [Fig.2(d)], compared to that by using only the half of output plane for imaging [Fig.2(b)].
Fig.2.
OCT structural and OMAG flow images resulted from a flow phantom. Each figure consists of a pair of images with the structural image on the left and the flow image on the right. (a) and (c) are the results from the conventional approach, and (b) and (d) are the corresponding results from the FRC imaging approach.
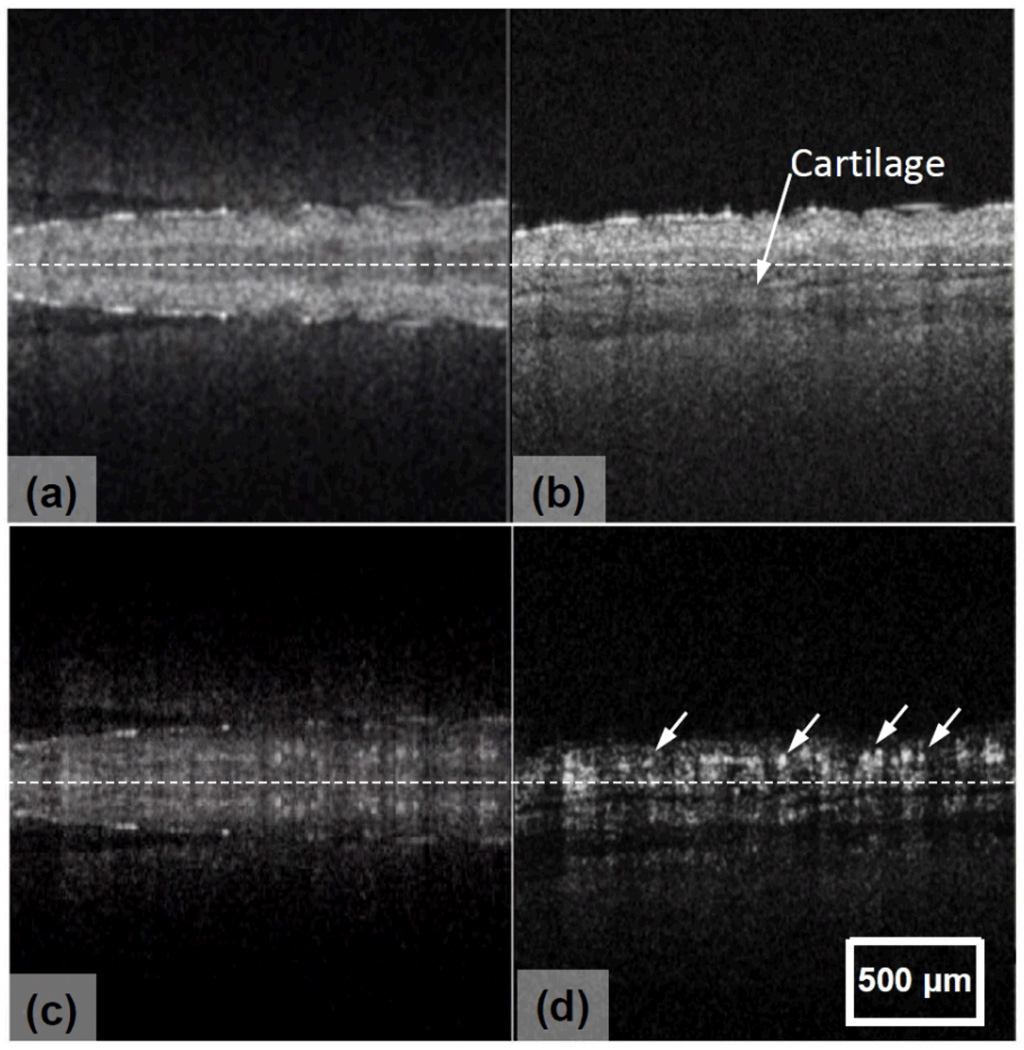
The imaging capability of our FRC-UHS-OMAG system was also demonstrated through imaging capillary blood vessels of a mouse ear flap in vivo. The scanning protocol described above was applied to capture a 3D data cube which covered ~ 2×2 mm2 area on the mouse ear. During imaging, we purposely adjusted the sample across the zero-delay line. Typical cross-sectional images extracted from the 3D dataset are shown in Fig.3, where the results from the traditional approach are given on the left, while those on the right are from the current method. It is clear that the proposed FRC successfully retrieved the true microstructures and microcirculations of the sample without ambiguity. Because of the elimination of conjugate mirror artifacts, the detailed microstructures ]e.g., cartilage within the ear flap, pointed by arrows in Fig. 3(b)], and the blood flow signals, including those from capillaries ]arrows in Fig.3(d)], are demarcated, demonstrating the advantage of the proposed FRC imaging of blood flow with high sensitivity.
Fig.3.
A mouse ear imaged in vivo by: (a) conventional and (b) FRC OCT imaging of microstructures, and the corresponding (c) conventional and (d) FRC UHS-OMAG imaging of blood flows. Note that the images are truncated to remove the top and bottom parts that do not contain useful information. Dashed line indicates the zero-delay line.
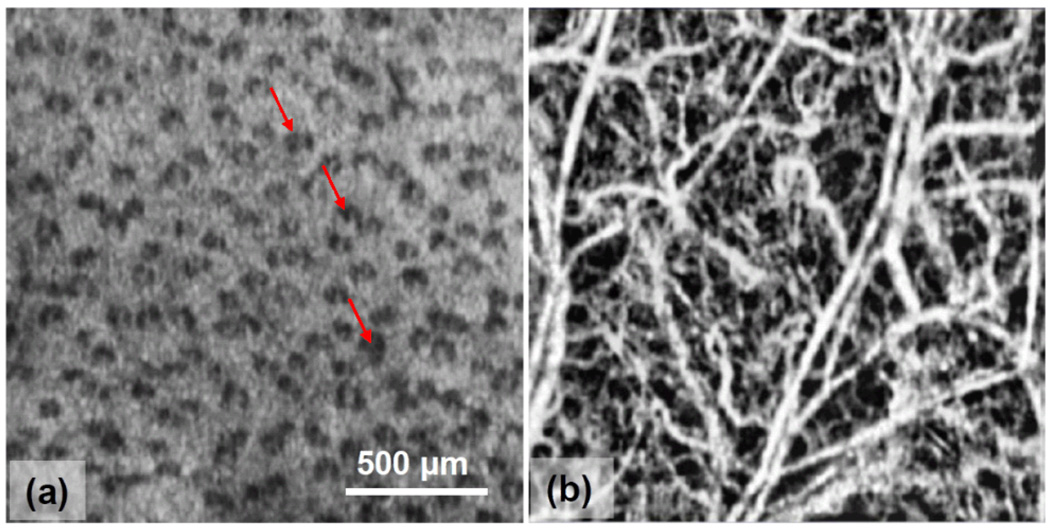
Fig.4 shows the 2D projection views resulted from FRC imaging of the scanned tissue volume. Fig. 4(a) gives a 2D map by integration of all structural signals along the depth, where the regular pattern of the hair pores (e.g., pointed by the arrows) are clearly visualized. Fig. 4(b) illustrates a 2D map by using the maximum amplitude projection of the blood flow signals along the depth, where the blood vessel networks are well demarcated, on the scale of either big vessels where the blood flow is supposedly fast, or capillaries in which the movement of blood cells is very slow.
Fig.4.
2D projection views of (a) FRC-OCT structural image and (b) FRC-UHS-OMAG blood flow image from the 3D tissue volume.
In summary, we have proposed a useful method for high-sensitive blood flow imaging that is based on the combined use of FRC-OCT and UHS-OMAG. By the use of the fast scanning axis to achieve the FRC imaging of microstructures, while using the slow scanning axis to realize the UHS-OMAG imaging of blood flow, we have demonstrated the proposed approach through imaging the flow phantoms in vitro and the blood flows within microcirculatory tissue beds in vivo. The method may also be adapted to other flow imaging techniques, e.g., speckle variance approach16 and single-pass approach17 to achieve full range blood flow imaging.
Acknowledgments
This work was supported in part by research grants from the National Institutes of Health (R01HL093140, R01EB009682, and R01DC010201).
Footnotes
OCIS Codes: 170.4460, 170.3880.
References
- 1.Fercher AF, Drexler W, Hitzenberger CK, Lasser T. Optical coherence tomography – principles and applications. Rep. Prog. Phys. 2003;66:239–303. [Google Scholar]
- 2.Wang RK, Jacques SL, Ma Z, Hurst S, Hanson SR, Gruber A. Three dimensional Optical Angiography. Opt. Express. 2007;15(7):4083–4097. doi: 10.1364/oe.15.004083. [DOI] [PubMed] [Google Scholar]
- 3.An L, Qin J, Wang RK. Ultrahigh sensitive optical microangiography for in vivo imaging of microcirculations within human skin tissue beds. Opt. Express. 2010;18:8220–8228. doi: 10.1364/OE.18.008220. [DOI] [PMC free article] [PubMed] [Google Scholar]
- 4.Jia YL, Wang RK. Label-free in vivo optical imaging of functional microcirculations within meninges and cortex in mice. J Neurosci. Methods. 2010;194:108–115. doi: 10.1016/j.jneumeth.2010.09.021. [DOI] [PMC free article] [PubMed] [Google Scholar]
- 5.Jung Y, Zhi ZW, Wang RK. 3D optical imaging of microvascular network within intact lymph node in vivo. J Biomed Opt. 2010;15:050101. doi: 10.1117/1.3496301. [DOI] [PMC free article] [PubMed] [Google Scholar]
- 6.Wang RK, An L, Francis P, Wilson D. Depth-resolved imaging of capillary networks in retina and choroid using ultrahigh sensitive optical microangiography. Opt. Lett. 2010;35:1467–1469. doi: 10.1364/OL.35.001467. [DOI] [PMC free article] [PubMed] [Google Scholar]
- 7.Zhao YH, Chen ZP, Ding ZH, Ren H, Nelson JS. Real-time phase-resolved functional optical coherence tomography by use of optical Hilbert transformation. Opt. Lett. 2002;27:98–100. doi: 10.1364/ol.27.000098. [DOI] [PubMed] [Google Scholar]
- 8.Szkulmowski M, Grulkowski I, Szlag D, Szkulmowska A, Kowalczyk A, Wojtkowski M. Opt. Express. 2009;17:14281. doi: 10.1364/oe.17.014281. [DOI] [PubMed] [Google Scholar]
- 9.Wang RK. Fourier domain optical coherence tomography achieves full range complex imaging in vivo by introducing a carrier frequency during scanning. Phys Med Biol. 2007;52:5897–5907. doi: 10.1088/0031-9155/52/19/011. [DOI] [PubMed] [Google Scholar]
- 10.Jaillon F, Makita S, Yabusaki M, Yasuno Y. Opt. Express. 2010;18:1358. doi: 10.1364/OE.18.001358. [DOI] [PubMed] [Google Scholar]
- 11.Wang RK, An L. Doppler optical micro-angiography for volumetric imaging of vascular perfusion in vivo. Opt. Express. 2009;17(11):8926–8940. doi: 10.1364/oe.17.008926. [DOI] [PMC free article] [PubMed] [Google Scholar]
- 12.Wang RK. In vivo full range complex Fourier domain optical coherence tomography. Appl. Phys. Lett. 2007;90(5):054103. doi: 10.1364/ol.32.003423. [DOI] [PubMed] [Google Scholar]
- 13.Baumann B, Pircher M, Götzinger E, Hitzenberger CK. Opt. Express. 2007;15:13375. doi: 10.1364/oe.15.013375. [DOI] [PMC free article] [PubMed] [Google Scholar]
- 14.Leitgeb RA, Michaely R, Lasser T, Sekhar SC. Opt. Lett. 2007;32:3453. doi: 10.1364/ol.32.003453. [DOI] [PubMed] [Google Scholar]
- 15.An L, Wang RK. Use of scanner to modulate spatial interferogram for in vivo full range Fourier domain optical coherence tomography. Opt. Lett. 2007;32:3423–3425. doi: 10.1364/ol.32.003423. [DOI] [PubMed] [Google Scholar]
- 16.Mariampillai Adrian, Leung MichaelKK, Jarvi Mark, Standish BeauA, Lee Kenneth, Wilson BrianC, Vitkin Alex, Yang VictorXD. Optimized speckle variance OCT imaging of microvasculature. Opt. Lett. 2010;35:1257–1259. doi: 10.1364/OL.35.001257. [DOI] [PubMed] [Google Scholar]
- 17.Tao YuankaiK, Kennedy KristenM, Izatt JosephA. Velocity-resolved 3D retinal microvessel imaging using single-pass flow imaging spectral domain optical coherence tomography. Opt Express. 2009;17:4177–4188. doi: 10.1364/oe.17.004177. [DOI] [PMC free article] [PubMed] [Google Scholar]


