Abstract
This paper presents a small-flip-angle, three-dimensional tailored RF pulse that excites thin slices with an adjustable quadratic in-plane spatial variation. The quadratic spatial variation helps to compensate for the loss in image uniformity using a volume coil at 3T due to the wavelike properties of the RF field. The pulse is based on a novel “fast-kz” design that uses a series of slice-select sub-pulses along kz and phase encoding “blips” along kx-ky. The method is demonstrated by acquiring a series of 5 mm thick T2-weighted images of the human brain at 3T using pulses 4.8 ms in length with a 45° flip angle.
Keywords: MRI, Human brain, B1 inhomogeneity, high magnetic fields, tailored RF pulses
INTRODUCTION
The advantages of MRI at high static magnetic field strengths (B0≥3T) include increased signal to noise ratio (SNR) (1,2) and increased functional MRI contrast (3,4). However, a major source of artifact at high B0 results from RF field (B1) inhomogeneity (5,6). One factor that leads to B1 inhomogeneity is the shorter RF wavelength (inversely proportional to B0) that is further shortened by the dielectric properties of tissue. A wavelength shorter than the imaged object can create standing waves or so-called “dielectric resonances” inside the object (7). A second cause is the attenuation of RF amplitude due to tissue conductivity (8,9). These artifacts typically appear in the image center as a region of brightness using a volume head coil at 3T (10–13). The brightness can lead to a loss of contrast in the image and an improper measure of the spin density.
Methods have been proposed to mitigate B1 inhomogeneity including special coil designs (14–16), adiabatic pulses (17), and image post-processing (18,19). Although improved coil designs are effective, they cannot account for the object’s physical properties. Adiabatic pulses are problematic because of increased power deposition in the subject. Image post-processing accounts for inhomogeneity by scaling pixel magnitudes but does not improve contrast or SNR. Small-flip-angle tailored RF (TRF) pulses have also been shown to be effective (20–22). Deichmann et al. used impulse pulses that had a spatial compensation along the z-y directions and Saekho et al. used an in vivo map of the B1 inhomogeneity and a three-dimensional (3D) slab-select TRF pulse. Although these techniques are promising for 3D imaging, the pulses are not optimal for two-dimensional (2D) imaging because they provide poor slice-selection or will be too long to be used practically.
In order to overcome the limitations of the previous TRF methods, we propose a 3D TRF pulse that uses continuous (slice-select) gradients along the z direction and phase encoding along the x and y directions (23,24). This pulse is termed “fast-kz” because it traverses kz rapidly with several slice-select sub-pulses. The advantage of this pulse is that it allows for thin slices to be excited without sidelobes along z. Furthermore, the pulse will be short in duration if we are only interested in correcting a smooth variation due to B1 inhomogeneity. Below we present a theoretical model as well as brain imaging results at 3T for a fast-kz 3D TRF pulse that excites an adjustable quadratic spatial variation.
THEORY
The small-flip-angle solution to the Bloch equations (25) can be extended to include a 2D inhomogeneous transmit sensitivity pattern α(x, y) ∈[0,1]:
| [1] |
Here M(r) is the complex transverse magnetization, M0 is the equilibrium magnetization, γ is the gyromagnetic ratio, B1(t) is the RF field, and Δ(k(t)) is the inverse of the sample density (26). The term W(k(t)) is the Fourier transform of the desired slice profile w(r) sampled along the k-space produced by the gradients G(t) of duration T:
| [2] |
In order to achieve a spatially homogenous flip angle distribution in a slice, one can define the desired profile as
| [3] |
where p(z) is the profile along the slice-select direction and it assumed thatα(x, y) ≠ 0.
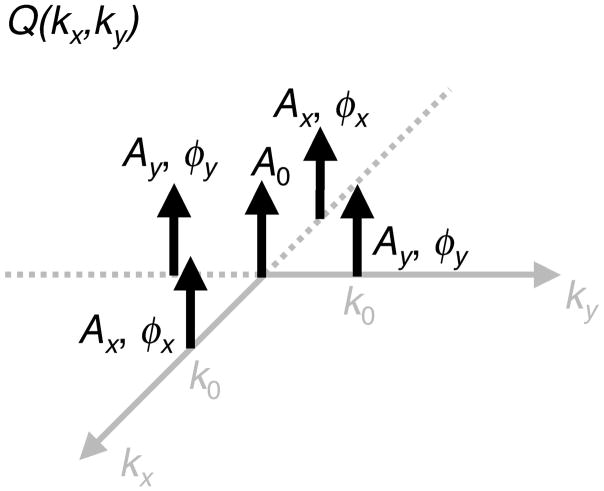
Because the inhomogeneity in a slice from a volume coil at 3T is typically observed as a smoothly varying brightness that peaks at the image center, q(x,y) can be approximated as the sum of a constant plus a quadratic function. The Fourier transform Q(kx,ky) of the quadratic function can be approximated from five Dirac delta functions in kx-ky:
| [4] |
Figure 1 shows a diagram of the locations and weights of the delta functions in kx-ky the plane. The phase factors φx and φy and the weights Ax and Ay allow for the general case where the inhomogeneity is off center or requires different curvatures in each direction. The inverse Fourier transformation of Q(kx,ky) gives
FIG. 1.
Diagram of the five Dirac delta functions in the kx-ky plane that constitute Q(kx,ky). Appropriate choice of the amplitudes, phases, and locations of the delta functions will produce an inverse Fourier transformation q(x,y) that is the sum of a constant and a quadratic.
| [5] |
in which the spatial shifts are
| [6] |
If k0 is set to be small such that the period of the cosine is greater than the FOV of the excitation, the cosine functions can be approximated to give the desired spatial variation
| [7] |
where (x0, y0) is the center. Note that a rotation of the quadratic spatial distribution can be easily accomplished by a rotation of the kx-ky plane. If we set k0 = 1/(2FOV ) we can define εx and εy as the fractional difference in the excitation profile between the center and the edge of the FOV:
| [8] |
The edges of the excited slice will have greater image intensity than the middle as long as εx and εy are positive. One can determine the parameters A0, Ax, Ay, φx, and φy by measuring α(x,y) directly (19) or by an ad hoc visual inspection of the resultant images.
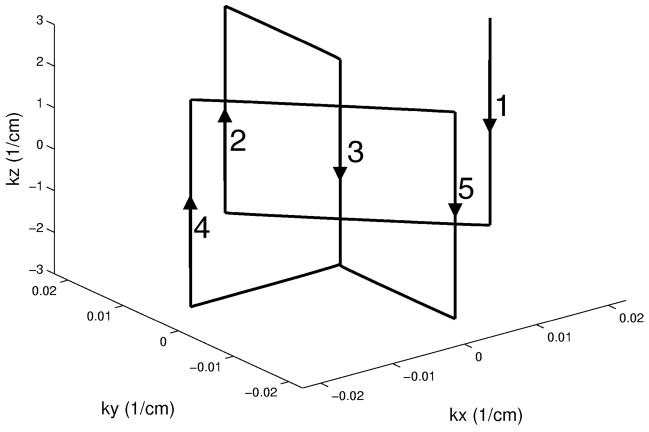
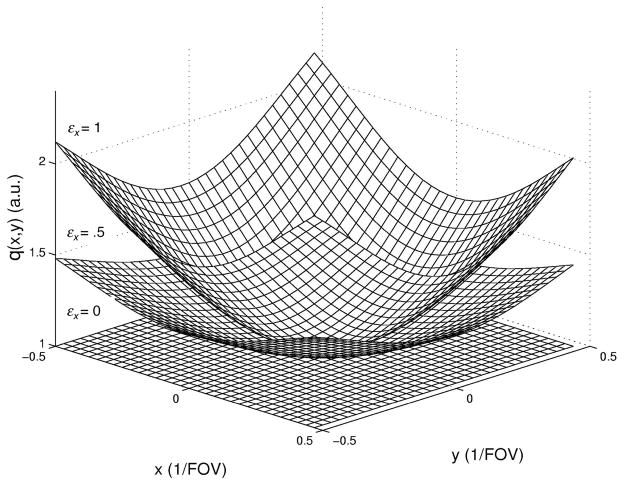
A 3D TRF pulse that produces the above excitation profile can be obtained with the fast-kz design consisting of five slice-select sub-pulses. A standard slice-select RF pulse, such as with a Gaussian or sinc profile P(kz) (the Fourier transformation of p(z)), and the appropriate z-gradient can be used for each sub-pulse. The parameters Ax, Ay, φx, and φy determine the relative amplitudes and phases of each sub-pulse. Phase encoding gradients in x and y determine the locations of each sub-pulse in kx-ky. Figure 2 shows a diagram the k-space trajectory for the fast-kz 3D TRF pulse. Figure 3 shows Bloch equation simulation results for the excitation profile for different degrees of B1 inhomogeneity correction. Further details of the pulses are given below in the Methods section.
FIG. 2.
Diagram of the k-space trajectory used for the fast-kz 3D tailored RF pulses. The numbered arrows show the order of each slice-select sub-pulse.
FIG. 3.
Profiles q(x,y) obtained from Bloch equation simulations of three fast-kz 3D tailored RF pulses with varying degrees of B1 inhomogeneity correction (εx = 0.0, 0.5, and 1.0). The quadratic was assumed to be centered (φx = φy =0) and cylindrically symmetric (Ax = Ay). The pulses were similar to that shown in Fig. 4.
METHODS
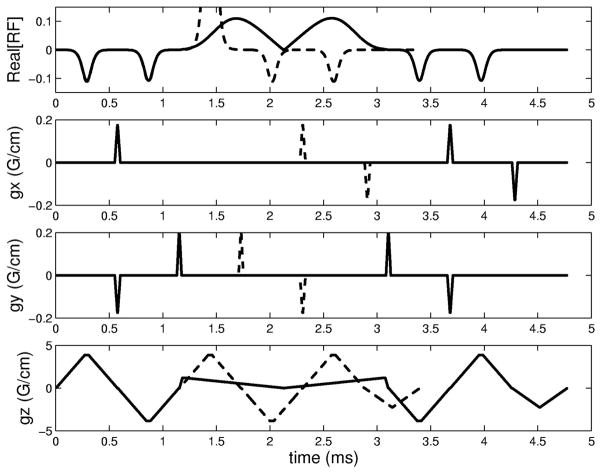
The 3D TRF pulses were designed for a GE (General Electric Medical Systems, Waukesha, WI) 3T scanner (150 T/m/sec slew rate and 40 mT/m peak gradient) located at the University of Pittsburgh’s Magnetic Resonance Research Center. A standard birdcage coil was used for transmission and reception. The pulse construction programs were written in Matlab (The Mathworks, Natick, MA). Each of the five sub-pulses consisted of a Gaussian function for P(kz) and a trapezoidal z-gradient for a 5 mm thick slice. For proof-of-concept purposes, it was assumed that the B1 inhomogeneity was centered in the magnet (φx = φy = 0) and was cylindrically symmetric (Ax = Ay). Due to the varying degree of B1 inhomogeneity at different slice locations, the amplitudes A0 and Ax of the pulses were calculated such that three complete pulses were made with values of εx equal to 0.5, 1.0, and 1.5, respectively. The overall pulse amplitude was calibrated to the scanner flip angle by scaling the area to the standard sinc pulse used in the pre-scan. The excitation FOV of the pulse was set equal to 24 cm. Due to the peak B1 limitation of the RF amplifier, the pulses were modified by lengthening the central sub-pulse and by using the variable rate selective excitation (VERSE) technique (27). Figure 4 shows an example of a fast-kz 3D TRF pulse and the corresponding gradients before and after lengthening the central pulse and using VERSE. The original pulse was 3.4 ms long and the final pulse was 4.7 ms. The peak RF pulse was reduced by approximately 90%.
FIG. 4.
B1 inhomogeneity compensated fast-kz 3D tailored RF pulse. The rows (top to bottom) are the RF waveform and the x-, y-, and z-gradients, respectively. The dashed lines represent the pulse before the use of VERSE to reduce the peak of the central sub-pulse. The RF waveform before using VERSE was normalized to 1. This resulted in the central sub-pulse becoming clipped in the figure.
Imaging experiments were performed in three human subjects. Approval for human subjects was obtained from the University of Pittsburgh Internal Review Board. The pulses were inserted into a standard multi-shot spiral sequence optimized for 2D T2-weighted structural imaging. The acquisition used 24 interleaves for a 256×256 resolution, a 45° flip angle, a TR = 1500 ms, a TE = 8 ms, and a FOV = 24 cm. Sixteen axial slices were excited with a standard sinc pulse and the three fast-kz 3D TRF pulses in each subject. The uniformity of the images was evaluated by two means. The first was by the measuring the difference between the image magnitude at the edges and at the centers in regions of interest (ROI’s). The ROI’s were 2.5 cm on a side and positioned by visual inspection to include equal amounts of gray and white matter. It is expected that the corrected images will have a more spatially uniform pixel magnitude than the uncorrected images. The second was by creating a histogram of the number of pixels in a slice separated into bins of increasing image magnitude. A narrower width and a taller height of the histogram indicate improved uniformity. The tightness of the histogram was quantified by a calculation of the entropy S given by
| [9] |
where fn is the fraction of pixels in bin n in the histogram (28). N gives the total number of bins in the histogram. The entropy was normalized to the entropy of the pixels being evenly distributed, S0 = ln(N ). A smaller value of entropy is indicative of a more ordered system. If all of the pixels have the same intensity then the entropy will be 0.
RESULTS
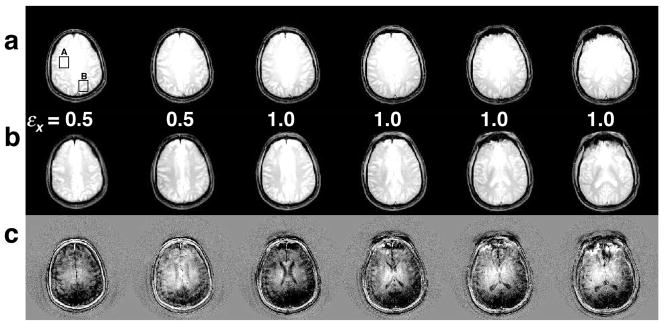
Figure 5(a) shows brain images from one representative subject excited with the standard sinc pulse. The images have a greater magnitude in the center than at the edges due to B1 inhomogeneity. Figure 5(b) shows images at the same locations excited with the fast-kz 3D TRF pulse with εx = 0.5 and 1.0. The images in both (a) and (b) were windowed between zero and their mean magnitude. Visual inspection was used to determine which value of εx provided a better correction for each slice. As expected, the superior slices needed less compensation than those more centrally located in the brain. The pulse with εx = 1.5 was found to overcompensate and the images were discarded. Images inferior to these were also acquired and showed comparable improvement using the fast-kz 3D TRF pulse, however, these were discarded from the analyses due to slight differences in susceptibility artifact from the different slice profiles. Figure 5(c) shows the difference between rows (a) and (b) windowed between ±10% of the mean magnitude of the images in (a). The difference images show that the RF pulse reduces the magnitude at the center and increased the magnitude at the edges as desired.
FIG. 5.
Examples of six 5 mm thick T2-weighted images acquired at 3T with a standard sinc pulse (a) and the fast-kz 3D tailored RF pulse with different correction factors (b). The images acquired with the fast-kz 3D tailored RF pulse show more uniformity than the images acquired with the standard pulse. (c) Images of the differences between (a) and (b).
Table 1 gives the mean and difference in magnitude in two 2.5×2.5 cm2 ROI’s for all of the slices in Fig. 5. The boxes “A” and “B” in the upper left slice in Fig. 5 indicate the locations of the ROI’s. The magnitudes were normalized to the peak magnitude of the slices in (a). The mean of the difference in magnitude for all slices was 0.32 and 0.11 for Fig. 5(a) and (b), respectively. The smaller difference observed in (b) is indicative of improved uniformity. Table 1 also lists values of the entropy calculated from pixel magnitude histograms (N = 50) generated for each slice in (a) and (b). The entropy calculation excluded pixels outside the brain. The pixel magnitudes in the slices excited with the fast-kz 3D TRF pulse have lower entropy values. Figure 6 shows a histogram of all the pixels in the six slices shown in Fig. 5(a) and (b) by the dashed and solid lines, respectively. Fitting the histograms with a Gaussian probability distribution produced means and standard deviations of 0.54± 0.10 and 0.57± 0.08 (arbitrary units) for the sinc and fast-kz 3D TRF pulse, respectively. The histogram from the images excited with the fast-kz 3D TRF pulse is taller and (20%) narrower than that of the sinc pulse, indicating a more uniform distribution of pixel magnitudes.
Table 1.
Normalized mean magnitudes in ROI’s and normalized magnitude entropies from the brain slices shown in Fig. 4. The ROI’s A and B are shown in the upper left slice in Fig. 4. The differences in magnitude A-B are also shown.
| Slice | 1 | 2 | 3 | 4 | 5 | 6 |
|---|---|---|---|---|---|---|
| Sinc Pulse | ||||||
| A | 0.98 | 0.97 | 0.88 | 1.00 | 1.00 | 1.00 |
| B | 0.64 | 0.68 | 0.65 | 0.65 | 0.61 | 0.66 |
| A–B | 0.34 | 0.29 | 0.23 | 0.35 | 0.39 | 0.34 |
| S/S0 | 0.91 | 0.92 | 0.93 | 0.94 | 0.95 | 0.90 |
| Fast-kz 3D Tailored RF Pulse | ||||||
| A | 0.97 | 0.87 | 0.92 | 1.00 | 0.94 | 0.88 |
| B | 0.86 | 0.79 | 0.85 | 0.82 | 0.79 | 0.80 |
| A–B | 0.11 | 0.08 | 0.07 | 0.18 | 0.15 | 0.08 |
| S/S0 | 0.87 | 0.86 | 0.89 | 0.90 | 0.90 | 0.90 |
Statistical significance determined by t-test gave p-values of 0.00003 and 0.004 for A–B and S/S0, respectively.
FIG. 6.
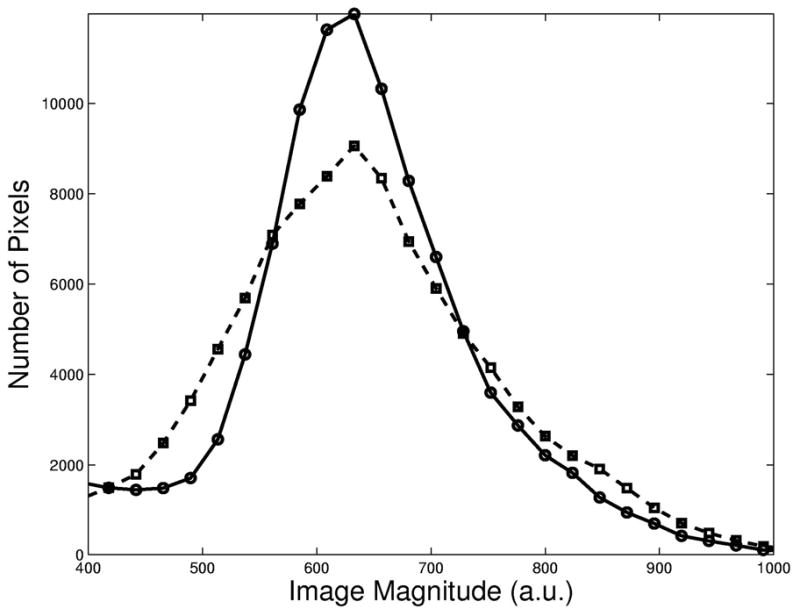
Histogram of the number of pixels as a function of image magnitude for all slices in Fig. 4(a) and (b) shown as dashed and solid lines, respectively. The histogram from images acquired with the fast-kz 3D tailored RF pulse is tighter, indicative of a more homogeneous distribution of pixel magnitudes.
DISCUSSION AND CONCLUSIONS
In this work we presented a new RF pulse method for B1 inhomogeneity correction based on the “fast-kz” 3D TRF design that can be used for 2D imaging. The advantages of this pulse design when compared to the stack of spirals approach (22) include the elimination of sidelobes along the slice-select direction and thin (~1–5 mm) slices with short (4–5 ms) pulse lengths. We show that only five sampling points in kx-ky are needed to produce an adjustable quadratic correction in image magnitude. We demonstrated the technique assuming a centered, cylindrically symmetric correction, however, the theoretical model for pulse allows for shifting the center and asymmetry of the B1 inhomogeneity in x-y. This correction is ideally suited for the use of a volume coil where there is a large centralized peak in the B1 inhomogeneity. The pulse should be useful even with a phased array receiver because the transmit inhomogeneity from a body coil will be similarly distributed. Flip angles up to 45° were used with no observable errors in the images or simulations; however, a rigorous analysis of non-linearity at higher flip angles still needs to be performed. We are currently working on numerical methods for spin-echo or inversion implementations of the pulse. Improvements can be obtained by numerically determining the pulse parameters for each slice, which will also address the inhomogeneity along the slice-select direction. This can be accomplished by first measuring transmit inhomogeneity maps of the slices of interest using a variable flip angle sequence (19) and smoothing the maps to low resolution. If we use Eq. [7] and assume the function is centered such that x0 = y0 = 0, the parameters A0, Ax, and Ay can be determined by fitting the maps using a linear least squares fit (29). These steps can be accomplished during pre-scan similarly to B0 shimming.
The human brain results at 3T clearly show improved B1 uniformity. The ROI analysis suggested approximately a 66% reduced inhomogeneity in the brain images acquired using the fast-kz 3D TRF pulse compared to a standard sinc pulse. Although different tissue types were included in these ROI’s, care was taken to include equal amounts of gray and white matter and exclude CSF. The histogram and entropy measures also showed an increase in the order of the pixel magnitudes, which is also an indicator of improved homogeneity. Both of these analyses can be further improved using tissue segmentation. Experiments were also carried out on a NiCl phantom (data not presented) that had a larger degree of inhomogeneity. These images showed similar improvements using the proposed technique. Limitations of the pulse include a high peak B1, which was addressed by widening the central sub-pulse and with the VERSE technique. Practical pulse lengths of 4.8 ms were obtained even with these modifications. The use of VERSE is not mandatory and can make the pulse more prone to B0 inhomogeneity. The peak B1 will become more problematic if thicker slices are desired. Note that power deposition in the subject is not a problem because although the pulse has a high peak B1, its integral over time is small. Another concern regards the fast switching of the z-gradient, which can cause eddy currents and timing mismatches producing misalignment of the slice-select sub-pulses (30). Although these issues were not observed in the above implementation, a careful analysis between the effects of fast gradient switching and the added susceptibility to T2* decay and motion in a “fly-back” design needs to be performed.
Acknowledgments
Supported by NIMH 1 R01 MH66066-03 and NIDA 1 R21 DA015900-03.
Thanks to Dr. Qing Yang at Penn State University Medical School (Hershey, PA, USA) for useful discussions.
References
- 1.Hoult D, Richards R. The signal to noise ratio of the nuclear magnetic resonance experiment. J Magn Reson. 1976;24:71–85. doi: 10.1016/j.jmr.2011.09.018. [DOI] [PubMed] [Google Scholar]
- 2.Edelstein WA, Glover GH, Hardy CJ, Redington RW. The intrinsic signal-to-noise ratio in NMR imaging. Magn Reson Med. 1986;3(4):604–18. doi: 10.1002/mrm.1910030413. [DOI] [PubMed] [Google Scholar]
- 3.Ogawa S, Lee T, Nayak A, Glynn P. Oxygenation-sensitive contrast in magnetic resonance image of rodent brain at high magnetic fields. Magn Reson Med. 1990;14:68–78. doi: 10.1002/mrm.1910140108. [DOI] [PubMed] [Google Scholar]
- 4.Ugurbil K, Hu X, Chen W, Zhu XH, Kim SG, Georgopoulos A. Functional mapping in the human brain using high magnetic fields. Philos Trans R Soc Lond B Biol Sci. 1999;354(1387):1195–213. doi: 10.1098/rstb.1999.0474. [DOI] [PMC free article] [PubMed] [Google Scholar]
- 5.Bottomley P, Andrews E. RF magnetic field penetration, phase shift and power dissipation in biological tissue: Implications for NMR imaging. Phys Med Biol. 1978;23:630–643. doi: 10.1088/0031-9155/23/4/006. [DOI] [PubMed] [Google Scholar]
- 6.Glover GH, Hayes CE, Pelc NJ, Edelstein WA, Mueller OM, Hart HR, Hardy CJ, O’Donnell M, Barber WD. Comparison of linear and circular polarization for magnetic resonance imaging. J Magn Reson. 1985;64:255–270. [Google Scholar]
- 7.Ibrahim TS, Lee R, Abduljalil AM, Baertlein BA, Robitaille PM. Dielectric resonances and B(1) field inhomogeneity in UHFMRI: computational analysis and experimental findings. Magn Reson Imaging. 2001;19(2):219–26. doi: 10.1016/s0730-725x(01)00300-9. [DOI] [PubMed] [Google Scholar]
- 8.Yang QX, Wang J, Zhang X, Collins CM, Smith MB, Liu H, Zhu XH, Vaughan JT, Ugurbil K, Chen W. Analysis of wave behavior in lossy dielectric samples at high field. Magn Reson Med. 2002;47(5):982–9. doi: 10.1002/mrm.10137. [DOI] [PubMed] [Google Scholar]
- 9.Collins CM, Liu W, Schreiber W, Yang QX, Smith MB. Central brightening due to constructive interference with, without, and despite dielectric resonance. J Magn Reson Imaging. 2005;21(2):192–6. doi: 10.1002/jmri.20245. [DOI] [PubMed] [Google Scholar]
- 10.Jin J, Chen J. On the SAR and field inhomogeneity of birdcage coils loaded with the human head. Magn Reson Med. 1997;38:953–863. doi: 10.1002/mrm.1910380615. [DOI] [PubMed] [Google Scholar]
- 11.Collins CM, Li S, Smith MB. SAR and B1 distribution in a heterogeneous human head model within a birdcage coil. Magn Reson Med. 1998;40:847–856. doi: 10.1002/mrm.1910400610. [DOI] [PubMed] [Google Scholar]
- 12.Ibrahim TS, Lee R, Baertlein BA, Robitaille PM. B1 field homogeneity and SAR calculations for the birdcage coil. Phys Med Biol. 2001;46(2):609–19. doi: 10.1088/0031-9155/46/2/324. [DOI] [PubMed] [Google Scholar]
- 13.Alecci M, Collins CM, Smith MB, Jezzard P. Radio frequency magnetic field mapping of a 3 Tesla birdcage coil: experimental and theoretical dependence on sample properties. Magn Reson Med. 2001;46(2):379–85. doi: 10.1002/mrm.1201. [DOI] [PubMed] [Google Scholar]
- 14.Alsop D, Connick T, Mizsei G. A spiral volume coil for improved RF field homogeneity at high static magnetic field strength. Magn Reson Med. 1998;40:49–54. doi: 10.1002/mrm.1910400107. [DOI] [PubMed] [Google Scholar]
- 15.Vaughan J, Adriany G, Garwood M, Yacoub E, Duong T, DelaBarre L, Anderson P, Ugurbil K. Detunable transverse electromagnetic (TEM) volume coil for high-field NMR. Magn Reson Med. 2002;47:990–1000. doi: 10.1002/mrm.10141. [DOI] [PubMed] [Google Scholar]
- 16.Ibrahim TS, Lee R, Baertlein BA, Abduljalil AM, Zhu H, Robitaille PM. Effect of RF coil excitation on field inhomogeneity at ultra high fields: a field optimized TEM resonator. Magn Reson Imaging. 2001;19(10):1339–47. doi: 10.1016/s0730-725x(01)00404-0. [DOI] [PubMed] [Google Scholar]
- 17.Staewen R, Johnson A, Ross B, Parrish T, Merkle H, Garwood M. 3-D FLASH imaging using a single surface coil and a new adiabatic pulse, BIR-4. Invest Radiol. 1990;25:559–567. doi: 10.1097/00004424-199005000-00015. [DOI] [PubMed] [Google Scholar]
- 18.Cohen MS, DuBois RM, Zeineh MM. Rapid and effective correction of RF inhomogeneity for high field magnetic resonance imaging. Hum Brain Mapp. 2000;10(4):204–11. doi: 10.1002/1097-0193(200008)10:4<204::AID-HBM60>3.0.CO;2-2. [DOI] [PMC free article] [PubMed] [Google Scholar]
- 19.Wang J, Qiu M, Yang QX, Smith MB, Constable RT. Measurement and correction of transmitter and receiver induced nonuniformities in vivo. Magn Reson Med. 2005;53(2):408–17. doi: 10.1002/mrm.20354. [DOI] [PubMed] [Google Scholar]
- 20.Deichmann R, Good CD, Josephs O, Ashburner J, Turner R. Optimization of 3-D MP- RAGE sequences for structural brain imaging. Neuroimage. 2000;12(1):112–27. doi: 10.1006/nimg.2000.0601. [DOI] [PubMed] [Google Scholar]
- 21.Deichmann R, Good C, Turner R. RF inhomogeneity compensation in structural brain imaging. Magn Reson Med. 2002;47:398–402. doi: 10.1002/mrm.10050. [DOI] [PubMed] [Google Scholar]
- 22.Saekho S, Boada FE, Noll DC, Stenger VA. A Small Tip Angle 3D Tailored RF Slab-Select Pulse For Reduced B1 Inhomogeneity at 3T. Magn Reson Med. 2005;53:479–484. doi: 10.1002/mrm.20358. [DOI] [PMC free article] [PubMed] [Google Scholar]
- 23.Rieseberg S, Frahm J, Finsterbusch J. Two-dimensional spatially-selective RF excitation pulses in echo-planar imaging. Magn Reson Med. 2002;47:1186–1193. doi: 10.1002/mrm.10157. [DOI] [PubMed] [Google Scholar]
- 24.Yip C-P, Fessler JA, Noll DC. A Novel Fast and Adaptive Trajectory in Three-Dimensional Excitation k-Space. Proc of the 13th Annual Meeting of the ISMRM; Miami, Florida, USA. 2005. p. 2350. [Google Scholar]
- 25.Pauly JM, Nishimura D, Macovski A. A k-space analysis of small-tip-angle excitation. J Magn Reson. 1989;81:43–56. doi: 10.1016/j.jmr.2011.09.023. [DOI] [PubMed] [Google Scholar]
- 26.Hardy CJ, Cline HE, Bottomley PA. Correcting for nonuniform k-space sampling in two- dimensional NMR selective excitation. J Magn Reson. 1990;87:639–645. [Google Scholar]
- 27.Conolly S, Nishimura D, Macovski A, Glover GH. Variable-rate selective excitation. J Magn Reson. 1988;78:440–458. [Google Scholar]
- 28.Mangin J-F. Entropy measure for automatic correction of intensity nonuniformity. In Proc. IEEE Workshop on Mathematical Methods in Biomedical Image Analysis; Hilton Head, South Carolina, USA. 2000. pp. 162–169. [Google Scholar]
- 29.Press W, Teukolsky S, Vetterling W, Flannery B. Numerical Recipes in C: The Art of Scientific Computing. Cambridge, UK: Cambridge University Press; 1992. [Google Scholar]
- 30.Oelhafen M, Pruessmann KP, Kozerke S, Boesiger P. Calibration of echo-planar 2D- selective RF excitation pulses. Magn Reson Med. 2004;52(5):1136–45. doi: 10.1002/mrm.20248. [DOI] [PubMed] [Google Scholar]


