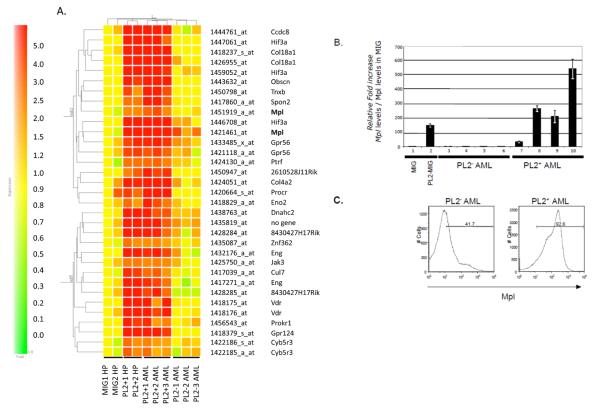
Figure 1. Identification of PLAGL2 target genes in leukemia development using microarray analysis.
(A) Cluster of genes specifically up-regulated in PLAGL2+ cells from two-dimensional hierarchical clustering analysis. Hematopoietic progenitor samples infected with MIG (MIG1-HP and MIG2-HP), HPs infected with PLAGL2-MIG (PL2+1HP and PL2+2MIG), AML samples expressing PLAGL2 (PL2+1, PL2+2, and PL2+ AMLs), and AML samples not expressing PLAGL2 (PL2−1, PL2−2, PL2−3 AMLs). All samples express Cbfb-MYH11. (B) Relative Mpl transcript levels of Cbfb-MYH11/hematopoietic progenitor (HP) transduced with MIG (lane 1) or MIG-PLAGL2 (lane 2) retrovirus, and of PLAGL2-negative (PL2−; lanes 3-6) and PLAGL2-positive (PL2+; lanes 7-10) Cbfb-MYH11 AML samples using quantitative RT-PCR analysis. (C) Expression of Mpl receptor in AML cells with non-detectable PLAGL2 expression (left panel) or expressing PLAGL2 (right panel) using FACS analysis. Percentage of cells expressing Mpl is shown relative to negative control.

