

Abstract
Amyotrophic lateral sclerosis (ALS) is a rapidly progressive and ultimately fatal neurodegenerative disease with an average survival of 3 years from symptom onset. Rapid and conclusive early diagnosis is essential if interventions with disease-modifying therapies are to be successful. Cytoskeletal modification and inflammation are known to occur during the pathogenesis of ALS. We measured levels of cytoskeletal proteins and inflammatory markers in the cerebrospinal fluid (CSF) of ALS, disease controls and healthy subjects. We determined threshold values for each protein that provided the optimal sensitivity and specificity for ALS within a training set, as determined by receiver operating characteristic (ROC) analysis. Interestingly, the optimal assay was a ratio of the levels for phosphorylated neurofilament heavy chain and complement C3 (pNFH/C3). We next applied this assay to a separate test set of CSF samples to verify our results. Overall, the predictive pNFH/C3 ratio identified ALS with 87.3% sensitivity and 94.6% specificity in a total of 71 ALS subjects, 52 disease control subjects and 40 healthy subjects. In addition, the level of CSF pNFH correlated with survival of ALS patients. We also detected increased pNFH in the plasma of ALS patients and observed a correlation between CSF and plasma pNFH levels within the same subjects. These findings support large-scale prospective biomarker studies to determine the clinical utility of diagnostic and prognostic signatures in ALS.
Keywords: Neurofilament Heavy Chain, Complement C3, Biomarker, Amyotrophic lateral sclerosis
Introduction
Amyotrophic lateral sclerosis (ALS) is a fatal neurodegenerative disease with an annual incidence of ~2 per 100,000 in the United States and average survival of 3 years after symptom onset (Haverkamp et al. 1995). The clinical diagnosis of ALS takes on average 16–18 months from symptom onset, based on the progression of symptoms and signs of upper and lower motor neuron degeneration over time (Brooks 1994). Patients often undergo invasive tests to exclude other diseases that may mimic ALS so their disease is typically at an advanced stage before a firm diagnosis is made and treatment initiated (Gelinas 1999).
A robust diagnostic biomarker(s) for ALS would accelerate and simplify the investigative process and result in the earlier implementation of appropriate therapies. An ideal biomarker must show high sensitivity, specificity and overall accuracy for ALS, be validated in a separate set of samples, and ultimately demonstrate clinical utility in prospective studies (Bowser and Lacomis 2009). A single protein biomarker is unlikely to meet such stringent criteria and recent efforts have therefore focused on generating a panel of biomarkers that can be used in combination with clinical parameters to more accurately diagnose ALS.
Clues to potential biomarkers are offered by our understanding of the pathogenesis of ALS and prior ALS biomarker discovery efforts (Ranganathan et al. 2005; Strong et al. 2005; Ryberg and Bowser 2008; Ganesalingam and Bowser 2010). Axonal degeneration and inflammation represent proposed pathogenic mechanisms for ALS, and therefore proteins that function within these pathways represent biomarker candidates (Rothstein 2009).
Cytoskeletal proteins including neurofilament proteins and tau have been shown to be elevated in the CSF of neurodegenerative diseases and proposed as biomarkers for ALS (Sussmuth et al. 2001; Sussmuth et al. 2003; Brettschneider et al. 2006; Wild et al. 2007; Mares et al. 2009). Neurofilament aggregates have been observed in spinal cord motor neurons of ALS patients (Wong et al. 2000). During axonal injury or degeneration, cytoskeletal proteins may be released into the interstitial fluid and accumulate in the CSF and blood. Prior studies have shown significantly increased levels of neurofilament heavy chain in the CSF of ALS patients when compared to healthy control subjects or Alzheimer’s disease patients (Brettschneider et al. 2006). Recently, levels of phosphorylated neurofilament heavy chain (pNFH) were shown to be significantly increased in the CSF of ALS patients when compared to disease mimics (Reijn et al. 2009). In addition, pNFH levels were shown to be significantly increased in blood plasma of some ALS patients, though the total number of subjects was small (Boylan et al. 2009). Further studies are required to verify these biomarker discovery studies.
Numerous inflammatory proteins have been shown to be altered in ALS, including a panel of inflammatory cytokines in the CSF (Kuhle et al. 2009; Mitchell et al. 2009). The complement pathway has been postulated to contribute to motor neuron disease, and complement proteins including C3 have been shown to be increased in the CSF and spinal cord tissue of ALS patients (Annunziata and Volpi 1985; Goldknopf et al. 2006; Woodruff et al. 2008). C-reactive protein (CRP) is an acute phase protein that is an in vivo activator of complement (Wolbink et al. 1996). Therefore CRP may contribute to activation of the complement pathway in motor neuron disease. Complement C3 (C3) has been shown to be expressed in neurons of the rat brain after exposure to kainic acid and expression of C3 is up-regulated in Alzheimer’s disease brains (Yasojima et al. 1999; Morita et al. 2006). Activation of inflammatory and complement pathways, however, is not specific to ALS or other neurodegenerative diseases.
In this study we measured the levels of pNFH, total Tau, C3, and CRP in the CSF of ALS, disease control and healthy control subjects by enzyme linked immunosorbent assays (ELISA). We generated threshold levels for each protein that provided the best sensitivity and specificity within a training set. The optimal biomarker was found to be a ratio of pNFH to C3 levels. We then applied these biomarker threshold values to a separate test set of ALS and control subjects and the pNFH/C3 ratio provided 96% sensitivity and 90% specificity for ALS. In addition, the pNFH level correlated with overall patient survival. Finally, we detected increased plasma pNFH in a subset of ALS patients and correlation of CSF and plasma pNFH levels within the same subject. Our results indicate that the CSF levels of pNFH and C3 may aid in the diagnosis of ALS and supports prospective studies to further evaluate the clinical utility of these candidate biomarkers.
Methods
Clinical details and sample collection
Patients were recruited at either the University of Pittsburgh Medical Center (UPMC) or Massachusetts General Hospital (MGH) upon informed patient consent. The study was approved by both UPMC and MGH institutional review boards. All ALS subjects (n=71) were defined as possible, probable, probable laboratory-supported or definite ALS by El Escorial criteria by experienced neurologists specialized in motor neuron disease. The disease control (DC) group (n=52) comprised a range of diseases including: 14 ALS mimics (2 Primary Lateral s\Sclerosis, 4 Hereditary Spastic Paraplegia, 1 Progressive Muscular Atrophy, 1 Multifocal Motor Neuropathy with conduction block, 5 Peripheral Neuropathy, 1 Chronic Inflammatory Demyelinating Polyneuropathy); 15 Multiple Sclerosis cases (one had co-existent Lupus); 6 Neurodegenerative conditions (2 Frontotemporal Lobe Dementia without motor involvement, 2 Alzheimer’s Disease, 1 Parkinson’s Disease, 1 Spinocerebellar Ataxia); 4 Neoplasia cases (Lymphoma and secondary metastasis); 3 Inflammatory conditions (2 Myelopathy, 1 Neurosarcoidosis); 5 infectious diseases (1 Viral encephalitis, 2 Lyme’s disease, 2 Aseptic meningitis); 2 Metabolic (Seizure disorder, Superficial Siderosis); 1 Migraine; 1 Conversion disorder; and 1 Normal pressure hydrocephalus. The healthy control (HC) group (n=40) consisted of age-matched healthy volunteers from the community. The ethnicity was predominantly caucasian with only four documented cases from minority ethnic groups.
We generated a training set of 106 subjects from the UPMC clinic and a test set of 57 subjects from the MGH clinic. The training set contained 8 of the disease mimics. The clinical details for each subject group are listed in Table 1. Gender ratios for each group were matched as close as possible across the training and test sets.
Table 1.
Demographics of CSF training and test sets
| A) Training Set | |||
|---|---|---|---|
| Disease group | ALS | DC | HC |
| N | 45 | 25 | 36 |
| Sex: M:F | 32:13 | 13:12 | 13:23 |
| Age (Mean+/− St. Dev) | 55.0 +/− 13.4 | 47.9 +/− 15.4 | 46.8 +/− 15.6 |
| Site of onset Bulbar: Spine | 7:37 (1 cognitive onset) | N/A | N/A |
| Median Disease duration | 15.2 months | N/A | N/A |
| B) Test set | |||
|---|---|---|---|
| Disease group | ALS | DC | HC |
| N | 26 | 27 | 4 |
| Sex M:F | 11:9 | 16:11 | 2:2 |
| Age (Mean +/− St. Dev) | 55.1+/− 13.8 | 54.1 +/− 14.7 | 45.3 +/− 20.0 |
| Bulbar : Limb | 5:21 | N/A | N/A |
| Median Disease duration | 17.8 months | N/A | N/A |
Median disease duration represents the mean time from patient reported onset of clinical symptoms to the date when samples were collected.
All samples were processed and stored at −80°C within 2 hours of collection. CSF was collected by lumbar puncture into polypropylene tubes and centrifuged at 450-g for 5 minutes at 4°C to remove any cells and debris, aliquoted in small volumes and stored in low bind Eppendorf tubes at −80°C. Blood was collected at the same office visit into Ethylenediaminetetracetic acid (EDTA) tubes, incubated for 30 minutes at room temperature, centrifuged at 1733-g for 10 minutes at 4°C and the layer containing plasma removed and aliquoted in small volumes and stored in low bind Eppendorf tubes at −80°C.
ELISA
Total protein was determined using the BCA Protein Assay Kit (Thermo Scientific, Waltham, MA). Levels of candidate biomarkers measured in the CSF were determined using commercial ELISA kits to the Human C-Reactive Protein (CRP, Millipore, Billerica, MA), human phosphorylated Neurofilament H (BioVendor Research and Diagnostic Products, Modrice, Czech Republic) and human total Tau (Invitrogen, Camarillo, CA). A prototype commercial kit was used to determining plasma pNFH levels (EnCor Biotechnology Inc, Gainesville, FL). This ELISA kit uses a pair of mouse monoclonal antibodies to pNFH and has been previously described and shown to measure pNFH in human plasma (Boylan et al. 2009). Samples were run in triplicate and each experiment repeated at least twice.
An ELISA was developed within the laboratory using commercially available antibodies to measure levels of C3 in CSF. Costar 96 well EIA/RIA high binding plates (Corning, Inc. Cat No. 3590 were coated with 2 µg/ml Affi-Anti C3 IgY, (Genway, San Diego, CA), diluted in 0.05M Carbonate-Bicarbonate, pH 9.6 for 60 minutes at room temperature, 100 µl/well. The plates were then washed 3 times with 0.05% Tween 20 in PBS, pH 7.4 followed by incubation with 200 µl/well of blocking solution (Superblock T20 (PBS) Blocking Buffer, Thermo Scientific, Rockford, IL) for 60 minutes at room temperature. After washes, plates were incubated with 100 µl of the sample, diluted 1 in 50 with sample buffer (Superblock T20 (PBS) Blocking Buffer). A standard curve was generated using a human complement C3 Protein Standard, (Genway, San Diego, CA) diluted in blocking solution to 500 ng/ml followed by serial dilutions. Plates were incubated with 100 µl/well. Duplicates were run with coefficients of variation less than 10%. After washes, the plates were incubated 100 µl/well of 0.2mg/ml Affi-anti C3 IgY-HRP (Genway, San Diego, CA) diluted in sample buffer for 60 minutes at room temperature. 100 µl/well of TMB Peroxidase Substrate System (KPL, Gaithersburg, MD) was used to visualize the reaction product and the absorbance values were read at 450nm. Net absorbance was calculated by deducting the mean value obtained for a duplicate of “blank” wells containing diluent buffer only.
Statistics
For group comparisons, non-parametric t-test and one-way ANOVA were used to determine statistical significance followed by Dunn’s multiple comparison test for pair wise group comparisons. For all data analysis we set a significance level of p < 0.05. The Pearson correlation test and Spearman’s rank test for non-parametric analysis were used for correlation analyses, and Pearson test was performed for pairwise correlation analysis for pNFH to patient survival. All statistical analysis was performed using GraphPad Prism 5.0 software (GraphPad Software Inc. La Jolla, CA).
Results
We first measured levels of phosphorylated neurofilament heavy chain (pNFH), total tau (Tau), complement C3 (C3), and C-reactive protein (CRP) in the CSF of a training set consisting of 106 subjects (Table 1A). The median level of pNFH was 1.77ng/ml, 0.2ng/ml and 0.165ng/ml for ALS, DC and HC respectively (Figure 1a). This median level for ALS patients is similar to the mean value of 1.7ng/ml reported earlier (Brettschneider et al. 2006). pNFH was significantly elevated in ALS compared to healthy and disease controls. One-way ANOVA with Dunn’s multiple comparison test is significant (p<0.05) for ALS vs HC and ALS vs DC, but not HC vs DC. C3 was also significantly increased in ALS versus healthy controls and DC versus HC, but not ALS versus DC (Figure 1b). There were no significant alterations (p>0.05) across the subject groups for CRP or Tau using the same statistical tests.
Figure 1.

Scatter plots for four candidate biomarkers in the training set of 106 subjects. (a) pNFH, (b) Complement C3, (c) C reactive protein and (d) Total tau were measured in the cerebrospinal fluid. (a) pNFH was significantly elevated in ALS compared to healthy and disease controls. (b) C3 was also significantly increased in ALS compared to healthy controls but not disease controls. No significant alterations (p>0.05) were found across the subject groups for (c) CRP or (d) Tau. Horizontal line represents the median. HC: Healthy controls; DC: Disease controls; ALS: Amyotrophic lateral sclerosis. All statistical tests were deemed significant (p<0.05) using a One-way ANOVA with Dunn’s multiple comparison test.
A cut-off level of 0.635 ng/ml for pNFH generated a sensitivity of 84.4% sensitivity and 93.5% specificity for ALS in the training set (Table 2). All healthy control subjects exhibited minimal pNFH in the CSF and were below this cut-off value. Among the six disease controls that exhibited pNFH higher than the cut-off value included two subjects with metastatic brain tumors, one with progressive muscular atrophy, one with neurosarcoidosis, one subject with MS and one with multifocal motor neuropathy with conduction block. For C3, a threshold value of 3.62 µg/ml produced a sensitivity of 62% and specificity of 56% for ALS. Increasing the threshold value to 3.99 µg/ml reduced the sensitivity to 50% but increased the specificity to 71%. For CRP, a threshold of 3.2 ng/ml produced a sensitivity of 55% and specificity of 50%. A cut-off value of 240 pg/ml for total tau produced a sensitivity of 50% and specificity of 51%.
Table 2.
Rules for diagnosing ALS generated using the training set. Rules highlighted in bold represent those utilized on the test set.
| Rule | Sensitivity | Specificity |
|---|---|---|
| pNFH > 0.635 | 84.4% | 93.5% |
| pNFH/C3 > 0.000125 | 91.1% | 88.7% |
| pNFH/C3 > 0.21 | 77.8% | 95.2% |
| pNFH/CRP > 0.3755 | 61.4% | 87.1% |
|
pNFH > 0.635 AND pNFH/C3 > 0.000125 |
84.4% | 95.2% |
| pNFH/C3 > 0.00021 AND pNFH/CRP > 0.3755 |
52.2% | 100% |
| pNFH/C3 > 0.00021 OR pNFH/CRP > 0.3755 |
86.4% | 83.9% |
|
pNFH > 0.635 AND pNFH/C3 > 0.000125 AND pNFH/CRP > 0.3755 |
59.1% | 100% |
As C3 and CRP are involved in inflammatory responses, we sought to further distinguish between ALS and disease controls by combining data from cytoskeletal and inflammatory pathways. Therefore, we also calculated ratios of pNFH/C3, pNFH/CRP and pNFH/Total protein for each subject (Figure 2). The pNFH/Total protein ratio demonstrated a similar pattern to pNFH alone indicating that there is an increase in the absolute concentration of pNFH levels rather than a global increase in protein concentration. Interestingly, pNFH/C3 ratio levels showed significant differences (p<0.05 with one-way ANOVA and a Dunn’s multiple comparison test) with less overlap between ALS and both disease controls and healthy control groups. This was also observed by the pNFH/CRP ratio levels (p<0.05), suggesting that inclusion of general inflammatory responses allows more specificity in identifying ALS (Figure 2). We note that calculating the pNFH/CRP ratio can be problematic when levels of CRP are at the assay detection threshold, which occurred for 19 samples. For such cases, they were recorded with the minimum assay concentration value.
Figure 2.

Scatter plots of the ratios for (a) pNFH/C3 (b) pNFH/CRP and (c) pNFH/Total protein for the training set. All scatter plots exhibited significant differences between ALS and the other control groups (p<0.05) using a One-way ANOVA with Dunn’s multiple comparison test. Horizontal line represents the median. HC: Healthy controls, DC: Disease controls, ALS: Amyotrophic lateral sclerosis.
Receptor Operator Characteristic (ROC) curves of the training set were generated for pNFH, pNFH/C3 and pNFH/CRP. The area under the curve (AUC) values were 0.9401, 0.9581and 0.8406 respectively (Figure 3). The ROC curves enabled optimum thresholds to be established for each of the variables in order to maximize the sensitivity and specificity. When determining thresholds, there is always a trade-off between sensitivity and specificity. This is highlighted in Table 2 using different threshold cut-off values for pNFH/C3. The optimal cut-off values were: pNFH/C3 > 0.000125 and pNFH/CRP > 0.3755. Rules were also combined using either an AND function or an OR function. The former tends to increase specificity whereas the latter increases sensitivity. The majority of rules generated sensitivity > 80% and specificity > 90%, with the optimal rule a combination of pNFH and pNFH/C3 ratio levels (Table 2).
Figure 3.

ROC curves of the training set were generated for (a) pNFH, AUC=0.9401 (b) pNFH/C3, AUC=0.9581 and (c) pNFH/CRP, AUC=0.8406 comparing ALS versus Controls to determine a threshold to achieve an optimum sensitivity and specificity as denoted by black circles in each panel.
Together, these results demonstrate that pNFH achieves an excellent level of sensitivity and specificity, similar to findings from other laboratories (Brettschneider et al. 2006; Reijn et al. 2009). For subjects above the pNFH cut-off value, the pNFH/C3 ratio threshold value increases confidence in the diagnosis of ALS. Combining the pNFH cut-off value, the pNFH/C3 ratio and the pNFH/CRP ratio provided 100% specificity in our training set, though the sensitivity for ALS was reduced to 59% (Table 2).
We then sought to verify our findings using a separate test set of 57 samples obtained from a different clinic but collected with the same procedures (Table 1B). We measured pNFH and C3 levels in all test subjects. A similar pattern was observed in this patient cohort, giving us greater confidence in both pNFH and pNFH/C3 in distinguishing ALS from controls. Using the threshold values determined by the ROC curves for the training set, we obtained a sensitivity of 95% and specificity of 93% for pNFH alone and a sensitivity of 96% and specificity of 90% for the pNFH/C3 ratio in the test set.
Finally, we pooled both sets of data to obtain overall values for sensitivity and specificity across all 163 subjects (Figure 4). Figure 5 depicts a scatter plot of pNFH versus C3 values for each subject, showing the separation of ALS from all control subjects using these two proteins. The thresholds for pNFH and pNFH/C3 determined by ROC curves are overlayed on the graph. The increased sensitivity of pNFH/C3 is reflected by ALS cases lying below the pNFH=0.635 threshold but above the pNFH/C3=0.000125 line. Six out of fourteen ALS mimics exhibited a false positive result when testing for pNFH/C3 alone as compared to just two out of fourteen when the pNFH threshold value was used in combination with pNFH/C3. A combined rule of pNFH > 0.6349 ng/ml AND pNFH/C3 > 0.000125 generated a sensitivity of 87.7% and a specificity of 94.6%.
Figure 4.

ROC curves for (a) pNFH and (b) pNFH/C3 using the combined dataset of 163 subjects was generated to determine the final optimum thresholds (denoted by black circles) for sensitivity and specificity used in subsequent validation experiments. For pNFH > 0.635 ng/ml, a sensitivity of 87.7% and specificity of 93.7% is achieved. For pNFH/C3 >0.000125, a sensitivity of 87.7% and specificity of 94.6% is achieved.
Figure 5.
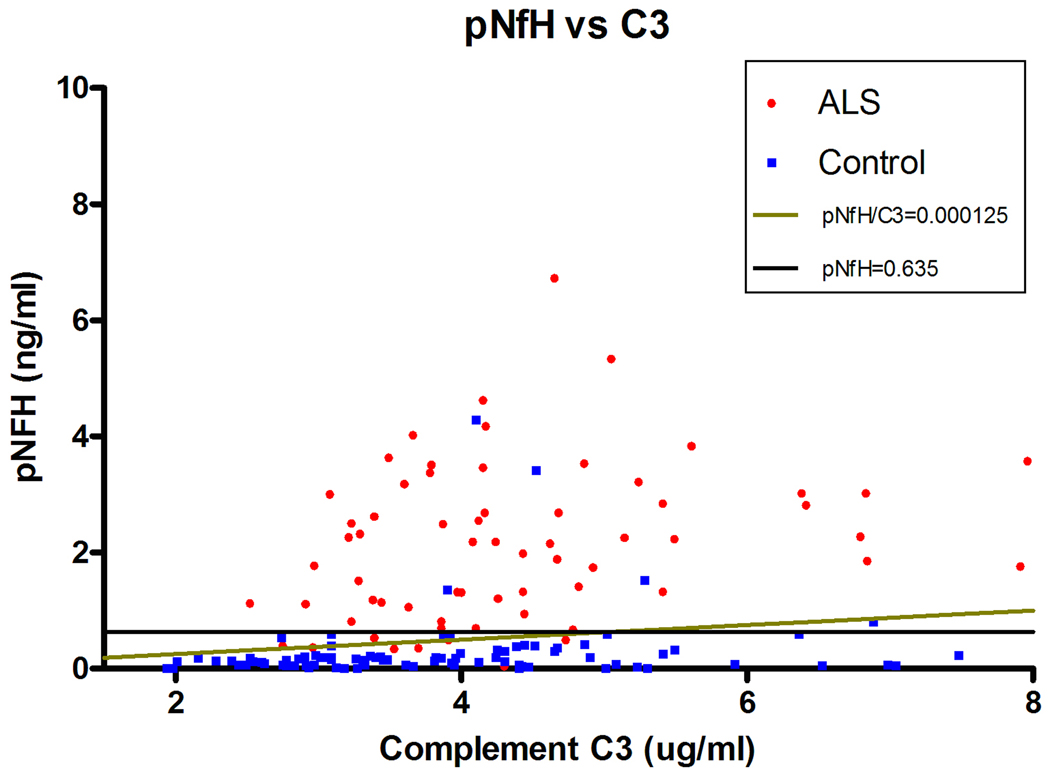
Two-dimensional scatter plot comparing pNFH levels versus C3 levels in the CSF of each subject. Most control subjects with high levels of C3 exhibit low levels of pNFH. The lines illustrate the thresholds cut-off values generated from the ROC curves in Figure 4. Increased sensitivity for ALS is generated by ALS cases that lie below pNFH=0.635 but above the pNFH/C3=0.000125 line.
We had survival data for 39 ALS subjects. A correlation (Pearson test R= −0.485, p= 0.016) was observed between pNFH levels and days from symptom onset to death (Figure 6). The date of symptom onset was determined retrospectively by patient report. There were 6 bulbar onset patients included in this analysis, and removal of these typically more rapidly progressive ALS patients did not alter the statistical results. This result suggests that pNFH levels in the CSF are a candidate prognostic biomarker. One limb onset ALS patient with a slow progressive form of the disease for which symptoms were confined to one hand had the longest survival, this patient had a low pNFH level.
Figure 6.

An inverse correlation was seen between CSF pNFH levels and survival from symptom onset (days). Pearson correlation test (R = −0.485, p = 0.016).
While CSF is an excellent biofluid for biomarker discovery efforts due to its proximity to the affected nervous system tissue, it presents practical difficulties for diagnostics in terms of acquisition and potential risks to the patient. While C3 levels have previously been examined in the blood, only a recent study has examined pNFH levels in the plasma of a few ALS patients (Boylan et al. 2009). Therefore, we examined matching blood plasma samples to determine if similar pNFH alterations were seen in plasma. With a sample size of 61 subjects, we detected a significant increase (p<0.05) using a one-way ANOVA with Dunn’s multiple comparison test in pNFH level when comparing ALS versus HC (Figure 7a). By Mann Whitney t-test, we noted significant differences in plasma pNFH levels between ALS and healthy controls (p = 0.01). However, we found no significant difference between ALS and neurologic disease controls (Mann Whitney t-test, p = 0.33). The median levels of pNFH detected in each subject group were 0.052 ng/ml for HC, 0.067 ng/ml for DC, and 0.08 ng/ml for ALS. We also directly compared pNFH levels between the CSF and plasma for each individual subject. We found a weak correlation between the plasma and CSF pNFH levels within individuals (Pearson correlation R2 = 0.18, p < 0.001 (Figure 7b)). Interestingly, we observed individuals with significant pNFH in the plasma but very little pNFH in the CSF. Likewise, we observed individuals with significant pNFH in the CSF (ALS patients) with little or absent pNFH in their plasma (Fig. 7b). Overall, the significant differences observed between ALS and neurologic disease controls for pNFH in the CSF were not maintained in the plasma samples.
Figure 7.

(a) Scatter plot of plasma pNFH levels for each subject groups. There was significant increase in plasma pNFH (p<0.05) as determined by one-way ANOVA with Dunns’s multiple comparison test. (b) Scatter plot comparing plasma and CSF pNFH levels for each subject demonstrate correlation. Pearson correlation test (R2 = 0.18, p <0.001).
Discussion
We measured levels of cytoskeletal and inflammatory proteins in the CSF of patients with ALS, other disease controls and healthy subjects. Using cut-off values obtained from a training set, the pNFH/C3 ratio provided 96% sensitivity and 90% specificity in a separate test set. Phosphorylated neurofilament heavy chain (pNFH) was able to distinguish ALS from both disease and healthy controls with 87.7% sensitivity and 93.7% specificity. A combination of pNFH and pNFH/C3 generated an overall 87.7% sensitivity and 94.6% specificity across all 163 subjects. Survival data on 39 ALS cases demonstrated a moderate correlation between CSF pNFH levels and patient survival, implicating the potential of pNFH as a prognostic marker. This finding is consistent with an earlier study although larger numbers are required to validate this finding (Brettschneider et al. 2006).
We utilized a large number of disease control subjects covering a range of pathogenic conditions, including 14 ALS mimics that often are not easily distinguished based on clinical symptoms. In this study, 12 of the 14 ALS mimics were distinguished from ALS using the rule combining pNFH and pNFH/C3. We also used two separate sets of CSF samples collected at two different medical centers using standardized sample collection and storage procedures to minimize artifacts generated during the collection process.
Neurofilament heavy chain belongs to a family of intermediate filament proteins that form a major part of the neuronal cytoskeleton. Phosphorylated NFH is found in axons and is associated with slowing of neurofilament transport and expansion of the axonal caliber (Ackerley et al. 2003). In ALS, however, phosphorylated neurofilament aggregates are seen within the perikaya and proximal axons of motor neurons. Furthermore, deletion/insertion mutations within the multiphosphorylation domain of NFH have been identified in approximately 1% of sporadic ALS cases (Al-Chalabi et al. 1999). We suggest that determining the stoichiometry of NFH in the CSF during a human disease may be relevant to monitoring disease progression as tight regulation of NFH stoichiometry is needed to prevent NFH aggregrate formation and axonal degeneration. We hypothesize that pNFH is released into the interstitial fluid compartment during axonal injury/disintegration and accumulates in the CSF. We detected higher levels of pNFH in the CSF of ALS patients versus other neurodegenerative diseases, including Alzheimer’s disease, Parkinson’s disease and FTD without motor involvement. We postulate that differences between neurodegenerative diseases reflect the differences in the underlying neuronal cell type affected by each disorder. The axonal content of motor neurons is much larger than that of hippocampal pyramidal neurons or substantial nigral neurons and therefore the pNFH levels detected in the CSF upon neuronal injury or degeneration are reflective of this difference of total pNFH content between the neuronal subtypes. Consistent with this hypothesis, pNFH levels are highest in the spinal cord and brain stem when compared to various cortical and subcortical brain regions (Anderson et al. 2008).
Phosphorylated neurofilament protein analysis has been examined in a variety of neurological conditions. Brettschneider et al measured pNFH levels in 69 patients with ALS, 73 Alzheimer’s disease (AD) and 33 control subjects (Brettschneider et al. 2006). CSF levels of pNFH in ALS were five times higher than in the control groups, and the median pNFH level in ALS was similar to that observed in our study. pNFH levels were higher in those patients in whom upper-motor neuron signs predominated and who had a more rapid disease progression, but they failed to include ALS disease mimics, limiting analysis of its diagnostic specificity (Brettschneider et al. 2006). Rejin et al measured pNFH levels in 32 ALS patients and 26 ALS mimic disorders and found mean CSF levels of 781ng/l in ALS versus 338ng/l in ALS mimics (Reijn et al. 2009). The mean levels in ALS are lower than Brettschneider et al (2006) and the results reported here. Our data supports future prospective studies of CSF pNFH levels to determine its clinical utility (Reijn et al. 2009).
Furthermore, increased levels of pNFH have been detected in the CSF of multiple sclerosis (MS) (Teunissen et al. 2009) and serum of Leber Hereditary Optic Neuropathy patients (Guy et al. 2008) as well as other neurological conditions including traumatic brain injury (Anderson et al. 2008) and subarachnoid haemorrhage (Lewis et al. 2008). High levels of CSF pNFH and NFH were previously observed in a subset of FTD patients (Pijnenburg et al. 2007). We failed to detect elevated levels of pNFH in the CSF of our FTD patients that lacked motor involvement. These results suggest that increased pNFH in the CSF of FTD patients may correlate to motor neuron axonal damage/injury and may lead to subsequent motor neuron disease symptoms in these patients. Further longitudinal studies are necessary to explore this possibility.
A recent study of 20 patients and 20 healthy controls using a pNFH ELISA demonstrated increased plasma levels in ALS and a correlation with the rate of disease progression (Boylan et al. 2009). Using the same ELISA, we observed a statistically significant increase in plasma pNFH in ALS patients compared to healthy control subjects, but not between ALS and disease control groups. There was a weak correlation between plasma and CSF levels from the same individual, though absolute levels of pNFH detected in the blood are substantially less than that in the CSF. The lack of strong correlation suggests that pNFH accumulation in the blood may be limited by many factors, including protein aggregation, degradation and/or dilution by the blood volume. We observed that a few control subjects exhibited high levels of pNFH in the blood but very low levels in their CSF. Further studies are required to further explore the relationship between CSF and blood levels of pNFH and to further optimize detection of pNFH in the blood.
There is evidence for the involvement of the complement system in a range of neurodegenerative conditions including ALS (Rus and Niculescu 2001; McGeer and McGeer 2004). Many proteins contributing to inflammation and/or the innate immune system may be elevated irrespective of the primary insult, and may exhibit high levels in infectious diseases or autoimmune conditions. Prior studies have shown elevated tissue levels of C3c in tissue and CSF of ALS patients (Annunziata and Volpi 1985; Kawamata et al. 1992; Goldknopf et al. 2006). The complement system is part of the innate immune system. It can be activated via the classical, alternative and lectin pathways. However, all three share the activation of complement C3. Our study supports further investigation into the complement system and C3 in the pathophysiology of ALS. By incorporating C3 as a denominator, the ratio of pNFH/C3 effectively represents axonal degeneration versus CNS inflammation. This allows us to generate a cut-off threshold providing greater sensitivity than pNFH alone with minimal loss of specificity. Recently, Sussmuth and colleagues reported that a ratio of soluble CD14 to S100beta levels in the CSF might provide a prognostic indicator for ALS (Sussmuth et al. 2010). Our studies further suggest that the combination of markers from neuronal and glial origins may provide improved diagnostic and/or prognostic information on ALS patients.
There have been conflicting reports with regards to tau as a candidate biomarker for ALS (Sussmuth et al. 2001; Paladino et al. 2009). We did not find statistically significant alterations in total tau between ALS and controls. This may reflect differences in the subcellular distributions of these cytoskeletal proteins in motor neurons. It is also plausible that the tau aggregation state affects measurements with the ELISA kit used in this study. We used the same commercial kit as Paladino et al. (2009), who also detected no significant differences between ALS and controls. Reports demonstrating statistically significant differences between ALS and controls used a different commercial tau ELISA kit with different capture and detection antibodies.
Further validation studies are required to replicate our findings. Large numbers of disease mimic samples are necessary to determine the specificity of any potential biomarker. To accomplish this task, internationally agreed upon standards for sample collection and storage are required to obtain reproducible data from different laboratories and permit sharing of crucial biofluids samples across studies (Sherman et al. 2010).
In summary, we examined cytoskeletal and inflammatory proteins as candidate biomarkers to distinguish ALS from disease controls and healthy subjects. A rule combining pNFH and complement C3 levels was established and provided an overall sensitivity of 87.7% and specificity of 94.6% for detecting ALS. C3 increases the specificity of the assay by incorporating inflammation within the variables that exist in ALS and other neurological disorders. While plasma levels of pNFH were significantly different between ALS and healthy control subjects, we did not detect significant differences between ALS and neurologic disease controls. We also observed weak correlations between CSF and plasma levels of pNFH within the same individuals, suggesting that CSF may provide the optimal biofluid for diagnostic utility of pNFH measurements for ALS. Future prospective studies incorporating pNFH and pNFH/C3 analysis of CSF will establish the diagnostic accuracy and clinical utility of these biomarkers.
Acknowledgements
We thank Dr. Merit Cudkowicz for providing cerebrospinal fluid samples from Massachusetts General Hospital. Funding support was provided by Guys and St. Thomas Charity to JG, National Institutes of Health grant NS061867 to RB, and funding from the ALS Association to GS. RB is a co-Founder of Knopp Neurosciences, a biotechnology company pursuing drug treatments for ALS. GS holds equity in EnCor Biotechnology Inc., a company commercializing neurofilament antibodies and assays used in this study. Finally, the authors thank all the subjects that participated in this research study.
References
- Ackerley S, Thornhill P, Grierson AJ, Brownlees J, Anderton BH, Leigh PN, Shaw CE, Miller CC. Neurofilament heavy chain side arm phosphorylation regulates axonal transport of neurofilaments. J Cell Biol. 2003;161:489–495. doi: 10.1083/jcb.200303138. [DOI] [PMC free article] [PubMed] [Google Scholar]
- Al-Chalabi A, Andersen PM, Nilsson P, Chioza B, Andersson JL, Russ C, Shaw CE, Powell JF, Leigh PN. Deletions of the heavy neurofilament subunit tail in amyotrophic lateral sclerosis. Human Mol Genet. 1999;8:157–164. doi: 10.1093/hmg/8.2.157. [DOI] [PubMed] [Google Scholar]
- Anderson KJ, Scheff SW, Miller KM, Roberts KN, Gilmer LK, Yang C, Shaw G. The phosphorylated axonal form of the neurofilament subunit NF-H (pNF-H) as a blood biomarker of traumatic brain injury. J Neurotrauma. 2008;25:1079–1085. doi: 10.1089/neu.2007.0488. [DOI] [PMC free article] [PubMed] [Google Scholar]
- Annunziata P, Volpi N. High levels of C3c in the cerebrospinal fluid from amyotrophic lateral sclerosis patients. Acta Neurol Scand. 1985;72:61–64. doi: 10.1111/j.1600-0404.1985.tb01548.x. [DOI] [PubMed] [Google Scholar]
- Bowser R, Lacomis D. Applying proteomics to the diagnosis and treatment of ALS and related diseases. Muscle Nerve. 2009;40:753–762. doi: 10.1002/mus.21488. [DOI] [PMC free article] [PubMed] [Google Scholar]
- Boylan K, Yang C, Crook J, Overstreet K, Heckman M, Wang Y, Borchelt D, Shaw G. Immunoreactivity of the phosphorylated axonal neurofilament H subunit (pNF-H) in blood of ALS model rodents and ALS patients: evaluation of blood pNF-H as a potential ALS biomarker. J Neurochem. 2009;111:1182–1191. doi: 10.1111/j.1471-4159.2009.06386.x. [DOI] [PubMed] [Google Scholar]
- Brettschneider J, Petzold A, Submuth SD, Ludolph AC, Tumani H. Axonal damage markers in cerebrospinal fluid are increased in ALS. Neurology. 2006;66:852–856. doi: 10.1212/01.wnl.0000203120.85850.54. [DOI] [PubMed] [Google Scholar]
- Brooks BR. El Escorial World Federation of Neurology criteria for the diagnosis of amyotrophic lateral sclerosis. J Neurol Sci. 1994;124:96–107. doi: 10.1016/0022-510x(94)90191-0. [DOI] [PubMed] [Google Scholar]
- Ganesalingam J, Bowser R. The application of biomarkers in clinical trials for motor neuron disease. Biomarkers in Medicine. 2010;4:281–297. doi: 10.2217/bmm.09.71. [DOI] [PMC free article] [PubMed] [Google Scholar]
- Gelinas D. Conceptual approach to diagnostic delay in ALS: a United States perspective. Neurology. 1999;53:S17–S19. [PubMed] [Google Scholar]
- Goldknopf IL, Sheta EA, Bryson J, Folsom B, Wilson C, Duty J, Yen AA, Appel SH. Complement C3c and related protein biomarkers in amyotrophic lateral sclerosis and Parkinson's disease. Biochem Biophys. Res. Commun. 2006;342:1034–1039. doi: 10.1016/j.bbrc.2006.02.051. [DOI] [PubMed] [Google Scholar]
- Guy J, Shaw G, Ross-Cisneros FN, Quiros P, Salomao SR, Berezovsky A, Carelli V, Feuer WJ, Sadun AA. Phosphorylated neurofilament heavy chain is a marker of neurodegeneration in Leber hereditary optic neuropathy (LHON) Mol Vision. 2008;14:2443–2450. [PMC free article] [PubMed] [Google Scholar]
- Haverkamp L, Appel V, Appel SH. Natural history of amyotrophic lateral sclerosis in a database population. Validation of a scoring system and a model for survival prediction. Brain. 1995;118:707–719. doi: 10.1093/brain/118.3.707. [DOI] [PubMed] [Google Scholar]
- Kawamata T, Akiyama H, Yamada T, McGeer PL. Immunologic reactions in amyotrophic lateral sclerosis brain and spinal cord tissue. Am J Pathol. 1992;140:691–707. [PMC free article] [PubMed] [Google Scholar]
- Kuhle J, Lindberg RL, Regeniter A, Mehling M, Steck AJ, Kappos L, Czaplinski A. Increased levels of inflammatory chemokines in amyotrophic lateral sclerosis. Eur J Neurol. 2009;16:771–774. doi: 10.1111/j.1468-1331.2009.02560.x. [DOI] [PubMed] [Google Scholar]
- Lewis SB, Wolper RA, Miralia L, Yang C, Shaw G. Detection of phosphorylated NF-H in the cerebrospinal fluid and blood of aneurysmal subarachnoid hemorrhage patients. J Cereb Blood Flow Metab. 2008;28:1261–1271. doi: 10.1038/jcbfm.2008.12. [DOI] [PubMed] [Google Scholar]
- Mares J, Kanovsky P, Herzig R, Stejskal D, Vavrouskova J, Hlustik P, Vranova H, Burval S, Zapletalova J, Pidrman V, Obereigneru R, Suchy A, Vesely J, Podivinsky J, Urbanek K. The assessment of beta amyloid, tau protein and cystatin C in the cerebrospinal fluid: laboratory markers of neurodegenerative diseases. Neurol Sci. 2009;30:1–7. doi: 10.1007/s10072-008-0005-7. [DOI] [PubMed] [Google Scholar]
- McGeer PL, McGeer EG. Inflammation and neurodegeneration in Parkinson's disease. Parkinsonism Relat Disord. 2004;10:S3–S7. doi: 10.1016/j.parkreldis.2004.01.005. [DOI] [PubMed] [Google Scholar]
- Mitchell RM, Freeman WM, Randazzo WT, Stephens HE, Beard JL, Simmons Z, Connor JR. A CSF biomarker panel for identification of patients with amyotrophic lateral sclerosis. Neurology. 2009;72:14–19. doi: 10.1212/01.wnl.0000333251.36681.a5. [DOI] [PubMed] [Google Scholar]
- Morita H, Suzuki K, Mori N, Yasuhara O. Occurrence of complement protein C3 in dying pyramidal neurons in rat hippocampus after systemic administration of kainic acid. Neurosci Lett. 2006;409:35–40. doi: 10.1016/j.neulet.2006.09.037. [DOI] [PubMed] [Google Scholar]
- Paladino P, Valentino F, Piccoli T, Piccoli F, La Bella V. Cerebrospinal fluid tau protein is not a biological marker in amyotrophic lateral sclerosis. Eur J Neurol. 2009;16:257–261. doi: 10.1111/j.1468-1331.2008.02405.x. [DOI] [PubMed] [Google Scholar]
- Petzold A, Thompson EJ, Keir G, Quinn N, Holmberg B, Dizdar N, Wenning GK, Rascol O, Tolosa E, Rosengren L. Longitudinal one-year study of levels and stoichiometry of neurofilament heavy and light chain concentrations in CSF in patients with multiple system atrophy. J Neurol Sci. 2009;279:76–79. doi: 10.1016/j.jns.2008.12.037. [DOI] [PubMed] [Google Scholar]
- Pijnenburg YAL, Janssen JC, Schoonenboom NSM, Petzold A, Mulder C, Stigbrand T, Norgren N, Heijst H, Hack CE, Scheltens P, Teunissen CE. CSF neurofilaments in frontotemporal dementia compared with early onset Alzheimer's disease and controls. Dement Geriatr Cogn Disord. 2007;23:225–230. doi: 10.1159/000099473. [DOI] [PubMed] [Google Scholar]
- Ranganathan S, Williams E, Ganchev P, Gopalakrishnan V, Lacomis D, Urbinelli L, Newhall K, Cudkowicz M, Brown RH, Bowser R. Proteomic profiling of cerebrospinal fluid identifies biomarkers for amyotrophic lateral sclerosis. J Neurochem. 2005;95:1461–1471. doi: 10.1111/j.1471-4159.2005.03478.x. [DOI] [PMC free article] [PubMed] [Google Scholar]
- Reijn TS, Abdo WF, Schelhaas HJ, Verbeek MM. CSF neurofilament protein analysis in the differential diagnosis of ALS. J Neurol. 2009;256:615–619. doi: 10.1007/s00415-009-0131-z. and 256:615–619 J. N. [DOI] [PubMed] [Google Scholar]
- Rothstein JD. Current hypotheses for the underlying biology of amyotrophic lateral sclerosis. Ann Neurol. 2009;65:S3–S9. doi: 10.1002/ana.21543. [DOI] [PubMed] [Google Scholar]
- Rus H, Niculescu F. The complement system in central nervous system diseases. Immunol Res. 2001;24:79–86. doi: 10.1385/IR:24:1:79. [DOI] [PubMed] [Google Scholar]
- Ryberg H, Bowser R. Protein biomarkers for amyotrophic lateral sclerosis. Expert Rev Proteomics. 2008;5:249–262. doi: 10.1586/14789450.5.2.249. [DOI] [PubMed] [Google Scholar]
- Sherman A, Bowser R, Grasso D, Power B, Milligan C, Jaffa M, Cudkowicz M. Proposed BioRepository platform solution for the ALS research community. Amyotrophic Lateral Sclerosis. doi: 10.3109/17482968.2010.539233. posted on-line Dec 6, 2010. [DOI] [PubMed] [Google Scholar]
- Strong MJ, Kesavapany S, Pant HC. The pathobiology of amyotrophic lateral sclerosis: A proteinopathy? J Neuropathol Exp Neurol. 2005;64:649–664. doi: 10.1097/01.jnen.0000173889.71434.ea. [DOI] [PubMed] [Google Scholar]
- Sussmuth SD, Reiber H, Tumani H. Tau protein in cerebrospinal fluid (CSF): a blood-CSF barrier related evaluation in patients with various neurological diseases. Neurosci Lett. 2001;300:95–98. doi: 10.1016/s0304-3940(01)01556-7. [DOI] [PubMed] [Google Scholar]
- Sussmuth SD, Tumani H, Ecker D, Ludolph AC. Amyotrophic lateral sclerosis: disease stage related changes of tau protein and S100 beta in cerebrospinal fluid and creatine kinase in serum. Neurosci Lett. 2003;353:57–60. doi: 10.1016/j.neulet.2003.09.018. [DOI] [PubMed] [Google Scholar]
- Sussmuth SD, Sperfeld AD, Hinz A, Brettschneider J, Endruhn S, Ludolph AC, Tumani H. CSF glial markers correlate with survival in amyotrophic lateral sclerosis. Neurology. 2010;74:982–987. doi: 10.1212/WNL.0b013e3181d5dc3b. [DOI] [PubMed] [Google Scholar]
- Teunissen CE, Lacobaeus E, Khademi M, Brundin L, Norgren N, Koel-Simmelink MJ, Schepens M, Bouwman F, Twaalfhoven HA, Blom HJ, Jakobs C, Dijkstra CD. Combination of CSF N-acetylaspartate and neurofilaments in multiple sclerosis. Neurology. 2009;72:1322–1329. doi: 10.1212/WNL.0b013e3181a0fe3f. [DOI] [PubMed] [Google Scholar]
- Wild EJ, Petzold A, Keir G, Tabrizi SJ. Plasma neurofilament heavy chain levels in Huntington's disease. Neurosci Lett. 2007;417:231–233. doi: 10.1016/j.neulet.2007.02.053. [DOI] [PubMed] [Google Scholar]
- Wolbink GJ, Brouwer MC, Buysmann S, ten Berge IJ, Hack CE. CRP-mediated activation of complement in vivo: assessment by measuring circulating complement-C-reactive protein complexes. J Immunol. 1996;157:473–479. [PubMed] [Google Scholar]
- Wong NK, He BP, Strong MJ. Characterization of neuronal intermediate filament protein expression in cervical spinal motor neurons in sporadic amyotrophic lateral sclerosis (ALS) J Neuropathol Exp Neurol. 2000;59:972–982. doi: 10.1093/jnen/59.11.972. [DOI] [PubMed] [Google Scholar]
- Woodruff TM, Costantini KJ, Crane JW, Atkin JD, Monk PN, Taylor SM, Noakes PG. The complement factor C5a contributes to pathology in a rat model of amyotrophic lateral sclerosis. J Immunol. 2008;181:8727–8734. doi: 10.4049/jimmunol.181.12.8727. [DOI] [PubMed] [Google Scholar]
- Yasojima K, Schwab C, McGeer EG, McGeer PL. Up-regulated production and activation of the complement system in Alzheimer's disease brain. Am J Pathol. 1999;154:927–936. doi: 10.1016/S0002-9440(10)65340-0. [DOI] [PMC free article] [PubMed] [Google Scholar]