Abstract
The triangularis sterni (TS) is an expiratory muscle that is passively stretched during inspiration. The magnitude of passive stretch depends upon the location of individual fibers within the TS muscle, with fibers located more caudally being stretched approximately 5 to 10 % more than fibers in the cephalad region. In the mdx mouse model for muscular dystrophy, the TS exhibits severe pathological alterations that are ameliorated by treatment with inhibitors of the NF-κB pathway. The purpose of this study was to assess the influence of passive stretch in vivo on fiber morphology in nondystrophic and mdx TS muscles, and the morphological benefits of treating mdx mice with two distinct NF-κB inhibitors, pyrrolidine dithiocarbamate (PDTC) and ursodeoxycholic acid (UDCA). Transmission electron microscopy revealed Z-line streaming, hypercontraction, and disassociation of the plasma membrane from the basal lamina in mdx fibers. In both nondystrophic and mdx TS muscles, fiber density was larger in more caudal regions. In comparison to nondystrophic TS, fibers in the mdx TS exhibited substantial reductions in diameter throughout all regions. In vivo treatment with either PDTC or UDCA tended to increase fiber diameter in the middle and decrease fiber diameter in the caudal TS, while reducing centronucleation in the middle region. These results suggest that passive stretch induces hypercontraction and plasma membrane abnormalities in dystrophic muscle, and that differences in the magnitude of passive stretch may influence fiber morphology and the actions of NF-κB inhibitors on dystrophic morphology.
Keywords: Duchenne muscular dystrophy, mdx mouse, NF-κB inhibitors, respiratory muscles, Becker muscular dystrophy
Introduction
Skeletal muscle fibers from the mdx mouse and from patients with Duchenne muscular dystrophy exhibit increased nuclear activation of NFκB (Kumar and Boriek, 2003; Monici et al., 2003; Acharyya et al., 2007; Singh et al.; 2009), a ubiquitous transcription factor that regulates the expression of several pro-inflammatory and pro-survival genes (Siebenlist et al., 1994; Barnes, 1997; Hayden and Ghosh 2004). Pyrrolidine dithiocarbamate (PDTC) stabilizes cytosolic levels of IκB-α and reduces the steady state nuclear levels of NF-κB (Cuzzocrea et al. (2002). In addition to its action as an anti-oxidant, PDTC inhibits a ubiquitin ligase that is required for the subsequent proteasomal degradation of IκB-α (Hayakawa et al., 2003). Previous experiments in this laboratory indicated that a single in vivo injection of PDTC increased cytosolic IκB-α in mdx skeletal muscle, and that long term treatment enhanced the survival of striated muscle fibers and improved the resting membrane potential in mdx triangularis sterni (TS) muscle fibers (Carlson et al., 2005). A subsequent study showed that administration of PDTC and another NF-κB inhibitor, ursodeoxycholic acid (UDCA), improved limb muscle function (Siegel et al. 2009). Evidence from mammalian cell lines indicates that UDCA inhibits nuclear NF-κB activation by binding to the glucocorticoid receptor and ultimately inhibiting p65 transactivation without promoting the expression of glucocorticoid-responsive genes (Miura et al., 2001). These results indicate that diverse agents that inhibit the NF-κB pathway have beneficial effects in treating dystrophic muscle.
The TS is a respiratory muscle that is particularly useful in assessing the influence of signal transduction modulators on dystrophic morphology because of its unique history of chronic passive stretch during inspiration and contractile activation during expiration (DeTroyer and Ninane, 1986; Hwang et al., 1989; De Troyer and Legrand, 1998; DeTroyer et al., 1998). Unlike limb muscles which are intermittently activated, the respiratory musculature has a highly patterned history of regular and consistent activation. This characteristic is quite useful in assessing the influence of agents which modulate specific signaling pathways that are themselves affected by contractile activity or passive stretch. Based on this important consideration, the purpose of the present study was to further assess the degree of pathology in adult mdx TS muscle (Carlson et al., 2003) and characterize the influence of the two diverse NF-κB inhibitors, PDTC and UDCA, on adult mdx TS muscle fiber morphology.
The results provide the first evidence that both nondystrophic and mdx TS muscles exhibit specific regional differences in fiber diameter, fiber cross-sectional area, and fiber density that may be associated with differences in the magnitude of passive stretch that is applied to individual muscle fibers during normal use. Transmission electron microscopic images also suggest that long term passive stretch of dystrophic muscle induces severe hypercontraction and adjacent end-stage empty fiber remnants where the plasma membrane dissociates from the basal lamina. The results further show that in vivo treatment with two very different NF-κB inhibitors, PDTC and UDCA, produced similar effects on mdx TS fiber diameter and centronucleation. These results establish the utility of the mdx TS for assessing drug efficacy, and suggest that differences in passive stretch may affect fiber growth, and the therapeutic outcome of treatment with NF-κB inhibitors.
Materials and Methods
Animal Studies
Mdx (C57Bl10SnJ-mdx) and nondystrophic (C57BL/10SnJ) mice were obtained from Jackson laboratories (Bar Harbour, ME) and bred in local animal facilities under conditions that were approved by Institutional Animal Care and Use Committee (IACUC) in accordance with the guidelines of the National Institutes of Health, US Department of Agriculture, and the American Association for the Accreditation of Laboratory Animal Care. Mice were euthanized by cervical dislocation following either CO2 inhalation or pentobarbital-induced (50 to 100 mg/kg) anesthesia. All experiments were reviewed by the IACUC and were conducted in accordance with NIH guidelines.
PDTC treatment
Two age groups of mdx mice received daily intraperitonal (ip) injections of 50 mg/kg pyrollidine dithiocarbamate (PDTC; Sigma P8765) dissolved in HEPES-Ringer solution (147.5 mM NaCl, 5 mM KCl, 2 mM CaCl2, 11 mM glucose, 5 mM Hepes, pH 7.35) or HEPES–Ringer solution alone (vehicle) as previously described (Carlson et al., 2005; Siegel et al., 2009). The first studies were conducted on age- and gender-matched vehicle and drug-treated mature adult mdx mice (15 to 20 months of age) that were treated for a period of 2 months. TS muscles from mdx mice older than 15 months of age exhibit severe dystrophic pathology (fiber diameter, fiber density, percent centronucleation) that is constant with age. To assess whether age may influence drug efficacy, a second smaller study was conducted on young adult (30 day old) mdx mice that were treated daily with PDTC for 1 month.
UDCA treatment
Young adult mdx mice (1 month of age) were treated daily with 40 mg/kg UDCA (ip) in an isotonic saline (1.02% NaCl, pH 8.4) for 1 month as previously described (Siegel et al., 2009). Corresponding saline-treated mdx mice served as controls.
Paraffin-embedded sections
The TS muscles were isolated using the techniques described in Carlson et al. (2003). Isolated TS muscles were maintained at approximate resting length, and rinsed several times with HEPES Ringer solution before being fixed in 2% glutaraldehyde (Sigma G7526 in 0.1 M cacodylate buffer) for at least 6 hours. After removing the fixative, the muscles were rinsed with 0.1 M cacodylate buffer and cut into three roughly equivalent pieces representing the cephalad, middle and caudal thirds of the TS. The tissues were dehydrated in ethanol, cleared in xylene (Sigma # 295884), and infiltrated and embedded with paraffin (Paraplast Xtra; McCormick Scientific). Embedded specimens were oriented to obtain 5 μm cross sections of the TS fibers (Shandon Hypercut rotary microtome). Sections were stained with Mayers hematoxylin (Sigma MHS32) and Eosin B (Sigma 861006; 71.25% EtOH), mounted in Permount (Fisher Scientific SP15), and photographed using either a Leitz Ortholux or Leica DM2000 microscope. At least 10 serial cross sections were routinely obtained from each block at 3 to 10% of the distance between the sternum and costal insertions, and the single best (most clearly and well-embedded) section was chosen for all subsequent analyses.
Plastic embedded specimens and transmission electron microscopy
Caudal TS preparations were fixed in 2.0% gluteraldehyde in 0.133 M phosphate buffer (1 hr, room temp), rinsed in 0.1 M phosphate buffer, and then postfixed in 2.0% OsO4 in 0.133 M phosphate buffer (1 hr, room temp). After rinsing again in 0.1 M phosphate buffer, specimens were dehydrated in an ethanol series, transferred through three changes of propylene oxide, and embedded in EMbed-812 (Electron Microscopy Sciences).
For light microscopy, 1um thick sections were stained with Richardson's stain (1 % azure II, 1 % methylene blue, 1 % sodium tetraborate in H2O). Light microscope images were captured using an InSight digital camera mounted on an Olympus BH2 compound microscope. For electron microscopy, thin sections were cut with a diamond knife and Leica Ultracut UCT ultramicrotome, stained with uranyl acetate and lead citrate, and examined with a Jeol JEM-100sx TEM. Images were captured using an AMT digital camera.
Morphometric Analyses
Digital images of H&E-stained, paraffin-embedded cross sections were analyzed using ImageJ (version 1.36) software (Abramoff et al., 2004).
Fiber Density
Overlapping low magnification images (obtained with 10×, NA 0.30 or 0.25) were combined using Adobe Photoshop to create a montage (e.g. Figure 1) of each muscle block. The length of the muscle in each section was determined with a staggered series of line segments which were drawn to visually bisect the muscle montage along its long axis. The total length of each sectioned muscle was defined as the sum of the lengths of the individual line segments. The density of fibers was defined as the total number of fibers observed in the muscle section divided by the total length of the muscle.
Figure 1.
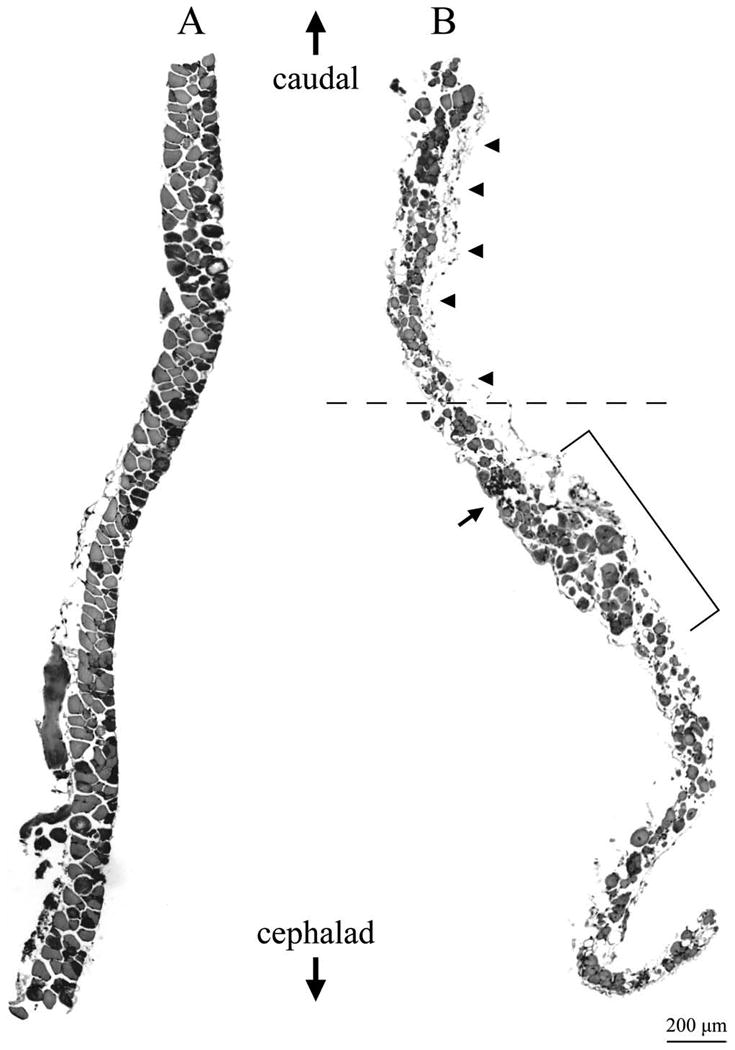
The middle region of the adult mdx TS muscle exhibits non-uniform fiber density and reduced fiber diameter associated with cellular infiltration and fibrosis. (A) Middle TS region from a 7 month old nondystrophic mouse. (B) Middle region of a 10 month mdx mouse. Calibration bar is 200 μm for each figure (lower right corner). Shown are montages of cross sections stained with H & E. In each case, the caudal limit of the middle region is at the top and the cephalad limit at the bottom of the figure. Note that the density of fibers in the nondystrophic middle TS uniformly increases towards the caudal limit (A) while the density of fibers in the mdx preparation (B) is highly irregular. Bracket in (B) shows an area of relatively high fiber density close to a region that completely lacks fibers (horizontal dashed line). The profiles of fiber cross sections are relatively uniform in the nondystrophic preparation (A). In contrast, the mdx middle TS (B) exhibits a preponderance of small diameter fibers with a few fibers that have diameters approaching those seen in the nondystrophic preparation. The middle mdx TS (B) also exhibits substantial fibrosis along the edge of the muscle (arrowheads) and areas of marked cellular infiltration (small arrow).
Fiber diameter
Fiber diameter was determined by individually outlining each fiber and determining the largest diameter along a fixed axis (Feret's diameter), and the minimal diameter across all axes (minor axis diameter; Briguet et al., 2004). Image J was also used to determine the cross sectional area and circularity (defined as 4π (area/perimeter2)) for each fiber.
Circularity
The potential effect of variations in the plane of section on the determination of fiber diameter was initially assessed by examining histograms and associated means of Feret's diameter for different ranges of circularity. In only one rare instance, mean fiber diameter was altered more than 10% by excluding circularities less than 0.9. In this case, the results from fiber profiles with circularities less than 0.9 were not included in determining the mean diameter. In later studies, only clearly circular fibers were selected for analyses and both Feret's diameter and the minimal diameter, which is less sensitive to variations in the plane of section, were routinely assessed. In general, the circularities for the fibers analyzed in these studies varied between 0.90 and 0.95 (i.e., 90 to 95% circular).
Centronucleation
Percent centronucleation was defined as the number of centrally located nuclei divided by the total number of nuclei. A centrally located nucleus was defined as being at least one nuclear diameter away from the plasma membrane.
Data analysis
In the PDTC studies, all of the individual muscle fibers for each available region of TS muscle were analyzed. In all other studies, a maximum number (100) of fibers were randomly selected for morphometric analyses for each muscle section. In preparations with fewer than 100 fibers available, all of the available circular fiber images were analyzed. All available images in each section were used to determine percent centronucleation.
Statistical analyses of fiber density and fiber diameter were conducted using N values derived from the number of preparations (mice) in each category. Weighted means and variances were used to calculate the preparation means and standard errors in cases where the number of samples varied between preparations. Statistical analyses of percent centronucleation were conducted using N values derived from the number of images analyzed in each category. Comparisons between variables obtained from the three regions of TS muscle (caudal, middle, cephalad) were analyzed using analyses of variance (ANOVA, Holm-Sidak post hoc test of comparisons). Comparisons between mdx and nondystrophic conditions or between vehicle and drug-treated conditions were analyzed by t test or by Mann-Whitney Rank Sums test (Sigmaplot v 11).
Results
The mdx TS muscle exhibits fiber loss, regeneration, cellular infiltration, hypercontraction, and fibrosis
The nondystrophic TS exhibits a rather uniform thickness ranging from about 3 or 4 fibers thick at the ends of the section to about 2 fibers thick in the center of the middle TS. The fibers were healthy in appearance and had relatively uniform diameters (Fig. 1A). In contrast, the middle region of the mdx TS was highly irregular with some areas appearing to be up to 5 or 6 fibers thick and other areas devoid of muscle fibers (Fig. 1B). Low power micrographs also revealed discrete areas of cellular infiltration and widespread fibrosis (Fig. 1B). Fiber cross sections in the middle mdx TS were highly variable, with the largest fiber diameters approaching those seen in nondystrophic muscle, but with most fibers exhibiting extremely small cross sectional profiles (Fig. 1B).
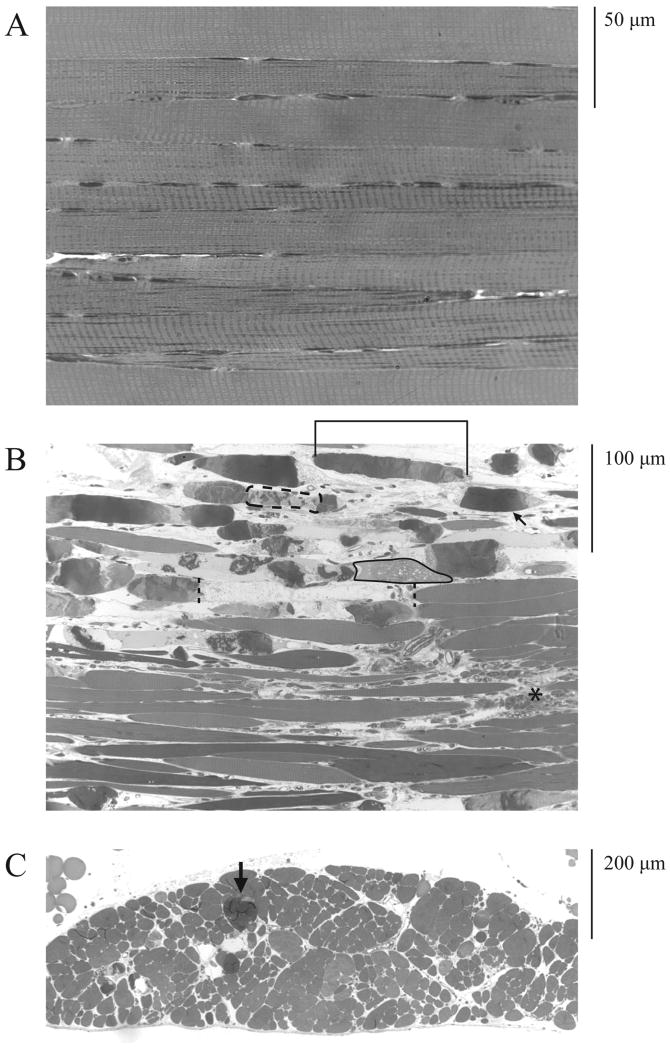
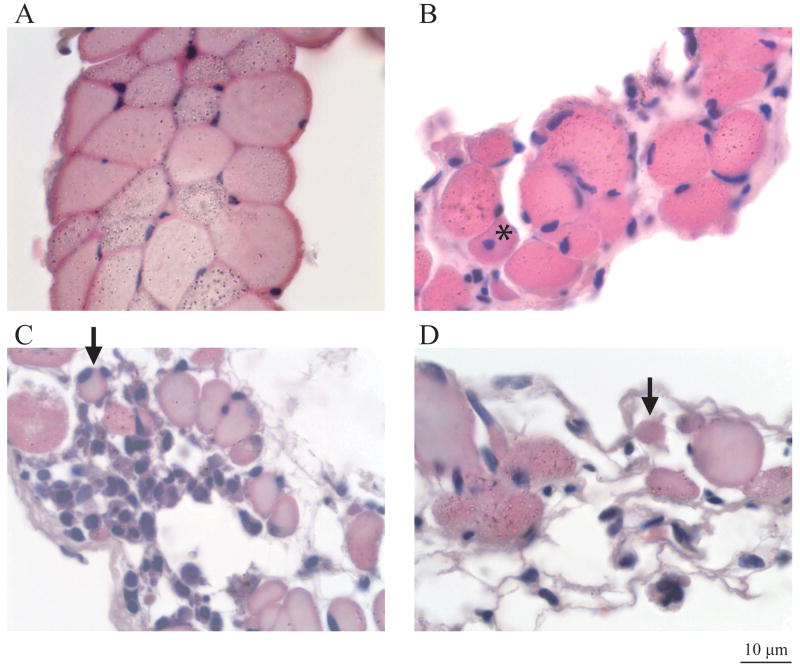
Longitudinal sections through the nondystrophic TS showed uniform-diameter striated fibers (Fig. 2A). In contrast, the mdx TS exhibited numerous hypercontracted fibers (Fig. 2B) and an increase in muscle mass in the caudal region (Fig. 2C) that was due to an increase in the density of muscle fibers. At higher magnification, the nondystrophic TS exhibited tightly packed and relatively uniform fiber cross sections (Fig. 3A). In contrast, the middle mdx TS showed extensive fibrosis between individual fibers (Fig. 3B), cellular infiltration (Fig. 3C), hypercontraction (Fig. 2B, C), and fiber loss (Fig. 3D).
Figure 2.
The mdx TS muscle is characterized by a preponderance of hypercontracted fibers, fibrosis, and substantial increases in fiber density in the caudal region. (A) Longitudinal section through a portion of the caudal TS of an adult nondystrophic mouse showing densely packed, well-striated fibers with relatively uniform diameters (calibration = 50 μm). (B) Longitudinal section through a portion of the caudal TS of an adult mdx mouse showing non-uniform fiber diameters, hypercontraction, and fibrosis (calibration bar = 100 μm). (C) Cross section through a portion of the caudal TS of an adult mdx mouse showing increased fiber density (calibration bar = 200 μm). Sections were embedded in Epon. Transverse sections through mdx caudal TS fibers (B) exhibit distinct hypercontraction (e.g., arrow), areas of nonuniform sarcoplasmic density with relatively dense areas adjacent to more rarefied areas (e.g., bracket), relatively empty areas that appear to lack sarcoplasm (e.g., between dashed vertical lines), areas of patchy hypercontraction (e.g., dashed oval), and areas of amorphous sarcoplasmic matrix exhibiting a “moth-eaten” appearance (e.g., encircled by solid line). Large areas of fibrosis are also seen between fibers (e.g., asterisk). Cross sections through the mdx caudal TS reveal areas of very high fiber density (C). Hypercontracted fibers are also seen in cross section (e.g., arrow, C).
Figure 3.
The middle region of the TS muscle in the mdx mouse exhibits substantial fibrosis, cellular infiltration, reduced fiber diameters, and centronucleation. (A) Cross section through the middle region of the nondystrophic TS showing uniform and packed fiber profiles. (B) Cross section through the middle region of a 10 month old mdx TS showing fibrosis, centronucleation (asterisk), and reduced fiber diameter. (C) Cross section through the middle region of another 10 month mdx TS showing a large area of cellular infiltration and several very small fiber profiles (e.g., arrow). (D) Cross section through the middle region of a 12 month mdx TS showing profound fiber loss, a few small diameter fibers (e.g., arrow), and a trabecular mesh of fiber remnants and fibrosis. All sections are stained with H & E. The total magnification is identical in each figure (calibration bar = 10 μm; lower right hand corner).
The mdx TS exhibits hypercontraction with adjacent remnants of empty sarcoplasm, and plasma membrane abnormalities
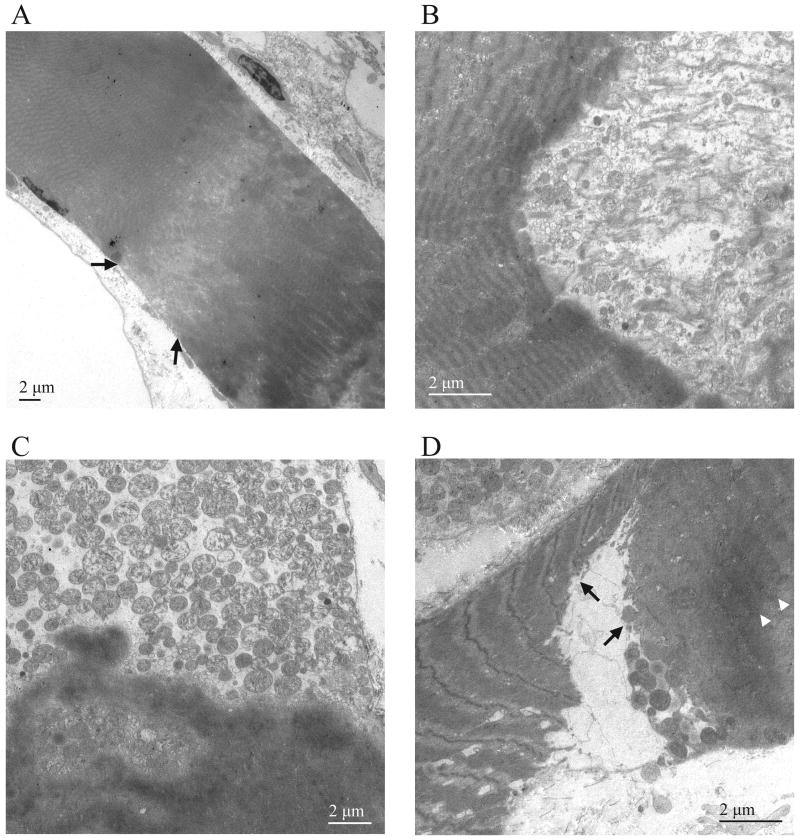
Further examination of hypercontracted fibers using transmission electron microscopy revealed amorphous areas of sarcoplasmic rarefaction adjacent to more dense sarcoplasmic areas (Fig. 4A). These relatively mild areas of hypercontraction lacked striations and were characterized by clumps of highly disorganized sarcoplasm (Fig. 4A). More discrete areas of hypercontraction were characterized by sharp boundaries separating dense sarcoplasmic plugs from relatively empty areas that were devoid of organized sarcoplasm (Fig. 4B,C; Fig. 2B). The empty areas contained either scattered filamentous structures which appeared to be diffuse remnants of myofibrils (Fig. 4B), or were packed with abnormal, swollen mitochondrial profiles (Fig. 4C). In some cases, adjacent areas of hypercontraction appeared to surround a central empty area (Fig. 4D).
Figure 4.
Hypercontraction of mdx TS muscle fibers. (A) Low power transmission electron micrograph of a fiber exhibiting relatively mild hypercontraction (calibration bar = 2 μm). Note the inhomogeneous sarcoplasmic density characterized by clumps of sarcoplasm adjacent to a region of sarcoplasmic rarefaction (between arrows). (B) Hypercontraction characterized by a concave hypercontraction “plug” adjacent to a markedly less dense area containing numerous fibrous structures that may represent detached sarcomere fragments (calibration bar = 2 μm). (C) Hypercontraction characterized by a more convex hypercontraction plug adjacent to a markedly less dense area that lacks fibrous structures but contains numerous mitochondria and sarcotubular elements (calibration bar = 2 μm). Note also the clumpy appearance of sarcoplasm on the more dense side of the hypercontraction plug. (D) Hypercontraction characterized by a triangular central area of low density adjacent to two contiguous dense sarcoplasmic areas (arrows; calibration bar = 2 μm). Note that the clumpy appearance of the dense area to the right lacks well-defined sarcomeres, and the more ordered dense region towards the left exhibits prominent Z line streaming (arrows). The less organized dense area to the right also exhibits faint bands of more dense material that suggest the presence of degenerating Z lines (arrowheads).
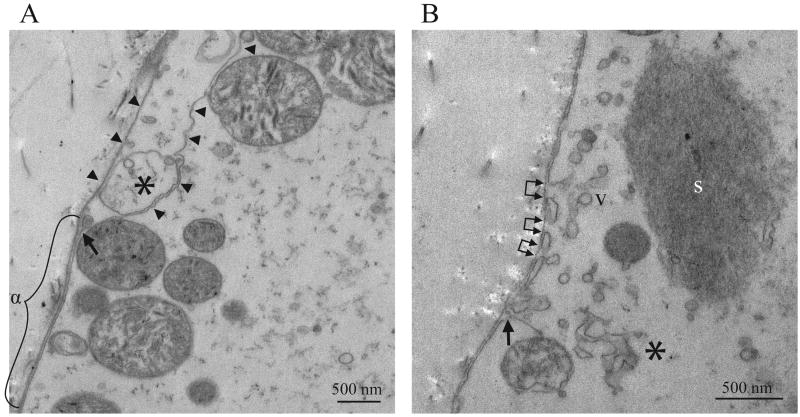
In areas devoid of organized sarcoplasm that were adjacent to hypercontracted areas, isolated portions of the plasma membrane were often extended inwards away from the continuous external basal lamina layer to form long membrane strands that projected towards the cell interior (Fig. 5A). This apparent stripping of the membrane was seen in association with the formation of internal and external vacuoles of assorted shapes and sizes (Fig. 5A, B). In addition, organelles resembling swollen mitochondria were seen in association with these large areas of membrane disruption. These areas of membrane stripping and vacuole formation were seen only in empty fiber areas devoid of any sarcomeric structure.
Figure 5.
Plasma membrane abnormalities occur in regions lacking sarcoplasm in mdx TS fibers. (A) Plasma membrane stripping in an empty sarcoplasmic area adjacent to a hypercontraction plug (calibration bar = 500 nm). Note that the sarcolemma and the basal lamina are closely apposed in the area marked “α” but then diverge, with the sarcolemma moving towards the interior of the cell (arrow). The sarcolemma and basal lamina form two long strands separated by approximately 500 nm through the remainder of the image (arrowheads). A large vacuole is also present between the sarcolemma and the basal lamina (asterisk) along with several organelles resembling mitochondria. (B) Vacuole formation and sarcolemmal disruptions in an empty sarcoplasmic area (calibration bar = 500 nm). Note the presence of discrete breaks in the sarcolemma (between connected pairs of arrowheads) that are adjacent to vacuoles and apposed to intact regions of basal lamina. Another area of sarcolemma is curling inwards (arrow). This region also includes a large density of vacuoles (e.g., v), larger more complex membranous elements (asterisk), and a more dense sarcoplasmic remnant (s).
The density and diameter of fibers in the TS are a function of position
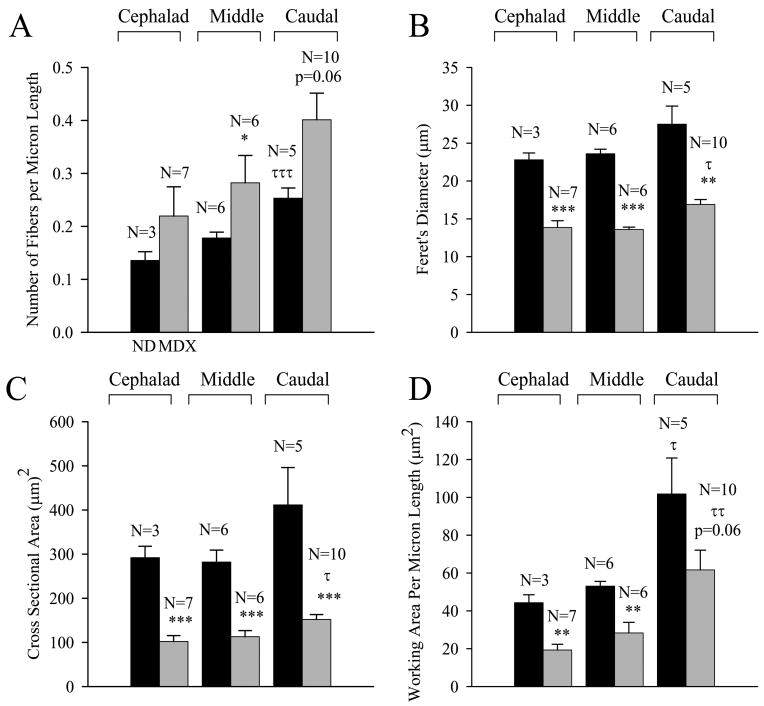
Adult (7- 10 mos) nondystrophic and mdx TS muscles exhibited similar regional differences in fiber density and diameter. In each case, the fiber density (Fig. 6A), Feret's diameter (Fig. 6B), average cross-sectional fiber area (Fig 6C), and total working area per unit length (fiber density × average cross sectional fiber area; Fig 6D) increased in the cephalad to caudal direction along the TS. Analyses of variance indicated a significant regional effect on fiber diameter in the mdx TS (Fig. 6B; τ − p<0.05, ANOVA, Holm-Sidak) and a similar statistical trend in nondystrophic TS. The fiber density (Fig 6A; τττ − p<0.001; ANOVA, Holm-Sidak) and the total working area per unit length of mdx TS muscle (Fig. 6D; ττ − p<0.01, ANOVA, Holm-Sidak) each exhibited significant cephalad to caudal gradients. Nondystrophic TS muscle also exhibited a significant cephalad to caudal gradient in working area per unit length (Fig. 6D; τ, p<0.05, ANOVA, Holm-Sidak) and a similar gradient in fiber density that just failed to reach significance (Fig. 6A; p=0.06, ANOVA).
Figure 6.
Morphometric comparisons between untreated adult nondystrophic and mdx TS muscles. (A) Regional differences in fiber density (number of fibers per μm length TS) in nondystrophic (black histobars) and mdx (gray histobars) TS muscles. Note the cephalad to caudal gradient in density for the mdx preparations (τττ − p<0.001) and the increase in fiber density for the middle region of mdx TS muscles (* - p<0.05). (B) Regional differences in Feret's diameter (μm) in nondystrophic (black) and mdx (gray) TS muscles. Note the cephalad to caudal gradient in diameter for the mdx preparations (τ − p<0.05) and the reduction in diameter for all regions of the mdx TS muscle (** - p<0.01; *** - p<0.001). (C) Regional differences in fiber cross sectional area (μm2) in nondystrophic (black) and mdx (gray) mice. Note the cephalad to caudal gradient in fiber cross sectional area for mdx mice (τ − p<0.05) and the reduction in fiber cross sectional area in all regions of the mdx TS (*** - p<0.001). (D) Regional differences in total working area (μm2) per micron length of TS for both nondystrophic (black) and mdx (gray) mice. Note the cephalad to caudal gradient in working area for both preparations (τ - p<0.05, ττ − p<0.01) and the decrease in working area in the middle and cephalad regions of the mdx TS (** - p<0.01). N equals the number of preparations (mice).
Mdx TS muscles exhibit elevated fiber densities and reduced fiber diameters
The fiber density in the middle mdx TS was significantly greater (Fig. 6A; * - p< 0.05, Mann Whitney Rank Sum Test) than the corresponding region of the nondystrophic TS at this age (7 to 10 months). Other regions of the mdx TS tended towards higher fiber densities than corresponding nondystrophic regions, but the results did not reach statistical significance (Fig. 6A). Muscle fiber diameter (Fig. 6B) and cross sectional area (Fig. 6C) in the mdx TS was significantly (** - p<0.01, *** - p<0.001, t test or Mann Whitney Rank Sums test) smaller than in the age-matched nondystrophic TS throughout all regions of the muscle. The combined effects of the increased fiber density and smaller fiber cross-sectional area in the mdx TS produced significant reductions in the working area per unit length for the cephalad and middle regions (Fig. 6D; ** - p<0.01, t test) and a reduction in the caudal region that just failed to reach statistical significance (p=0.06, t test).
The effects of PDTC and UDCA on fiber density and diameter in the mdx TS muscle
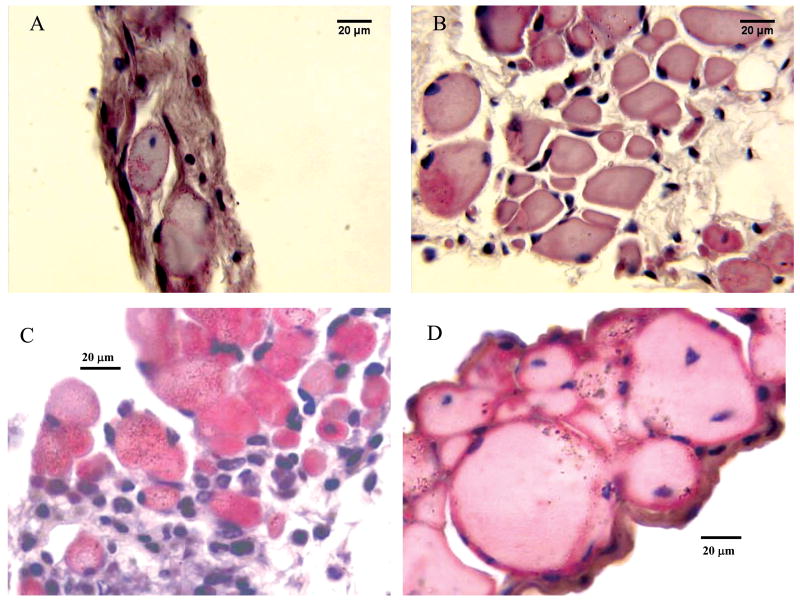
Fiber density in the caudal TS region of PDTC treated adult mdx mice (Fig. 7A, B) was significantly (p<0.05; Mann Whitney Rank Sum test) increased from approximately 0.02 ± 0.01 (SEM; N = 7) in the vehicle treated preparations to 0.08 ± 0.03 (N=6) fibers/μm. PDTC treatment did not influence fiber density in either the cephalad or middle TS regions. As in the PDTC studies, UDCA had no effect on fiber density in either the cephalad or middle TS regions. In the caudal region, UDCA increased fiber density from 0.28 ± 0.03 (N=6) to 0.38 ± 0.04 (N=7) fibers/μm, an effect which just failed to reach statistical significance (p=0.07).
Figure 7.
The effect of PDTC (A,B) or UDCA (B,C) treatment on the TS muscle. Staining is H&E (20 μm calibration). Cross-sections obtained from caudal TS muscles from mature adult mdx mice treated chronically with vehicle (A) or PDTC (B). (A) Severely dystrophic caudal TS region of a 12.5 month old vehicle treated mdx mouse. Note the extensive fibrosis and densely stained cellular infiltrates, the relative lack of fiber cross sections, and the centrally located nucleus in the approximate middle of the section. (B) Caudal TS of a 12 month old PDTC treated mdx mouse. Note the elevated number of fibers and the apparent absence of centronucleation in this section. Cross sections obtained from the middle TS region of 2 month old mdx mice treated with either UDCA vehicle (C) or UDCA (D). Note the extensive cellular infiltration in (C) and the larger fiber cross sections with no cellular infiltrates in (D).
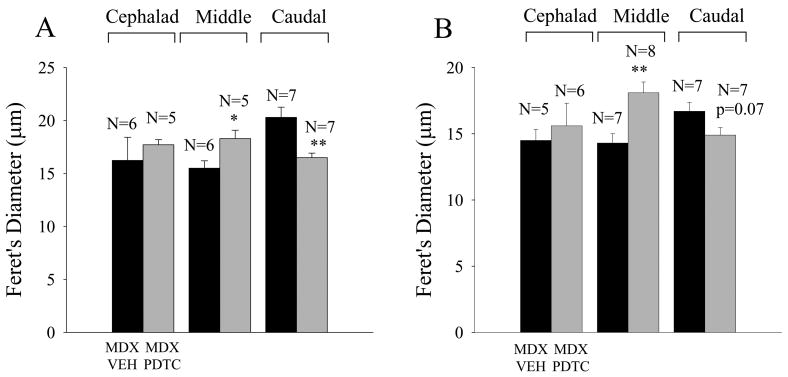
PDTC significantly increased fiber diameter in the middle region and decreased diameter in the caudal region (Fig 8A; * - p<0.05; ** - p<0.01, t tests). A second smaller study examining the action of PDTC in young adult (1 month old) mdx mice indicated a similar statistical trend in which a 30 day PDTC treatment period reduced fiber diameter by 12 % in the caudal region and increased diameter by 14 % in the cephalad region. The UDCA experiments on young adult mdx mice (Fig. 7C, D) also indicated a significant drug-induced increase in Feret's diameter in the middle region (Fig 8B; p < 0.01, t test), and a reduction that just failed to reach significance in the caudal region (Fig 8B; p=0.07, t test). Similar effects of UDCA were observed on the minor diameter and the fiber cross-sectional area, but these effects did not reach statistical significance.
Figure 8.
Treatment with two distinct inhibitors of the NF-κB pathway produced similar effects on fiber diameter in the mdx TS muscle. Black histobars represent vehicle treated mdx mice and gray histobars mdx mice treated with either PDTC (A) or UDCA (B). (A) Treatment of mature mdx mice with PDTC increased fiber diameter in the middle TS (* - p<0.05) and reduced diameter (** - p<0.01) in the caudal region. (B) Treatment of young adult (30 day old) mdx mice with UDCA (30 days) increased fiber diameter in the middle region (** - p<0.01) but did not significantly influence diameter in the caudal TS (p=0.07). N equals the number of preparations (mice).
The effect of PDTC and UDCA on percent centronucleation
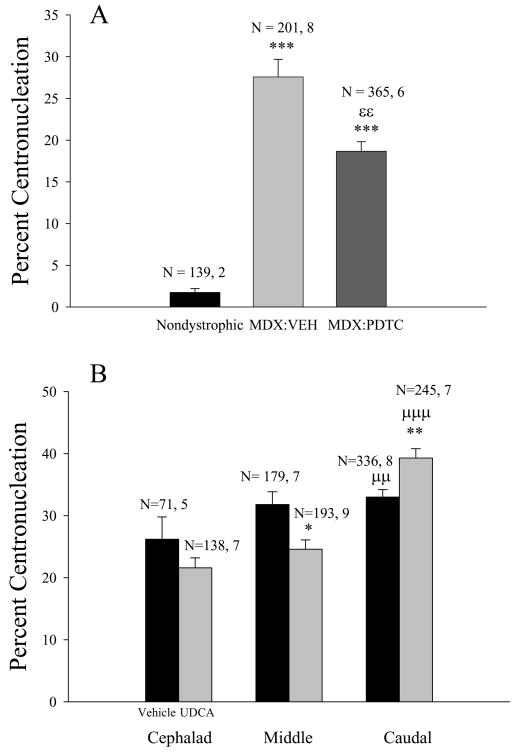
In the vehicle treated mature mdx mice used in the PDTC investigations, there were no significant regional differences in percent centronucleation, and the data from all regions were combined. PDTC treatment produced a significant 32 % reduction in the percentage of centrally located nuclei from 27.6 ± 2.1 (SEM) % (vehicle-treated) to 18.7 ± 1.1% (Fig. 9A; εε - p< 0.05; Mann- Whitney Rank Sum test).
Figure 9.
Treatment with two distinct inhibitors of the NF-κB pathway produced similar effects on centronucleation in the mdx TS muscle. (A) Treatment of mature mdx mice with PDTC reduced percent centronucleation (εε - p<0.01). Both the vehicle and PDTC treated mdx TS muscles exhibited increased percent centronucleation (*** - p<0.001; Mann Whitney) compared to the adult nondystrophic TS. (B) Treatment of young adult mdx mice with UDCA reduced percent centronucleation in the middle TS region (* - p<0.05) and increased percent centronucleation in the caudal TS (** - p<0.01). At 60 days of age, mdx mice exhibited a cephalad to caudal gradient in percent centronucleation (μμ - p<0.01; μμμ - p<0.001). N refers to the number of images analyzed (e.g., Fig. 3), number of preparations (mice).
In the 2 month old mdx TS preparations, percent centronucleation was a function of region with the highest percentage observed in the caudal TS (Fig. 9B; μμ - p< 0.01, μμμ - p<0.001, ANOVA, Holm-Sidak). In the middle TS region, UDCA produced a significant (Fig. 9B; * - p< 0.05, Mann-Whitney Rank Sum test) 23% reduction in percent centronucleation from 31.8 ± 2.0 in the vehicle treated mice to 24.6 ± 1.5%. In contrast, UDCA produced a 19% increase in percent centronucleation (Fig. 8B; ** - p< 0.01, Mann-Whitney Rank Sum test) in the caudal TS, increasing this measure from 33.0 ± 1.2 to 39.3 ± 1.5 %. Similarly, the 30 day PDTC treatment of 1 month old mdx mice produced significant (p<0.01; p<0.001, t tests) reductions in centronucleation in the middle (by 42%) and cephalad regions (by 34%), respectively, but failed to influence centronucleation in the caudal TS region.
Discussion
Plasma membrane stripping in areas devoid of sarcoplasm suggests that membrane disorganization is a late event in dystrophic pathogenesis
The purpose of this study was to assess the influence of long term passive stretch in vivo on dystrophic morphology, and further determine the morphometric consequences of treatment with two distinct NF-κB inhibitors on a dystrophic muscle with a highly patterned and constant history of passive stretch and contractile activation. The results show that passively stretched mdx TS fibers exhibit extensive hypercontraction (Fig. 2B, C) that is associated with the complete loss of organized sarcoplasm (Fig. 4) and a dissociation of plasma membrane from the basal lamina in the empty regions of mdx fibers (Fig. 5). Earlier electron microscopic observations from patients with Duchenne muscular dystrophy (Milhorat et al.,1966) and mdx limb muscle (Torres and Duchen, 1987) indicated similar empty sarcoplasmic areas in which the plasma membrane appeared to be stripped away from the underlying basal lamina. These observations are consistent with Stage V of the continuum presented by Cullen and Fulthorpe (1975) who described “fibers with “structureless cytoplasm containing no contractile material” in human dystrophic muscle. In agreement with Torres and Duchen (1987), no delta lesions similar to those reported by Mokri and Engel (1975), and no plasma membrane abnormalities were observed in relatively intact areas containing degenerating sarcomeres. Furthermore, in agreement with Cullen and Fulthorpe (1975), we observed macrophage infiltration and engulfment of empty fiber remnants, indicating that the empty fiber remnants represent a late stage in dystrophic pathogenesis. Since plasma membrane stripping and vacuolization were only observed in empty fiber remnants, these results are consistent with the hypothesis that disruptions in the plasma membrane occur relatively late in the pathogenic sequence and are not the initiating pathogenic event (Carlson, 1998).
Regional differences in the magnitude of passive stretch may influence muscle fiber growth and regeneration in both nondystrophic and mdx mice
The results of this study provide new evidence suggesting that increases in the magnitude of passive stretch promote muscle fiber growth and regeneration in both nondystrophic and mdx muscle. Evidence from other quiadripeds clearly indicates that the TS is regularly activated during expiration and passively stretched during inspiration, with the magnitude of passive stretch increasing along a cephalad to caudal gradient (DeTroyer and Ninane, 1986; Hwang et al., 1989; Ninane et al., 1989;DeTroyer and Legrand, 1998; DeTroyer et al., 1998). The results of the present study demonstrate that fiber density, fiber diameter, cross-sectional area, and total working area also increase in a characteristic cephalad to caudal gradient (Fig. 6). These results therefore suggest that passive stretch stimulates fiber regeneration to increase fiber density (Fig. 6A), and increases individual fiber growth to produce larger fiber diameters and cross-sectional areas (Fig. 6B,C).
Mdx TS muscles have smaller diameter fibers and tend to have higher fiber densities than nondystrophic TS
The most profound morphometric difference between nondystrophic and untreated mdx TS muscles was the substantial reduction in fiber diameter and cross sectional area observed across all regions of the mdx TS (Fig. 6B, C). In particular, the average fiber cross sectional area in the mdx TS was approximately 34 to 38 % of the corresponding value in the nondystrophic TS (Fig. 6C). Consistent with the elevated regeneration characteristic of dystrophic muscle, mdx TS muscles also exhibited significantly higher fiber densities than nondystrophic muscles in the middle TS region and showed similar trends in the cephalad and caudal regions (Fig 6A). In these mature adult mdx TS muscles (7 to 10 months), the net effect of the reduction in fiber cross-section and increase in fiber density was an approximately 50% smaller total working area per unit length throughout the TS (Fig. 6D). The smaller diameter of mdx TS muscle fibers (Fig 6B) is in contrast to previous observations indicating enhanced variation in fiber diameters with overall fiber hypertrophy in the limb musculature (Milhorat et al., 1966; Anderson et al; 1987, 1988). These differences between fiber size in mdx limb muscles and in mdx TS may relate to differences in cell signaling between muscles with quite distinct histories of activation.
The effect of NF-κB inhibitors on fiber diameter may depend upon the stretch-dependent status of cell signaling pathways
The results suggest that the effects of NF-κB inhibitors on mdx fiber morphology may depend on the underlying status of signaling pathways that are involved in regulating muscle regeneration and growth. Both PDTC and UDCA tended to increase fiber density and reduce fiber diameter (cross-sectional area) in the caudal TS, and increase fiber diameter with no effect on fiber density in more cephalad regions (Fig. 8).
The observation that fiber density was highest in the caudal region of both nondystrophic and mdx TS muscles (Fig 6A), along with fact that centronucleation was highest in the caudal region of young adult TS muscles (Fig. 9B), indicate that this region experiences the highest rate of muscle regeneration. Therefore, the results showing that PDTC and UDCA tended to increase fiber density and reduce fiber diameter in the caudal TS, along with the effect of UDCA in increasing centronucleation in this region (Fig. 9B), are consistent with the hypothesis that NF-κB inhibitors increase muscle regeneration in areas that are already rapidly regenerating.
In more cephalad regions, both PDTC and UDCA increased fiber diameter without altering fiber density (Fig. 8). These drugs also reduced centronucleation in the mature mdx TS fibers and in the middle region of young adult mdx TS muscles (Fig 9). Overall, these results suggest that NF-κB inhibitors increase the growth and diameter of existing fibers in muscle areas undergoing slower rates of regeneration, and promote the regeneration of new fibers in areas undergoing more rapid rates of regeneration.
Summary
The results provide evidence in chronically passively stretched dystrophic muscle that hypercontraction in the presence of an intact plasma membrane produces contraction plugs and adjacent end-stage empty fiber remnants that subsequently exhibit a dissociation of the plasma membrane and the underlying basal lamina. Morphometric evidence regarding fiber density and fiber diameter are consistent with the hypothesis that increases in the magnitude of passive stretch promote signaling pathways that enhance fiber regeneration and growth in both nondystrophic and mdx TS muscles. The results also suggest that the effects of NF-κB inhibitors on dystrophic muscle fibers may depend upon the status of those signaling pathways that control the balance between the regeneration of new fibers and the growth of existing fibers. Most importantly, however, the results illustrate the utility of the mdx TS muscle as a template for assessing the therapeutic efficacy of signal transduction modulators in the development of improved treatments for Duchenne and related muscular dystrophies.
Acknowledgments
This work was supported by grants to CGC from the Warner's Fund of AT Still University (ATSU), the Strategic Research Grant Fund of ATSU, the Association Française contre les Myopathies (AFM; 11832, 13980), Charley's Fund, and the NIH (R15AR055360). The authors also gratefully acknowledge the technical support of Bonnie King of the Physiology department (ATSU), and Raella Wiggins and Alan Coonfield of the Animal care staff at ATSU. The authors also thank Truman State University for the use of the electron microscope facility.
References
- Abramoff MD, Magelhaes PJ, Ram SJ. Image processing with Image J. Biophotonics International. 2004;11:36–42. [Google Scholar]
- Acharyya S, Villalta A, Bakkar N, Bupha-Intr T, Janssen PML, Carathers M, Li ZW, Beg AA, Ghosh S, Sahenk Z, Weinstein M, Gardner KL, Rafael-Fortney JA, Karin M, Tidball JG, Baldwin AS, Guttridge DC. Interplay of IKK/NF-κB signaling in macrophages and myofibers promotes muscle degeneration in Duchenne muscular dystrophy. J Clin Invest. 2007;117:889–901. doi: 10.1172/JCI30556. [DOI] [PMC free article] [PubMed] [Google Scholar]
- Anderson JE, Bressler BH, Ovalle WK. Functional regeneration in the hindlimb skeletal muscle of the mdx mouse. J Muscle Res Cell Motil. 1988;9:499–515. doi: 10.1007/BF01738755. [DOI] [PubMed] [Google Scholar]
- Anderson JE, Ovalle WK, Bressler BH. Electron microscopic and autoradiographic characterization of hindlimb muscle regeneration in the mdx mouse. Anat Rec. 1987;219:243–257. doi: 10.1002/ar.1092190305. [DOI] [PubMed] [Google Scholar]
- Barnes PJ. Molecules in Focus: Nuclear Factor-κB. Int J Biochem Cell Biol. 1997;29(6):867–870. doi: 10.1016/s1357-2725(96)00159-8. [DOI] [PubMed] [Google Scholar]
- Briguet A, Courdier-Fruh I, Foster M, Meier T, Magyar JP. Histological parameters for the quantitative assessment of muscular dystrophy in the mdx mouse. Neuromuscul Disord. 2004;14:675–682. doi: 10.1016/j.nmd.2004.06.008. [DOI] [PubMed] [Google Scholar]
- Carlson CG. The dystrophinopathies: An alternative to the structural hypothesis. Neurobiol Dis. 1998;5:3–15. doi: 10.1006/nbdi.1998.0188. [DOI] [PubMed] [Google Scholar]
- Carlson CG, Gueorguiev A, Roshek DM, Ashmore R, Chu JS, Anderson JE. Extra-junctional resting Ca2+ influx is not increased in a severely dystrophic expiratory muscle triangularis sterni of the mdx mouse. Neurobiol Dis. 2003;14(2):229–239. doi: 10.1016/s0969-9961(03)00128-1. [DOI] [PubMed] [Google Scholar]
- Carlson CG, Samadi A, Siegel A. Chronic treatment with agents that stabilize cytosolic IκB-α enhance survival and improve resting potential in mdx muscle fibers subjected to chronic passive stretch. Neurobiol Dis. 2005;20(3):719–730. doi: 10.1016/j.nbd.2005.05.003. [DOI] [PubMed] [Google Scholar]
- Cullen MJ, Fulthorpe JJ. Stages in fibre breakdown in Duchenne muscular dystrophy. J Neurol Sci. 1975;24:179–200. doi: 10.1016/0022-510x(75)90232-4. [DOI] [PubMed] [Google Scholar]
- Cuzzocrea S, Chatterjee PK, Mazzon E, Dugo L, Serraino I, Britti D, Mazzullo G, Caputi AP, Thiemermann C. Pyrrolidine dithiocarbamate attenuates the development of acute and chronic inflammation. Brit J Pharmacol. 2002;135:496–510. doi: 10.1038/sj.bjp.0704463. [DOI] [PMC free article] [PubMed] [Google Scholar] [Retracted]
- De Troyer A, Legrand A. Mechanical advantage of the canine triangularis sterni. J Appl Physiol. 1998;84(2):562–568. doi: 10.1152/jappl.1998.84.2.562. [DOI] [PubMed] [Google Scholar]
- De Troyer A, Legrand A, Gevenois PA, Wilson TA. Mechanical advantage of the human parasternal intercostal and triangularis sterni muscles. J Physiol. 1998;513(3):915–925. doi: 10.1111/j.1469-7793.1998.915ba.x. [DOI] [PMC free article] [PubMed] [Google Scholar]
- De Troyer A, Ninane V. Triangularis sterni: a primary muscle of breathing in the dog. J Appl Physiol. 1986;60:14–21. doi: 10.1152/jappl.1986.60.1.14. [DOI] [PubMed] [Google Scholar]
- Hayakawa M, Miyashita H, Sakamoto I, Kitagawa M, Tanaka H, Yasuda H, Karin M, Kikugawa K. Evidence that reactive oxygen species do not mediate NF-κB activation. EMBO J. 2003;22:3356–3366. doi: 10.1093/emboj/cdg332. [DOI] [PMC free article] [PubMed] [Google Scholar]
- Hayden MS, Ghosh S. Signaling to NF-κB. Genes Dev. 2004;18:2195–2224. doi: 10.1101/gad.1228704. [DOI] [PubMed] [Google Scholar]
- Hwang JC, Zhou D, St John WM. Characterization of expiratory intercostal activity to triangularis sterni in cats. J Appl Physiol. 1989;67(4):1518–1524. doi: 10.1152/jappl.1989.67.4.1518. [DOI] [PubMed] [Google Scholar]
- Kumar A, Boriek AM. Mechanical stress activates the nuclear factor-kappa B pathway in skeletal muscle fibers: a possible role in Duchenne muscular dystrophy. FASEB J. 2003;17:386–396. doi: 10.1096/fj.02-0542com. [DOI] [PubMed] [Google Scholar]
- Milhorat AT, Shafiq SA, Goldstone L. Changes in muscle structure in dystrophic patients, carriers and normal siblings seen by electron microscopy: Correlations with levels of serum creatine phosphokinase CPK. Ann N Y Acad Sci. 1966;138(Art. 1):246–292. doi: 10.1111/j.1749-6632.1966.tb41170.x. [DOI] [PubMed] [Google Scholar]
- Miura T, Ouchida R, Yoshikawa N, Okamoto K, Makino Y, Nakamura T, Morimoto C, Makino I, Tanaka H. Functional modulation of the glucocorticoid receptor and suppression of NF-kB-dependent transcription by ursodeoxycholic acid. J Biol Chem. 2001;276:47371–47378. doi: 10.1074/jbc.M107098200. [DOI] [PubMed] [Google Scholar]
- Mokri B, Engel AG. Duchenne dystrophy: Electron microscopic findings point to a basic or early abnormality in the plasma membrane of the muscle fiber. Neurology. 1975;25:1111–1120. doi: 10.1212/wnl.25.12.1111. [DOI] [PubMed] [Google Scholar]
- Monici MC, Aguennouz M, Mazzeo A, Messina C, Vita G. Activation of nuclear factor-κB in inflammatory myopathies and Duchenne muscular dystrophy. Neurology. 2003;60:993–997. doi: 10.1212/01.wnl.0000049913.27181.51. [DOI] [PubMed] [Google Scholar]
- Ninane V, Baer RE, De Troyer A. Mechanism of triangularis sterni shortening during expiration in dogs. J Appl Physiol. 1989;66(5):2287–2292. doi: 10.1152/jappl.1989.66.5.2287. [DOI] [PubMed] [Google Scholar]
- Siebenlist U, Franzoso G, Brown K. Structure, Regulation and Function of NF-κB. Annu Rev Cell Biol. 1994;10:405–455. doi: 10.1146/annurev.cb.10.110194.002201. [DOI] [PubMed] [Google Scholar]
- Siegel AL, Bledsoe C, Lavin J, Gatti F, Berge J, Millman G, Turin E, Winders WT, Rutter J, Palmeiri B, Carlson CG. Treatment with inhibitors of the NF-κB pathway improves whole body tension development in the mdx mouse. Neuromuscul Disord. 2009;19:131–139. doi: 10.1016/j.nmd.2008.10.006. [DOI] [PubMed] [Google Scholar]
- Singh R, Millman G, Turin E, Polisiakeiwicz L, Lee B, Gatti F, Berge J, Smith E, Rutter J, Sumski C, Winders WT, Samadi A, Carlson CG. Increases in nuclear p65 activation in dystrophic skeletal muscle are secondary to increases in the cellular expression of p65 and are not solely produced by increases in IκB-α kinase activity. J Neurol Sci. 2009;285:159–171. doi: 10.1016/j.jns.2009.06.030. [DOI] [PubMed] [Google Scholar]
- Torres LFB, Duchen LW. The mutant mdx: Inherited myopathy in the mouse: Morphological studies of nerves, muscles and end-plates. Brain. 1987;110:269–299. doi: 10.1093/brain/110.2.269. [DOI] [PubMed] [Google Scholar]


