Abstract
Background: The consumption of omega-3 (n–3) and omega-6 (n–6) essential fatty acids in Western diets is thought to have changed markedly during the 20th century.
Objective: We sought to quantify changes in the apparent consumption of essential fatty acids in the United States from 1909 to 1999.
Design: We calculated the estimated per capita consumption of food commodities and availability of essential fatty acids from 373 food commodities by using economic disappearance data for each year from 1909 to 1999. Nutrient compositions for 1909 were modeled by using current foods (1909-C) and foods produced by traditional early 20th century practices (1909-T).
Results: The estimated per capita consumption of soybean oil increased >1000-fold from 1909 to 1999. The availability of linoleic acid (LA) increased from 2.79% to 7.21% of energy (P < 0.000001), whereas the availability of α-linolenic acid (ALA) increased from 0.39% to 0.72% of energy by using 1909-C modeling. By using 1909-T modeling, LA was 2.23% of energy, and ALA was 0.35% of energy. The ratio of LA to ALA increased from 6.4 in 1909 to 10.0 in 1999. The 1909-T but not the 1909-C data showed substantial declines in dietary availability (percentage of energy) of n−6 arachidonic acid, eicosapentaenoic acid (EPA), and docosahexaenoic acid (DHA). Predicted net effects of these dietary changes included declines in tissue n--3 highly unsaturated fatty acid status (36.81%, 1909-T; 31.28%, 1909-C; 22.95%, 1999) and declines in the estimated omega-3 index (8.28, 1909-T; 6.51, 1909-C; 3.84, 1999).
Conclusion: The apparent increased consumption of LA, which was primarily from soybean oil, has likely decreased tissue concentrations of EPA and DHA during the 20th century.
INTRODUCTION
There has been much speculation about changes in the consumption of essential fatty acids throughout the 20th century; however, to our knowledge, detailed quantitative analyses have not been reported. It has been suggested that n−3 fatty acids [α-linolenic acid (ALA), eicosapentaenoic acid (EPA), docosapentaenoic acid (DPA n−3), and docosahexaenoic acid (DHA)] have become less abundant in American diets, and the average ratio of n−6 to n−3 fatty acids has increased from as little as 1:1 to as much as 30:1 (1).
Dietary intakes of n−3 and n−6 fatty acids are critical determinates of the proportions of bioactive 20- and 22-carbon n−6 and n−3 highly unsaturated fatty acids (HUFAs) in tissue phospholipids (2). Tissue HUFAs, in turn, have been shown to affect multiple disease states (3–7) ranging from psychiatric (8, 9) and cardiovascular disease (10) to neurodevelopmental deficits (11). The omega-3 index, which is a direct measure of erythrocyte EPA + DHA as a percentage of total fatty acids, has been proposed as a risk biomarker for cardiovascular disease (10). However, there is no method for estimating the omega-3 index from dietary intakes of n−3 and n−6 fatty acids. In contrast, the percentage of n−3 in HUFAs is a biomarker that can be predicted by dietary intake data for all relevant n−3 and n−6 fatty acids in humans by using an empirical equation developed by Lands et al (2). The percentage of n−3 in HUFAs can be used alone as an indicator of disease risk or to estimate the omega-3 index in the absence of direct erythrocyte sampling (12). To our knowledge, no estimate of changes in the n−3 or n−6 tissue status of Americans throughout the 20th century has previously been published.
We used the standardized methods of the Center for Nutrition Policy and Promotion (CNPP) (13) for analyzing US Department of Agriculture (USDA) food-availability data to evaluate the essential fatty acid content of the US food supply from 1909 to 1999 (all years available for the 20th century). Because the essential fatty acid composition of foods produced in the early 20th century were likely to be different from those produced by modern practices (14–16), the essential fatty acid content for 1909 was modeled twice: 1909-C designating modeling with foods with current fatty acid compositions and 1909-T designating modeling using nutrient composition data from the direct analysis of foods produced via practices that were common in the early 20th century (1909-T) (Table 1). In addition, we derived the omega-3 index and percentage of n−3 in HUFAs to estimate the consequent changes in tissue status.
TABLE 1.
Comparison of current (-C) and traditional (-T) foods in 1909 diets1
| Fatty acid composition |
||||||
| Food |
LA | ALA | AA | EPA | DPA n−3 | DHA |
|
g/100g |
||||||
| Whole milk-C | 0.070 | 0.040 | — | — | — | — |
| Whole milk-T | 0.117 | 0.051 | 0.007 | 0.006 | 0.006 | 0.001 |
| Ground beef-C | 0.620 | 0.240 | 0.050 | 0.010 | — | 0.060 |
| Ground beef-T | 0.211 | 0.068 | 0.050 | 0.018 | 0.032 | 0.005 |
| Pork-C | 1.460 | 0.110 | 0.090 | — | — | — |
| Pork-T | 1.042 | 0.101 | 0.061 | 0.004 | 0.016 | 0.006 |
| Bacon-C | 6.263 | 0.740 | 0.008 | — | — | — |
| Bacon-T | 2.907 | 0.225 | 0.087 | 0.004 | 0.018 | 0.009 |
| Chicken-C | 2.830 | 0.130 | 0.100 | 0.010 | 0.010 | 0.030 |
| Chicken-T | 2.527 | 0.285 | 0.106 | 0.019 | 0.031 | 0.044 |
| Turkey-C | 1.640 | 0.100 | 0.120 | — | 0.020 | 0.020 |
| Turkey-T | 1.532 | 0.204 | 0.083 | 0.006 | 0.015 | 0.020 |
| Butter-C | 1.830 | 1.18 | — | — | — | — |
| Butter-T | 2.283 | 0.984 | 0.150 | 0.077 | 0.142 | 0.010 |
| Egg-C | 1.140 | 0.030 | 0.140 | 0.004 | — | 0.030 |
| Egg-T | 1.293 | 0.096 | 0.186 | 0.004 | 0.058 | 0.133 |
| Margarine-C | 24.3 | 1.1 | — | — | — | — |
| Margarine-T | 11.64 | 1.19 | — | — | — | — |
| Shortening-C | 11.40 | 0.6 | — | — | — | — |
| Shortening-T | 8.3 | 0.5 | — | — | — | — |
| Beef tallow-C | 3.100 | 1.000 | — | — | — | — |
| Beef tallow-T | 1.650 | 1.000 | — | — | — | — |
| Lard-C | 10.200 | 1.000 | — | — | — | — |
| Lard-T | 3.625 | 1.000 | — | — | — | — |
LA, linoleic acid; ALA, α-linolenic acid; AA, arachidonic acid; EPA, eicosapentaenoic acid; DPA n−3, docosapentaenoic acid; DHA, docosahexaenoic acid. —, data not detectable or concentration not reported. 1909-C food data list US Department of Agriculture nutrient database fatty acid–composition values. 1909-T foods were obtained from Polyface Farms (Swoope, VA) and US Wellness Meats (Monticello, MO) (n = 3).
METHODS
Food-availability data for the years 1909–1999 was obtained from the Economic Research Service of the USDA (17). Only foods available for human consumption were included, with efforts made to avoid double counting (eg, only lard and tallow for direct consumption by consumers were included in these categories, whereas lard and tallow used for the production of margarine and shortening were accounted for in those categories). Three hundred seventy-three different food commodities were identified as dietary sources of fatty acids. Annual food availability data were estimated as the residual after exports, industrial uses, seed and feed uses, and year-end inventories were subtracted from the sum of production, inventories at the start of the year, and imports. This amount was multiplied by a constant to account for some losses in processing, spoilage, and waste. Food-availability data were divided by the US population on July 1 for each year to estimate the annual per capita consumption.
The n−3 and n−6 essential fatty acid and calorie contents for each commodity were estimated by using the USDA National Nutrient Database for Standard Reference, version 19 (18). Current nutrient-composition values were used; however, estimates of the edible portion consumed and nutrient composition were recalculated at various points throughout the time span for several products (eg, lean beef, pork fat, certain fish, various fruit and vegetables, and enriched flour and cereal), in some cases as often as every 5 y, per CNPP guidelines. An additional nutrient data set was created for the recalculation of a traditional 1909 diet (1909-T) on the basis of direct nutrient analyses of foods produced by using methods consistent with 1909 farming and breeding techniques (Table 1 and food compositional analysis below).
The estimated per capita consumption by weight of each fatty acid was calculated by multiplying the fatty acid content by weight by the annual per capita availability of all individual commodities by weight and then summing all values. These data were used to determine dietary ratios for total n−6 to total n−3 fatty acids and for linoleic acid (LA) to ALA. The total daily energy was similarly calculated, and major sources of calories were identified as food categories that contributed >3.5% of calories for some portion of the century. The annual estimated per capita consumption of each fatty acid was converted to a percentage of total daily energy (percentage of energy) on the basis of a factor of 9 kcal/g fat. These estimates assumed uniform discrepancies between nutrients available for dietary intakes and the actual ingestion for all foods (ie, the waste of meat or fat calories because of spoilage, trimming, discarding, or other causes was similar for seed oils, seafood, and other foods). This process was repeated for 1909 by using the revised 1909-T nutrient data set.
The percentage contribution of energy from each food category (or specific commodity) was calculated by dividing the calories contributed by each food category by the total estimated per capita calorie consumption for each year and then multiplying by 100%. Similarly, the percentage contribution of fatty acids from each food category was calculated by dividing the amount of the fatty acids derived from the food by the total estimated per capita consumption of fatty acids that year and multiplying by 100% (13, 17, 18). All calculations described in this section were performed with the Microsoft Office Excel program (Windows XP; Microsoft, Redmond, WA).
Statistical analysis
The estimated per capita consumption of essential fatty acids and major food commodities was assessed for autocorrelation over time by using the Box-Ljung test of residuals and autoregressive moving average modeling in STATISTICA software for Windows version 8.0 (StatSoft, Tulsa, OK). Only variables without significant autocorrelation were included in regression models (19). The use of a simple linear regression model to evaluate the statistical significance of changes in LA over time was shown to be appropriate.
Food compositional analysis
Nutrient contents were determined by using a direct analysis of milk, butter, eggs, poultry, beef, and pork products from sources that used production methods consistent with 1909 farming and breeding techniques (Table 1). Three samples of each type of food were thawed completely, weighed on an analytic balance, and immediately placed into 2 mL cold methanol that contained 50 μg butylated hydroxytoluene/mL. A known mass of 22:3n−3 methyl ester internal standard (Nu-Chek Prep, Elysian, MN) was added to the solution. These samples in solution were homogenized mechanically with the TH-01 handheld homogenizer (OMNI International, Kennesaw, GA), chilled in an outer ice bath, and subsequently capped under nitrogen gas. Fatty acids were extracted from these food samples in a solution by using a modification of the method of Folch et al (20) by using chloroform:methanol solvents in a 1:1 ratio and an aqueous phosphate buffer solution. Lipids were recovered into the chloroform layer after 2 extractions. This fraction was evaporated under nitrogen and transesterified (21). Fast gas chromatography was performed on the methyl esters in hexane with a Hewlett-Packard 6890 gas chromatograph equipped with a flame ionization detector (22). Peaks were identified by using authentic standards (Nu-Check Prep, Elysian, MN). Fatty acids were quantified by comparison with peak areas of the identified 22:3n−3 internal standard peaks.
Estimation of changes in tissue composition
The nutrient availability was used to predict the n−3 tissue status expressed as both the percentage of n−3 in HUFAs and as the omega-3 index. The percentage of n−3 in HUFAs was calculated by using an empirical equation developed by Lands et al (2, 12), which reliably estimates the mean proportion of n−3 and n−6 HUFAs in membrane phospholipids that result from the dietary intake of essential fatty acids. The equation uses the following 4 categories of dietary essential fatty acids expressed as a percentage of food energy (en%): 18-carbon n−3 polyunsaturated fatty acid (PUFA) (ALA; P3), 18-carbon n−6 PUFA (LA; P6), 20- and 22-carbon n−3 HUFAs (EPA, DPA n−3, and DHA; H3), and 20- and 22-carbon n−6 HUFAs [arachidonic acid (AA) and DPA n−6; H6].
 |
where HC3 = 3.0, HC6= 0.70, PC3 = 0.0555, PC6 = 0.0441, HI3 = 0.005, HI6 = 0.040, Co = 5.0, and K5 = 0.175.
These 4 variables accounted for the metabolic competition among 18-carbon fatty acids and the efficiency of the direct consumption of 20- and 22-carbon fatty acids. The n−3 HUFA composition of tissue membranes for the average American for 1909-T and yearly from 1909-C to 1999 was calculated by entering annual fatty acid apparent-consumption data as percentages of energy in Equation 1 with Microsoft Office Excel (Windows XP; Microsoft). The omega-3 index was estimated by using the mathematical relation between the percentage of n−3 in HUFAs and the omega-3 index (omega-3 index = percentage of n−3 in HUFAs × 0.32–3.5), which is linear and robust over the range of 25–62% and 2–17%, respectively (12).
Time-series determination of the dependence of the percentage of nminus3 in HUFAs on LA and ALA
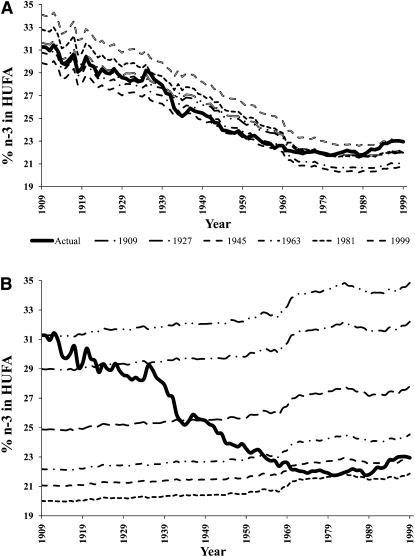
To evaluate if the predicted percentage of n−3 in HUFAs was dependent on dietary changes in the LA (P6) and/or ALA (P3) input variables, a resampling procedure was used. For LA, the original time-series data plot of the predicted percentage of n−3 in HUFA outcome parameter was divided into five 18-y time intervals (1909, 1927, 1945, 1963, 1981, and 1999). The predicted percentage of n−3 in HUFAs was recalculated 6 times to consider year-to-year changes in the LA percentage of energy, whereas the variables for the other essential fatty acids (ALA [P3], AA [H6], and n−3 HUFAs [H3]) were kept constant at each of these 6 time points. Similarly, to evaluate the effects of ALA, the predicted percentage of n−3 in HUFA function was recalculated at these same 6 time points, whereas variables for the other essential fatty acids (LA [P6], AA [H6], and n−3 HUFAs [H3]) were kept constant.
RESULTS
Differences in the nutrient content of foods for 1909-T and 1909-C diets
The essential fatty acid content of sampled foods produced by using traditional methods (1909-T) and that of the corresponding foods produced by using current methods (1909-C) differed, as shown in Table 1. Most, but not all, 1909-T foods contained less LA and more n−3 EPA, DPA, and DHA than the corresponding 1909-C foods.
Changes in the estimated per capita consumption of major food categories and fats
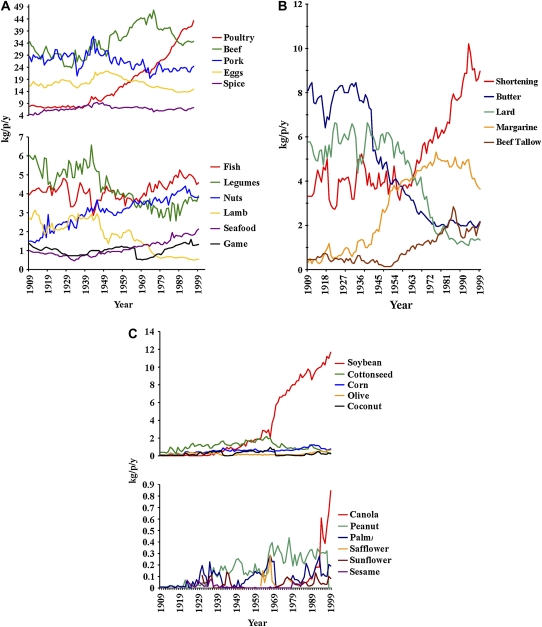
Trends in the estimated per capita consumption of major food commodities between 1909 and 1999 are shown in Figure 1A. The estimated per capita consumption of poultry increased 454% from 7.8 to 43.2 kg ⋅ capita−1 ⋅ y−1 (Table 2). The estimated per capita consumption of butter and lard decreased (73% and 77%, respectively), whereas the consumption of margarine, shortening, and beef tallow increased appreciably (1038%, 170%, and 371%, respectively) (Figure 1B). In general, the consumption of oils increased; however, a few specific oils were responsible for this change. After the market introduction in 1986, the estimated per capita consumption of canola oil increased 167-fold in 13 y from 0.01 to 0.8 kg canola oil ⋅ capita−1 ⋅ y−1. The estimated per capita consumption of soybean oil increased from 0.009 kg soybean oil ⋅ capita−1 ⋅ y−1 in 1909 to 11.64 kg soybean oil ⋅ capita−1 ⋅ y−1 in 1999 (a 1163-fold increase), which made it the primary driver of the overall increase in oil consumption (Figure 1C). Although there were many fluctuations in the availability of all foods, no other notable trends in essential fatty acid sources were observed.
FIGURE 1.
Trends in the estimated per capita consumption of major food commodities (A), major fat commodities (B), and vegetable and seed oils (C) between 1909 and 1999. kg/p/y, kilograms per person per year.
TABLE 2.
Estimated annual per capita consumption of foods in 1909 and 1999
| Food category | Availability |
Percentage difference | |
| 1909 | 1999 | ||
|
kg |
|||
| Oils | 0.7 | 14.7 | 2051 |
| Soybean | 0.01 | 11.6 | 116,300 |
| Canola1 | 0.01 | 0.8 | 16,700 |
| Peanut2 | 0.01 | 0.7 | 7000 |
| Palm | 0.01 | 0.2 | 1800 |
| Corn | 0.1 | 0.8 | 550 |
| Olive | 0.1 | 0.7 | 500 |
| Coconut | 0.04 | 0.23 | 475 |
| Safflower3 | 0.04 | 0.05 | 25 |
| Cottonseed | 0.4 | 0.31 | −21 |
| Sunflower4 | 0.1 | 0.08 | −27 |
| Sesame5 | 0.07 | 0.05 | −29 |
| Fats | 17.9 | 18.2 | 1.7 |
| Margarine | 0.3 | 3.6 | 1038 |
| Beef tallow | 0.5 | 2.1 | 371 |
| Shortening | 3.3 | 9 | 170 |
| Butter | 8.1 | 2.2 | −73 |
| Lard | 5.8 | 1.3 | −77 |
| Poultry | 7.8 | 43.2 | 454 |
| Nuts | 1.5 | 3.8 | 155 |
| Shellfish | 1 | 2.1 | 114 |
| Sugars | 38.3 | 71.9 | 88 |
| Spice | 4.5 | 7.2 | 63 |
| Fruit | 78.4 | 105.1 | 34 |
| Finfish | 4 | 4.6 | 16 |
| Beef | 34.6 | 34.7 | 0.4 |
| Game | 1.4 | 1.3 | −2.7 |
| Eggs | 16.1 | 14.9 | −7.3 |
| Pork | 28.3 | 24.4 | −14 |
| Dairy | 143.8 | 121.8 | −15 |
| Vegetables | 187.8 | 138.1 | −27 |
| Grains | 135.9 | 92.2 | −32 |
| Legumes | 6 | 3.9 | −36 |
| Lamb | 2.7 | 0.5 | −81 |
Data available for 1986–1999.
Data available for 1909–1997.
Data available for 1962–1985.
Data available for 1931–1999.
Data available for 1923–1985.
Changes in major sources of calories
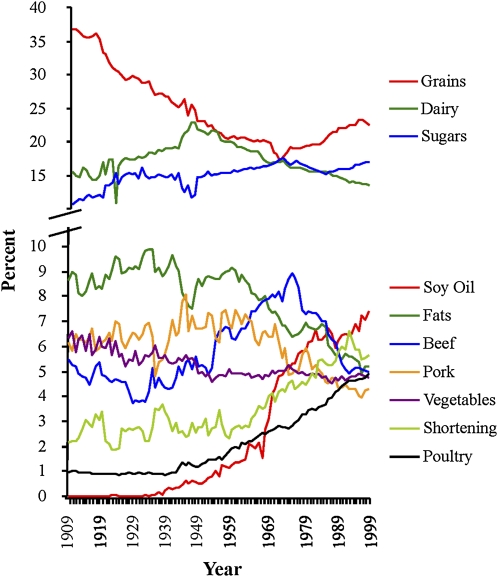
Grains provided the greatest number of calories to the American diet during the 20th century, although their contribution dropped until the 1970s when consumption started to climb again (Figure 2). Dairy and sugar were the next major contributors to the total calorie intake, with sugar overtaking dairy in 1972. Other foods contributed significant amounts of calories, such as fats (minus shortening), beef, pork, vegetables, shortening, and poultry. Soybean oil, shortening (primarily hydrogenated soybean and cottonseed oils), and poultry became major sources of calories late in the 20th century. Soybean oil, which accounted for 0.006% of energy in 1909, was the fourth major contributor of food calories in 1999 (7.38% of energy), which was a >1000-fold increase (Table 3). Poultry as a source of calories increased >4-fold from 0.94% of energy in 1909 to 4.94% of energy in 1999.
FIGURE 2.
Major sources of calories between 1909 and 1999. Fats included shortening, butter, lard, margarine, and beef tallow. Soybean oil was considered separately from other oils because of its disproportionate contribution. Dairy included all milk, buttermilk, condensed milk, cream, sour cream, yogurt, cheese, and eggnog. Butter was not included in the dairy category to avoid double counting.
TABLE 3.
Major sources of calories
| Food category | Percentage contribution |
Percentage difference | |
| 1909 | 1999 | ||
| Soybean oil | 0.006 | 7.38 | 123,810 |
| Poultry | 0.94 | 4.94 | 426 |
| Spice | 0.22 | 0.85 | 277 |
| Oils | 0.44 | 1.55 | 250 |
| Shellfish | 0.06 | 0.15 | 163 |
| Shortening | 2.17 | 5.67 | 161 |
| Nuts | 0.65 | 1.62 | 149 |
| Sugars | 10.64 | 16.95 | 59 |
| Fruit | 2.52 | 3.36 | 33 |
| Game | 0.12 | 0.12 | 0 |
| Beef | 5.46 | 4.98 | −9 |
| Eggs | 1.56 | 1.4 | −10 |
| Dairy | 15.44 | 13.54 | −12 |
| Finfish | 0.47 | 0.39 | −16 |
| Vegetables | 6.35 | 4.75 | −25 |
| Pork | 6.18 | 4.28 | −31 |
| Grains | 36.75 | 22.43 | −39 |
| Fats | 8.63 | 5.22 | −39 |
| Legumes | 0.98 | 0.35 | −64 |
| Lamb | 0.42 | 0.07 | −83 |
| Total | 100 | 100 | — |
Changes in the availability of LA, AA, ALA, EPA, DPA nminus3, and DHA
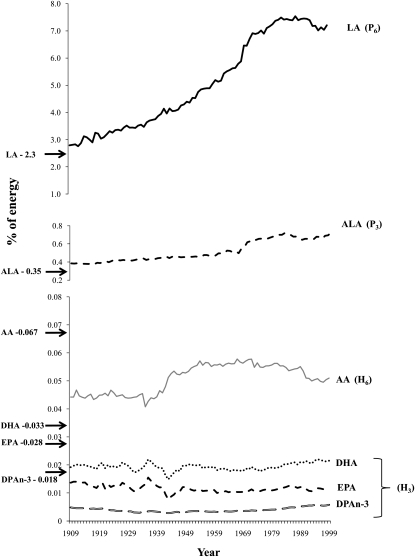
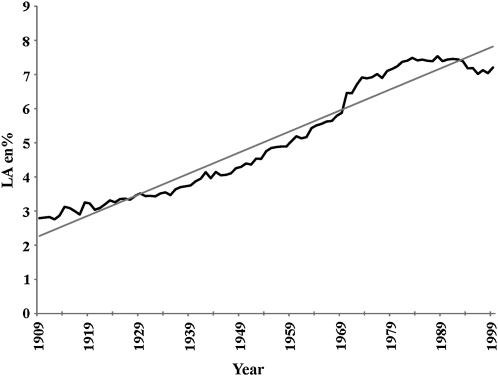
Data for the availability of specific fatty acids were expressed as the percentage of total energy (percentage of energy). With the use of CNPP methods, the availability of LA increased 158% from 2.79% of energy in 1909-C to 7.21% of energy in 1999 (Figure 3, Tables 4 and 5). The linear relation of the increased availability of LA from 1909 to 1999 was shown to be significant at P < 0.000001, with a coefficient of determination of r2 = 0.95 (Figure 4). From 1909 to 1999, the availability of ALA increased 85% from 0.39% of energy to 0.72% of energy. Significance testing for ALA could not be performed because of the autocorrelation of annual data. There were no remarkable changes in the availability of AA, EPA, DPA n−3, and DHA in the 20th century by using 1909-C estimations (Tables 4 and 5). With the use of the 1909-T diet, increases in the availability of LA and ALA from 1909-T to 1999 were more pronounced; LA availability increased 223% from 2.23% of energy to 7.21% of energy, whereas ALA availability increased 109% from 0.35% of energy to 0.72% of energy (Tables 4 and 5). With the use of 1909-T diet data, the availability of AA, EPA, DPA n−3, and DHA decreased over time compared with the availability in 1999 (Tables 4 and 5).
FIGURE 3.
Availability of essential fatty acids from 1909 to 1999. Inputs to the equation of Lands et al (2) to estimate US tissue compositions: P6, P3, H6, and H3 indicate linoleic acid (LA), α-linolenic acid (ALA), n−6 highly unsaturated fatty acids (HUFAs), and n−3 HUFAs, respectively. 1909-T data are indicated by solid arrows for LA (2.23% of energy), ALA (0.35% of energy), arachidonic acid (AA) (0.67% of energy), docosahexaenoic acid (DHA) (0.033% of energy), eicosapentaenoic acid (EPA) (0.028% of energy), and docosapentaenoic acid (DPAn−3) (0.018% of energy).
TABLE 4.
Availability of essential fatty acids from current foods in 1909 and 19991
| Fatty acid | Availability |
Availability |
||||
| 1909 | 1999 | Percentage difference | 1909 | 1999 | Percentage difference | |
|
g ⋅ p−1 ⋅ d−1 |
% of energy |
|||||
| LA | 11.46 | 30.61 | 167 | 2.79 | 7.21 | 158 |
| ALA | 1.58 | 3.06 | 94 | 0.39 | 0.72 | 85 |
| AA | 0.181 | 0.217 | 22 | 0.044 | 0.051 | 25 |
| EPA | 0.056 | 0.048 | −17 | 0.014 | 0.011 | 0 |
| DPA n−3 | 0.020 | 0.025 | 50 | 0.005 | 0.006 | 20 |
| DHA | 0.079 | 0.091 | 13 | 0.019 | 0.022 | 0 |
LA, linoleic acid; ALA, α-linolenic acid; AA, arachidonic acid; EPA, eicosapentaenoic acid; DPA n−3, docosapentaenoic acid; DHA, docosahexaenoic acid; p, person.
TABLE 5.
Availability of essential fatty acids from traditionally produced foods in 1909 and 19991
| Fatty acid | Availability |
Availability |
||||
| 1909 | 1999 | Percentage difference | 1909 | 1999 | Percentage difference | |
|
g ⋅ p−1 ⋅ d−1 |
% of energy |
|||||
| LA | 9.17 | 30.61 | 234 | 2.23 | 7.21 | 223 |
| ALA | 1.42 | 3.06 | 115 | 0.35 | 0.72 | 106 |
| AA | 0.274 | 0.217 | −20 | 0.067 | 0.051 | −24 |
| EPA | 0.118 | 0.048 | −60 | 0.029 | 0.011 | −62 |
| DPA n−3 | 0.075 | 0.025 | −69 | 0.018 | 0.006 | −67 |
| DHA | 0.135 | 0.091 | −30 | 0.033 | 0.022 | −33 |
LA, linoleic acid; ALA, α-linolenic acid; AA, arachidonic acid; EPA, eicosapentaenoic acid; DPA n−3, docosapentaenoic acid; DHA, docosahexaenoic acid; p, person.
FIGURE 4.
Regression analysis for the availability of linoleic acid (LA) between 1909 and 1999. The linear relation [LA percentage of energy (en%) = −115.4221 + 0.0617 × x] was significant at P < 0.000001 with a coefficient of determination of r2 = 0.95 (STATISTICA for Windows version 8.0; StatSoft, Tulsa, OK).
Changes in the ratios of total nminus6 to nminus3, LA to ALA, and nminus6 to nminus3 HUFAs
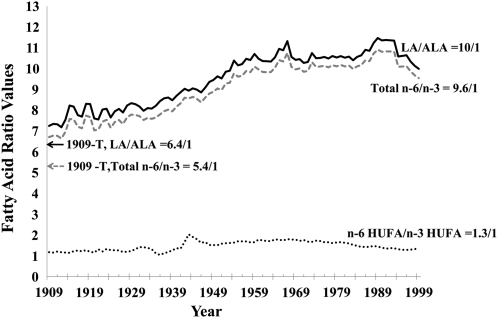
The ratios of total n−6 to n−3 and LA to ALA increased from 1909 to 1999. Based on 1909-C data, the ratio of total n−6 to n−3 increased 42% from 6.7 in 1909-C to 9.6 in 1999 (Table 6, Figure 5). The ratio of LA to ALA increased 38% from 7.3 in 1909-C to 10.0 in 1999. Based on 1909-T data, changes were more pronounced. The ratio of n−6 to n−3 increased 77% from 5.4 in 1909-T to 9.6 in 1999. The ratio of LA to ALA increased 55% from 6.5 in 1909-T to 10.0 in 1999.
TABLE 6.
Measures of essential fatty acid status1
| Percentage difference |
|||||
| 1909 Traditional | 1909 Current | 1999 | Traditional | Current | |
| Total n−6 to n−3 ratio | 5.4 | 6.7 | 9.6 | 77 | 42 |
| LA to ALA ratio | 6.5 | 7.3 | 10.0 | 55 | 38 |
| Percentage of n−3 in HUFAs | 36.81 | 31.28 | 22.95 | −38 | −27 |
| Percentage of n−6 in HUFAs | 63.19 | 68.72 | 77.05 | 22 | 12 |
| Total HUFAs (%) | 100 | 100 | 100 | — | — |
| Omega-3 index | 8.28 | 6.51 | 3.84 | −54 | −41 |
LA, linoleic acid; ALA, α-linolenic acid; HUFAs, highly unsaturated fatty acids.
FIGURE 5.
Changes in ratios of n−6 to n−3 fatty acids in the US food supply from 1909 to 1999. Linoleic acid (LA)/α-linolenic acid (ALA) is indicated by a solid line, total n--6/total n--3 fatty acids by a dashed gray line, and n--6 highly unsaturated fatty acids (HUFA)/n--3 HUFAs by a dotted line. 1909-T (foods produced by traditional early 20th century practices) data are indicated by the solid arrow for the LA/ALA ratio and by a dashed gray arrow for the ratio of total n−6 to n−3. The LA:ALA ratio was lowest for 1909-T foods (6.4) and highest for 1999 foods (10.0). The ratio of total n−6 to n−3 was 5.4 in 1909-T and 9.6 in 1999.
Changes in sources of LA, ALA, AA, EPA, DPA nminus3, and DHA
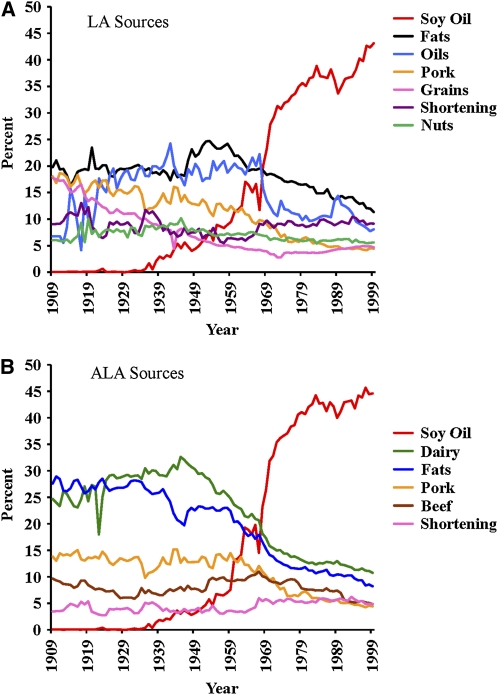
On the basis of the standard CNPP methodology, the main sources of dietary LA in 1909-C were fats (minus shortening), oils (minus soybean oil), pork, grains, shortening, and nuts (Figure 6), although many other foods contributed small amounts (Table 7). ALA in the American diet mostly came from dairy, fats (minus shortening), pork, beef, and shortening. During the 20th century, soybean oil changed from being an insignificant source of LA and ALA (<0.1% of each) to being the primary source of both (43% of total LA and 45% of total ALA) (Table 7 and Table 8). The importance of soybean oil as a source of LA increased >500-fold, whereas for ALA, it increased >1000-fold. In the case of LA, soybean oil replaced all other sources in general. In contrast, soybean oil specifically replaced dairy, fats, and pork as a primary source of ALA.
FIGURE 6.
Sources of linoleic acid (LA) (A) and α-linolenic acid (ALA) (B) between 1909 and 1999. Fats included shortening, butter, lard, margarine, and beef tallow. Oils included cottonseed, corn, olive, coconut, canola, peanut, palm, safflower, sunflower, and sesame oils. Soybean oil was considered separately because of its disproportionate effect. Dairy included all milk, buttermilk, condensed milk, cream, sour cream, yogurt, cheese, and eggnog. Butter was not included in the dairy category to avoid double counting.
TABLE 7.
Sources of linoleic acid
| Food category | Percentage contribution |
Percentage difference | |
| 1909 | 1999 | ||
| Soybean oil | 0.076 | 43.11 | 56,791 |
| Spice | 0.085 | 0.7 | 730 |
| Poultry | 3.92 | 7.12 | 82 |
| Oils | 6.74 | 8.06 | 20 |
| Shortening | 9.03 | 9.14 | 1.2 |
| Nuts | 6.02 | 5.62 | −6.7 |
| Fats | 19.78 | 11.31 | −43 |
| Shellfish | 0.0085 | 0.0037 | −57 |
| Game | 0.1 | 0.04 | −58 |
| Fruit | 1.1 | 0.43 | −61 |
| Vegetables | 2.17 | 0.77 | −64 |
| Eggs | 3.85 | 1.34 | −65 |
| Dairy | 5.78 | 1.89 | −67 |
| Beef | 3.86 | 1.17 | −70 |
| Grains | 17.74 | 4.67 | −74 |
| Legumes | 0.29 | 0.07 | −75 |
| Pork | 18.03 | 4.45 | −75 |
| Finfish | 0.89 | 0.067 | −92 |
| Sugars | 0.009 | 0.0007 | −92 |
| Lamb | 0.62 | 0.04 | −94 |
| Total | 100 | 100 | — |
TABLE 8.
Sources of α-linolenic acid
| Food category | Percentage contribution |
Percentage difference | |
| 1909 | 1999 | ||
| Soybean oil | 0.041 | 44.58 | 108,869 |
| Oils | 0.39 | 7.93 | 1924 |
| Spice | 0.19 | 1.24 | 547 |
| Poultry | 1.42 | 3.58 | 152 |
| Shortening | 3.45 | 4.81 | 39 |
| Nuts | 2.19 | 2.24 | 3 |
| Sugars | 0 | 0 | 0 |
| Fruit | 1.67 | 1.09 | −35 |
| Vegetables | 4.18 | 2.45 | −41 |
| Game | 0.17 | 0.09 | −49 |
| Beef | 9.65 | 4.82 | −50 |
| Eggs | 0.73 | 0.35 | −52 |
| Grains | 5.85 | 2.67 | −54 |
| Dairy | 24.68 | 10.74 | −57 |
| Shellfish | 0.057 | 0.02 | −65 |
| Legumes | 1.64 | 0.53 | −68 |
| Pork | 13.81 | 4.4 | −68 |
| Fats | 27.6 | 8.21 | −70 |
| Finfish | 0.87 | 0.13 | −85 |
| Lamb | 1.42 | 0.12 | −91 |
| Total | 100 | 100 | — |
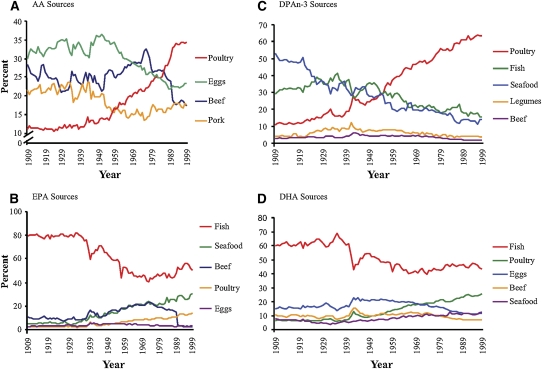
There has been little change in the sources of other essential fatty acids (Figure 7). Dietary AA came primarily from poultry, eggs, beef, and pork, with the contribution from poultry increasing 211%, from eggs decreasing 22%, and from beef decreasing 39% (Table 9). EPA and DHA were obtained primarily from finfish, with smaller amounts from shellfish, poultry, eggs, and beef. Contributions from poultry and shellfish have been increasing, whereas contributions from finfish and beef have been decreasing (Tables 10 and 11). DPA n−3 came from poultry, finfish, shellfish, and beef. The increased estimated per capita consumption of poultry led to an increase in its role as a source of DPA n−3 (5-fold) (Table 12). Although there has been little change in the estimated per capita consumption of finfish, its importance as a source of DPA n−3 has decreased by 47%.
FIGURE 7.
Sources of arachidonic acid (AA) (A), eicosapentaenoic acid (EPA) (B), docosapentaenoic acid (DPAn−3) (C), and docosahexaenoic acid (DHA) (D) from current foods between 1909 and 1999.
TABLE 9.
Sources of arachidonic acid1
| Food category | Percentage contribution |
Percentage difference | |
| 1909 | 1999 | ||
| Poultry | 11.08 | 34.43 | 211 |
| Fruit | 0.008 | 0.025 | 204 |
| Shellfish | 1.05 | 1.95 | 86 |
| Legumes | 0 | 0 | 0 |
| Nuts | 0 | 0 | 0 |
| Soybean oil | 0 | 0 | 0 |
| Shortening | 0 | 0 | 0 |
| Fats | 0 | 0 | 0 |
| Sugars | 0 | 0 | 0 |
| Finfish | 3.04 | 2.66 | −13 |
| Game | 2.06 | 1.77 | −14 |
| Pork | 21.48 | 17.73 | −17 |
| Eggs | 29.86 | 23.18 | −22 |
| Oils | 0.59 | 0.39 | −34 |
| Beef | 28.4 | 17.38 | −39 |
| Grains | 0.07 | 0.03 | −59 |
| Vegetables | 0.15 | 0.05 | −66 |
| Lamb | 2.22 | 0.36 | −84 |
| Spice | 0 | 0.0058 | NA |
| Dairy | 0 | 0.03 | NA |
| Total | 100 | 100 | — |
NA, not applicable.
TABLE 10.
Sources of eicosapentaenoic acid1
| Food category | Percentage contribution |
Percentage difference | |
| 1909 | 1999 | ||
| Poultry | 2.23 | 13.68 | 514 |
| Shellfish | 5.1 | 30.43 | 496 |
| Eggs | 2.76 | 3 | 9 |
| Finfish | 79.37 | 50.63 | −36 |
| Beef | 10.54 | 2.25 | −79 |
| Game | 0 | 0.009 | NA |
| Total | 100 | 100 | — |
NA, not applicable.
TABLE 11.
Sources of docosapentaenoic acid1
| Food category | Percentage contribution |
Percentage difference | |
| 1909 | 1999 | ||
| Poultry | 10.59 | 63.65 | 501 |
| Legumes | 4.29 | 3.99 | −7 |
| Beef | 3.02 | 1.84 | −39 |
| Finfish | 28.97 | 15.38 | −47 |
| Shellfish | 53.13 | 13.92 | −74 |
| Game | 0 | 0.26 | NA |
| Oils | 0 | 0.94 | NA |
| Spice | 0 | 0.03 | NA |
| Total | 100 | 100 | — |
NA, not applicable.
TABLE 12.
Sources of docosahexaenoic acid1
| Food category | Percentage contribution |
Percentage difference | |
| 1909 | 1999 | ||
| Poultry | 6.64 | 25.42 | 283 |
| Shellfish | 8.12 | 12.49 | 54 |
| Eggs | 14.75 | 11.78 | −20 |
| Finfish | 59.99 | 43.39 | −28 |
| Beef | 10.49 | 6.84 | −35 |
| Game | 0 | 0.10 | NA |
| Total | 100 | 100 | — |
NA, not applicable.
Changes in the estimated composition of HUFAs in tissue membranes
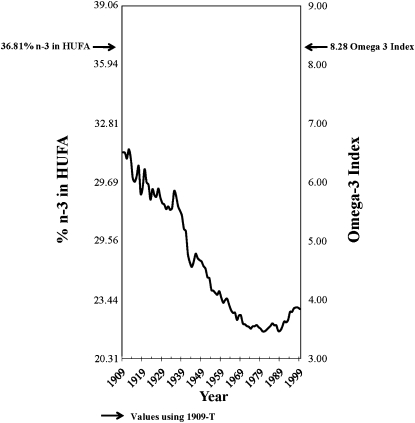
With the use of standard CNPP methods to compared 1909-C to 1999 diets, the predicted percentage of n−3 in HUFAs decreased 27% from 31.28% to 22.95% (Figure 8, Table 6), whereas the estimated omega-3 index decreased 41% from 6.51 to 3.84. With the use of the nutrient-composition data sets to compare 1909-T to 1999 diets, the percentage of n−3 in HUFAs decreased 38%, from 36.81% to 22.95%, and the omega-3 index decreased 54% from 8.28 to 3.84.
FIGURE 8.
Omega-3 tissue highly unsaturated fatty acid (HUFA) predictions over the 20th century. Solid arrows indicate the percentage of n−3 in HUFA (36.8%) and the estimated omega-3 index (8.3) calculated from available nutrient intakes for 1909 traditional foods (1909-T).
Source of change in the estimated composition of nminus3 HUFAs in tissues membranes over time
The series of 6 additional plots that used the LA percentage of energy data input into the tissue equation of Lands et al (2) for the prediction of the percentage of n−3 in HUFAs closely resembled the results of the original prediction function that used the actual historical data (Figure 9A). The series of plots that used the ALA percentage of energy data indicated that changes in ALA did not contribute much to the predicted changes in the percentage of n−3 in HUFAs compared with in LA (Figure 9B).
FIGURE 9.
Time-series determination of the dependence of the percentage of n−3 in highly unsaturated fatty acids (HUFA) on linoleic acid (LA) (A) compared with on α-linolenic acid (ALA) (B). Slopes of suggested regression lines between contrived series plots (dashed lines) and original functions (bold lines) were similar in direction and magnitude for LA. For ALA, slopes of regression lines were opposite in direction and lower in magnitude than the original prediction plot. Therefore, the tissue percentage of n−3 in HUFA was dependent on changes in dietary LA rather than in ALA.
DISCUSSION
The most striking modification of the US food supply during the 20th century was the >1000-fold increase in the estimated per capita consumption of soybean oil from 0.006% to 7.38% of energy. The increased soybean oil availability produced increases in dietary LA that exceeded changes in all other essential fatty acids. This finding was confirmed by specimen analyses. The LA content of mature breast milk from American women increased from 6% to 7% to 15–16% of total fatty acids between 1945 and 1995 (23), whereas the LA content of adipose tissue increased from ≈6% in 1960 (24, 25) to 18% in 1986 (26). The ALA availability also increased substantially between 1909 and 1999 as a consequence of increased seed -oil consumption. Although the consumption of finfish and shellfish increased on a kilogram per capita basis, total n−3 HUFAs as a percentage of total calories changed only slightly. These data do not support the assertion that the consumption of total n−3 fatty acids has decreased or that the ratio of n−6 to n−3 has markedly increased during the 20th century. With the use of 1909-T data, the dietary availability of n−3 HUFAs and AA decreased compared with the availability in 1999. We estimated that the net effect of these dietary changes, primarily because of changes in the availability of LA, was to lower the n−3 EPA, DPA n−3, and DHA status of human tissues, which were expressed as either the percentage of n−3 in HUFAs or the omega-3 index.
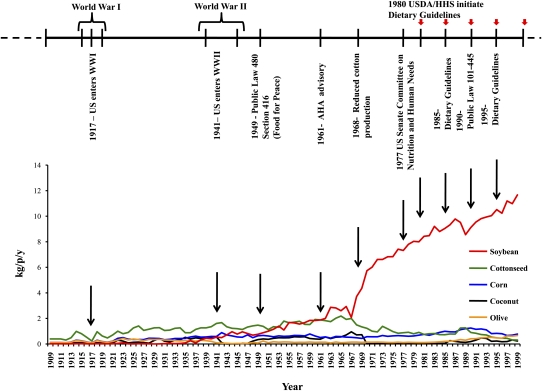
The majority of the increase in soybean oil consumption occurred in the latter half of the 20th century (1946–1999; Figure 1C). No single cause can be identified for this staggering rise. Rather, the increase was likely attributable to a combination of factors, including the following: 1) the desirable characteristics of soybeans as a crop (27), such as high yields and the nitrogen-fixing capability; 2) the expanded processing techniques for seed oils, such as solvent extraction and partial hydrogenation (28); 3) the increased demand for soybean meal (but not oil) as a preferred protein for the industrial-scale production of livestock and poultry, with excess oil as a byproduct (28–30); 4) the decreased competition from cottonseed oil as synthetic alternatives (eg, polyester) reduced the demand for cotton fiber (30); 5) price-support policies, such as Public Law 480, which decreased the economic risk for US soybean farmers and processors (30); 6) aggressive and successful marketing campaigns by trade groups (31); and 7) recommendations to consume more polyunsaturated oils at the expense of animal fats (32) (Figure 10).
FIGURE 10.
The historical event immediately preceding the largest increase in apparent consumption of soy oil in the United States was the 1961 American Heart Association (AHA) Central Committee Advisory Statement (32) that advised Americans to replace their saturated fat intake with polyunsaturated fats. Vegetable oils and, to a lesser extent, shortening and margarine were recommended as replacements for animal fats such as butter, cream, and cheese. kg/p/y, kilograms per person per year; WWI, World War I; WWII, World War II; USDA/HHS, US Department of Agriculture/US Department of Health and Human Services.
Our results from time-series analyses indicated that the increase in LA was the primary determinant of the declining percentages of n−3 in HUFAs in tissue throughout the 20th century, as shown in Figure 8. A high dietary LA consumption may reduce the contents of tissue EPA, DPA n−3, and DHA by the following 3 mechanisms: 1) the impairment of the conversion of ALA (18:3n−3) to 18:4n−3 and EPA (20:5n−3) by competing for the active site of Δ6-desaturase (33), 2) the impairment of the conversion of 24:5n−3–24:6n−3 by competing for the active site of Δ6-desaturase in the endoplasmic reticulum (34, 35), which inhibits the production of DHA (22:6n−3); and 3) the impairment of the incorporation of EPA, DPA n−3, DHA, and n−6 AA into tissue membranes by competing for esterification into the sn-2 position of phospholipids (36). The competition of LA with n−3 and n−6 HUFAs for phospholipid incorporation may account for the significant inverse correlation of LA with EPA (r = −0.46, P < 0.01), DHA (r = −0.49, P < 0.01), and AA (r = −0.60, P < 0.01) shown in erythrocyte phosphatidylcholine of pregnant Canadians as reported by Friesen and Innis (36). In the Los Angeles Veterans Study, a very high–LA diet (15% of energy) reduced AA concentrations by 40% (P < 0.05) in coronary atheroma phospholipids (37), presumably via the same mechanism. Thus, high dietary intakes of LA may displace AA in tissues, which may account for the potential benefits of LA at very high intakes. However, because LA may also displace EPA and DHA, net effects may be nonlinear and difficult to predict.
A randomized trial that compared the effects of infant formulas with high LA (6.7% of energy) compared with low LA (1.7% of energy) on infant tissue n−3 EPA and DHA (38) further indicated that a high-LA intake decreases tissue n−3 HUFA status. Infants in the low-LA group, compared with infants who received the high-LA formula, had 228% higher EPA (1.28% of weight compared with 0.39% of weight, respectively) and 29% higher DHA (4.48% of weight compared with 3.47% of weight, respectively) in erythrocyte membrane phospholipids. The erythrocyte EPA + DHA (omega-3 index) was 1.90 points higher in the low-LA group. To put this in perspective, an adult who consumes a 2000-kcal diet needs ≈750 mg dietary n−3 HUFAs/d to increase the omega-3 index by 2 points (4). In adults with enteral feeding, the lowering of LA from 13% to 4% of energy increased the calculated omega-3 index by 7 points (39). The lowering of dietary LA to resemble intakes in the early 20th century (≈2% of energy) may help Americans restore tissue n−3 HUFAs while simultaneously reducing pressure on fish stocks (40). The relevance to health of LA-induced declines in tissue n−3 HUFAs has not been confirmed. We caution that the data are limited and mixed regarding whether an increase in LA consumption has the same effects on chronic illness in humans as a decrease in n−3 HUFA consumption. Net benefits and risks of seed oils, at high and low intakes, require further clinical assessments.
Strengths and weaknesses
The method of using food-availability data paired with nutrient-content information to evaluate the average American diet has important strengths and weaknesses. Food-availability data are the sole resource available to assess annual trends in consumption over long periods of time and include only foods used for human consumption. However, these data do not reflect subpopulations. By comparison, survey data are recent, sparse, often dependent on inadequate dietary recalls, and not annually available by using similar methodologies. The congruence between contemporary estimates on the basis of survey data for intakes for n−6 and n−3 essential fatty acids (as a percentage of energy) and the values reported in the present study supported the validity of our methodology (Table 13).
TABLE 13.
Comparison of methodologies to estimate consumption of essential fatty acids1
| LA | ALA | AA | EPA | DPA n−3 | DHA | |
|
% of energy |
||||||
| Our methods | 7.206 | 0.721 | 0.051 | 0.011 | 0.006 | 0.022 |
| NHANES 2005–2006 | 6.247 | 0.593 | 0.061 | 0.017 | 0.007 | 0.034 |
LA, linoleic acid; ALA, α-linolenic acid; AA, arachidonic acid; EPA, eicosapentaenoic acid; DPA n−3, docosapentaenoic acid; DHA, docosahexaenoic acid; NHANES, National Health and Nutrition Examination Survey.
We caution that food-availability data only measure apparent consumption but not direct measures of actual food and nutrient intakes. Furthermore, the waste portion of fats and oils has likely increased as the number of meals eaten away from home has grown in the past 3 decades and more “restaurant grease,” particularly that left over from deep frying, is discarded (41). It has been estimated that ≤10% of the total annual apparent consumption of fats and oils is due to restaurant waste (13). Overall, commodity disappearance data typically overestimate food consumption by ≥25% (42) and underestimate foods produced and consumed locally, particularly at the beginning of the century (43).
Rationale for constructing a 1909-T diet
During the 20th century, there was shift in production away from small, family-owned farms to industrial-scale agribusiness operations. Foods produced and consumed in the early 20th century (eg, meats and fats derived from pastured animals) had different essential fatty acid compositions than modern grain-fed poultry and livestock products (14, 16, 44). It is reasonable to assume that there has been a gradient change in essential fatty acid compositions of foods from 1909 to the end of the century that may not have been captured in this dataset; presumably, this roughly corresponded to the increased use of soy and corn in animal feeds. We did not feel confident in the progressive gradient to model year-by-year changes in nutrient composition.
Conclusions
The estimated per capita consumption of soybean oil increased >1000-fold throughout the 20th century. As a consequence, the amount of LA increased >3-fold, and the amount of ALA doubled. Because the amount of ALA increased and amounts of n−3 EPA and DHA remained relatively stable, the total amount of n−3 fatty acids actually increased slightly. However, the net effect of increasing dietary LA, rather than these modest increases in dietary n−3 fatty acids, likely decreased the n−3 EPA and DHA status of human tissues over the 20th century.
Acknowledgments
We thank Shirley Gerrior, Hazel Hiza, and Lisa Bente of the CNPP and Susan Gebhart and Jacob Exler of the USDA Nutrient Data Laboratory for their invaluable help. We also acknowledge Duk Hyun of the Laboratory of Membrane Biochemistry and Biophysics, National Institute on Alcohol Abuse and Alcoholism, National Institutes of Health.
The authors’ responsibilities were as follows—JRH: designed and directed the study; TLB: performed the primary data extraction and analysis with assistance from SFM and CER; TLB, CER, SFM, and JRH: wrote and revised the manuscript; and RRR: conducted the statistical analysis. None of the authors had a conflict of interest.
REFERENCES
- 1.Simopoulos AP. Essential fatty acids in health and chronic disease. Am J Clin Nutr 1999;70(suppl):560S–9S [DOI] [PubMed] [Google Scholar]
- 2.Lands WEM, Libelt B, Morris A, et al. Maintenance of lower proportions of (n−6) eicosanoid precursors in phospholipids of human plasma in response to added dietary (n−3) fatty acids. Biochim Biophys Acta 1992;1180:147–62 [DOI] [PubMed] [Google Scholar]
- 3.SanGiovanni JP, Chew EY, Clemons TE, et al. The relationship of dietary lipid intake and age-related macular degeneration in a case-control study: AREDS Report No. 20. Arch Ophthalmol 2007;125:671–9 [DOI] [PubMed] [Google Scholar]
- 4.Milte CM, Coates AM, Buckley JD, Hill AM, Howe PR. Dose-dependent effects of docosahexaenoic acid-rich fish oil on erythrocyte docosahexaenoic acid and blood lipid levels. Br J Nutr 2008;99:1083–8 [DOI] [PubMed] [Google Scholar]
- 5.Rao JS, Lee HJ, Rapoport SI, Bazinet RP. Mode of action of mood stabilizers: is the arachidonic acid cascade a common target? Mol Psychiatry 2008;13:585–96 [DOI] [PubMed] [Google Scholar]
- 6.Leaf A. Prevention of sudden cardiac death by n−3 polyunsaturated fatty acids. J Cardiovasc Med (Hagerstown) 2007;8(suppl 1):S27–9 [DOI] [PubMed] [Google Scholar]
- 7.IBD in EPIC Study Investigators. Tjonneland A, Overvad K, et al. Linoleic acid, a dietary n−6 polyunsaturated fatty acid, and the aetiology of ulcerative colitis: a nested case-control study within a European prospective cohort study. Gut 2009;58:1606–11 [DOI] [PubMed] [Google Scholar]
- 8.Samieri C, Feart C, Letenneur L, et al. Low plasma eicosapentaenoic acid and depressive symptomatology are independent predictors of dementia risk. Am J Clin Nutr 2008;88:714–21 [DOI] [PubMed] [Google Scholar]
- 9.Hibbeln JR. Depression, suicide and deficiencies of omega-3 essential fatty acids in modern diets. World Rev Nutr Diet 2009;99:17–30 [DOI] [PubMed] [Google Scholar]
- 10.Harris WS. The omega-3 index as a risk factor for coronary heart disease. Am J Clin Nutr 2008;87:1997S–2002S [DOI] [PubMed] [Google Scholar]
- 11.Hibbeln JR, Davis JM. Considerations regarding neuropsychiatric nutritional requirements for intakes of omega-3 highly unsaturated fatty acids. Prostaglandins Leukot Essent Fatty Acids 2009;81:179–86 [DOI] [PMC free article] [PubMed] [Google Scholar]
- 12.Lands B. Measuring blood fatty acids as a surrogate indicator for coronary heart disease risk in population studies. World Rev Nutr Diet 2009;100:22–34 [DOI] [PubMed] [Google Scholar]
- 13.Gerrior S, Bente L, Hiza H. Nutrient content of the US food supply, 1909-2000. Home Economics Research Report No. 56. Alexandria, VA: US Department of Agriculture, Center for Nutrition Policy and Promotion, 2004 [Google Scholar]
- 14.Crawford MA. Fatty-acid ratios in free-living and domestic animals. Possible implications for atheroma. Lancet 1968;1:1329–33 [DOI] [PubMed] [Google Scholar]
- 15.Cordain L, et al. Origins and evolution of the Western diet: health implications for the 21st century. Am J Clin Nutr 2005;81:341–54 [DOI] [PubMed] [Google Scholar]
- 16.Simopoulos AP, Salem N., Jr n−3 Fatty acids in eggs from range-fed Greek chickens. N Engl J Med 1989;321:1412. [DOI] [PubMed] [Google Scholar]
- 17.Economic Research Service (ERS), US Department of Agriculture (USDA) Available from: http://www.ers.usda.gov.
- 18.US Department of Agriculture, Agricultural Research Service, Nutrient Data Laboratory USDA National Nutrient Database for Standard Reference, Release 19. Washington, DC: USDA, 2006 [Google Scholar]
- 19.Brown RL, Durbin J, Evans JM. Techniques for testing the constancy of regression relationships over time. J R Stat Soc Series B Stat Methodol 1975;37:149–92 [Google Scholar]
- 20.Folch J, Lees M, Sloane Stanley GH. A simple method for the isolation and purification of total lipides from animal tissues. J Biol Chem 1957;226:497–509 [PubMed] [Google Scholar]
- 21.Morrison WR, Smith LM. Preparation of fatty acid methyl esters and dimethylacetals from lipids with boron fluoride–methanol. J Lipid Res 1964;5:600–8 [PubMed] [Google Scholar]
- 22.Masood A, Stark KD, Salem N., Jr A simplified and efficient method for the analysis of fatty acid methyl esters suitable for large clinical studies. J Lipid Res 2005;46:2299–305 [DOI] [PubMed] [Google Scholar]
- 23.Ailhaud G, Guesnet P. Fatty acid composition of fats is an early determinant of childhood obesity: a short review and an opinion. Obes Rev 2004;5:21–6 [DOI] [PubMed] [Google Scholar]
- 24.Kingsbury KJ, et al. The effect of dietary changes on the fatty acid composition of normal human depot fat. Biochem J 1962;84:124–33 [DOI] [PMC free article] [PubMed] [Google Scholar]
- 25.Kingsbury KJ, Paul S, Crossley A, Morgan DM. The fatty acid composition of human depot fat. Biochem J 1961;78:541–50 [DOI] [PMC free article] [PubMed] [Google Scholar]
- 26.Garland M, et al. The relation between dietary intake and adipose tissue composition of selected fatty acids in US women. Am J Clin Nutr 1998;67:25–30 [DOI] [PubMed] [Google Scholar]
- 27.USDA ERS Soybeans and oil crops: background. 2010. Available from: http://www.ers.usda.gov/briefing/soybeansoilcrops/background.htm(cited 19 March 2010)
- 28.Willemin R. Soybean pattern of strength and weakness repeated. J Am Oil Chem Soc 1959;36:6 [Google Scholar]
- 29.Bunnell D. U.S. soybean oil in world markets. J Am Oil Chem Soc 1959;36:10–7 [Google Scholar]
- 30.Malone P. A guide for forecasting soybean futures prices. J Am Oil Chem Soc 1968;45:150A [Google Scholar]
- 31.American Soybean Association. ASA history highlights. Available from: http://www.soygrowers.com/history/ (cited 23 February 2010.)
- 32.Dietary fat and its relation to heart attacks and strokes Report by the Central Committee for Medical and Community Program of the American Heart Association. JAMA 1961;175:389–91 [PubMed] [Google Scholar]
- 33.Holman RT. The slow discovery of the importance of omega 3 essential fatty acids in human health. J Nutr 1998;128(suppl):427S–33S [DOI] [PubMed] [Google Scholar]
- 34.Nakamura MT, Nara TY. Essential fatty acid synthesis and its regulation in mammals. Prostaglandins Leukot Essent Fatty Acids 2003;68:145–50 [DOI] [PubMed] [Google Scholar]
- 35.Kitson AP, Stroud CK, Stark KD. Elevated production of docosahexaenoic acid in females: potential molecular mechanisms. Lipids 2010;45:209–24 [DOI] [PubMed] [Google Scholar]
- 36.Friesen RW, Innis SM. Linoleic acid is associated with lower long-chain n−6 and n−3 fatty acids in red blood cell lipids of Canadian pregnant women. Am J Clin Nutr 2010;91:23–31 [DOI] [PubMed] [Google Scholar]
- 37.Dayton S, Hashimoto S, Pearce ML. Influence of a diet high in unsaturated fat upon composition of arterial tissue and atheromata in man. Circulation 1965;32:911–24 [DOI] [PubMed] [Google Scholar]
- 38.Clark KJ, Makrides M, Neumann MA, Gibson RA. Determination of the optimal ratio of linoleic acid to alpha-linolenic acid in infant formulas. J Pediatr 1992;120:S151–8 [DOI] [PubMed] [Google Scholar]
- 39.Munakata M, Nishikawa M, Togashio N, et al. The nutrient formula containing eicosapentaenoic acid and docosahexaenoic acid benefits the fatty acid status of patients receiving long-term enteral nutrition. Tohoku J Exp Med 2009;217:23–8 [DOI] [PubMed] [Google Scholar]
- 40.Hibbeln JR, Nieminen LR, Blasbalg TL, Riggs JA, Lands WE. Healthy intakes of n−3 and n−6 fatty acids: estimations considering worldwide diversity. Am J Clin Nutr 2006;83(suppl):1483S–93S [DOI] [PubMed] [Google Scholar]
- 41.Hall KD, Guo J, Dore M, Chow CC. The progressive increase of food waste in America and its environmental impact. PLoS ONE 2009;4:e7940. [DOI] [PMC free article] [PubMed] [Google Scholar]
- 42.Kantor LS, Lipton K, Manchester A, Oliveira V. Estimating and addressing America's food losses. Food Rev 1997;20:2–12 [Google Scholar]
- 43.Call DL. Trends in fat disappearance in the United States, 1909-65. J Nutr 1967;. 93(suppl):1–28 [DOI] [PubMed] [Google Scholar]
- 44.Dannenberger D, Nuernberg G, Scollan N, Ender K, Nuernberg K. Diet alters the fatty acid composition of individual phospholipid classes in beef muscle. J Agric Food Chem 2007;55:452–60 [DOI] [PubMed] [Google Scholar]


