Abstract
Background
A comprehensive evaluation of myocardial ischemia requires measures of both oxygen supply and demand. Positron emission tomography (PET) is currently the gold standard for such evaluations, but its use is limited due to its ionizing radiation, limited availability, and high cost. A cardiac magnetic resonance imaging (MRI) method was developed for assessing myocardial oxygenation. The purpose of this study was to evaluate and validate this technique compared to PET during pharmacologic stress in a canine model of coronary artery stenosis.
Methods and Results
Twenty-one beagles and small mongrel dogs without coronary artery stenosis (controls), or with moderate to severe acute coronary artery stenosis underwent MRI and PET imaging at rest and during dipyridamole vasodilation or dobutamine stress to induce a wide range of changes in cardiac perfusion and oxygenation. MRI first-pass perfusion imaging was performed to quantify myocardial blood flow (MBF) and volume (MBV). The MRI blood-oxygen-level-dependent (BOLD) technique was used to determine the myocardial oxygen extraction fraction (OEF) during pharmacologic hyperemia. Myocardial oxygen consumption (MVO2) was determined by Fick’s law. In the same dogs, 15O-water and 11C-acetate were used to measure MBF and MVO2, respectively, by PET. Regional assessments were performed for both MR and PET. MRI data correlated nicely with PET values for MBF (R2 = 0.79, P < 0.001), MVO2 (R2 = 0.74, P < 0.001), and OEF (R2 = 0.66, P < 0.01).
Conclusions
Cardiac MRI methods may provide an alternative to radionuclide imaging in settings of myocardial ischemia. Our newly developed quantitative MRI oxygenation imaging technique may be a valuable non-invasive tool to directly evaluate myocardial energetics and efficiency.
Keywords: magnetic resonance imaging, perfusion, ischemia, oxygen consumption
Adequate oxygenation is fundamental to myocardial health. The balance of oxygen supply (myocardial blood flow [MBF]) and oxygen demand (myocardial oxygen consumption [MVO2]) is the central pathological tenet of myocardial ischemia. Conversely, luxuriant MVO2 compared to level of cardiac work is indicative of reduced cardiac efficiency, a common finding in most forms of heart failure.1 Therefore, accurate measurements of the key components of myocardial oxygenation, including MBF, MVO2, and fractional oxygen extraction (OEF), are needed to better understand the pathophysiology of these various disease processes. This knowledge may lead to new diagnostic strategies and could facilitate the evaluation of therapies designed to improve oxygen supply/demand imbalances or improve energy transduction.
To date, positron emission tomography (PET) has been used to provide these measurements, with 15O-water to measure MBF,2 and 11C-acetate to determine MVO2.3 However, ionizing radiation, long scan times, limited availability, requirement of an on-site cyclotron, and high costs have limited PET’s widespread use for these purposes. Because of the physical half-life of the radiotracers and concerns about radiation exposure, measurements are typically limited to only two time points, such as rest and low-level catecholamine stress. Additionally, PET cannot assess myocardial blood volume (MBV), another important parameter of myocardial oxygen supply.4
In contrast, magnetic resonance imaging (MRI) does not use ionizing radiation, requires relatively short scan times, is more readily available and at lower cost, and is relatively fast and reproducible. Thus, it is optimal for serial assessments of myocardial oxygenation. We have developed a variety of MRI techniques for evaluating MBF5–6, MBV7, OEF8–9, and MVO2 10 through a combination of first-pass perfusion and blood-oxygen-level-dependent (BOLD) methods. In this study, we utilized these techniques to evaluate the regional changes in myocardial perfusion and oxygenation induced by an acute coronary artery stenosis at rest and during pharmacologic hyperemia. The MRI measurements were validated against those obtained by PET imaging. Dipyridamole and dobutamine were used in dogs with or without moderate to severe coronary artery stenosis to induce a wide range of myocardial perfusion and oxygenation changes.
Methods
Study Protocol
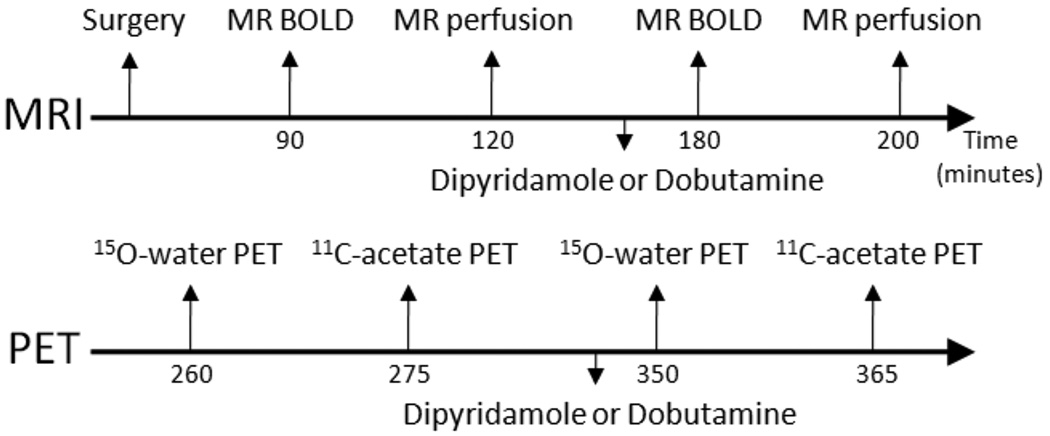
All animal protocols were approved by the Animal Studies Committee at Washington University. The study was performed in 21 beagle and small mongrel dogs (average weight 9.4 ± 1.9 kg), divided into 5 groups, as shown in Table 1. The study protocol is shown in Figure 1. Pharmacologic stress was performed with intravenous dipyridamole (Bedford Laboratories, Bedford, OH) or intravenous dobutamine (Abbott Labs., Chicago, IL). Dipyridamole was infused at a rate of 0.14 mg · min−1 · kg−1 body weight, for 4 minutes. Dobutamine was started at a dose of 5 µg · min−1 · kg−1 body weight, and titrated at 5 µg · min−1 · kg−1 intervals every 3 minutes until the rate-pressure product was approximately doubled compared to rest (maximum dose of 30 µg · min−1 · kg−1 body weight). Dobutamine doses were typically the same during MR and PET scans, but were occasionally optimized to retain similar hemodynamic states between the two imaging modalities; the average dobutamine dose was 20 µg · min−1 · kg−1 during both MR and PET scans.
Table 1.
Dog Treatment Groups
| Group (n) | Coronary Stenosis | Stressor |
|---|---|---|
| 1 (3) | None (Control) | Dipyridamole |
| 2 (4) | Severe (95%) | Dipyridamole |
| 3 (3) | None (Control) | Dobutamine |
| 4 (4) | Moderate (75%) | Dobutamine |
| 5 (7) | Severe (95–100%) | Dobutamine |
Stenosis severity is % lumen area reduction.
Figure 1.
Study protocol. Control dogs did not undergo surgical preparation. MRI and PET were performed sequentially. BOLD, blood-oxygen-level-dependent.
Animal Preparation and Surgery
Dogs were anesthetized with intravenous sodium thiopental (12.5 mg · kg−1), intubated with an endotracheal tube, and then ventilated with 100% oxygen at a tidal volume of 12 ml · kg−1 at a rate of 15–20 breaths/minute. The animals were monitored continuously and anesthesia was maintained with ventilated 1–2% Isoflurane. Bilateral femoral arterial and venous cut-downs were performed and an arterial catheter was connected to a fluid-filled transducer for blood pressure monitoring. Another catheter was placed in a femoral vein for the administration of fluids and dipyridamole or dobutamine.
The procedures for setting the coronary artery stenosis clamp were described previously.11 Briefly, a thoracotomy was performed in the fourth left intercostal space and the pericardium was incised. The left anterior descending coronary artery (LAD) was dissected free distal to the first diagonal branch, and small arterial branches were ligated to provide a 1–2 cm length for instrumentation. The artery was instrumented with, in a proximal-distal order, a Doppler flow probe, a pneumatic occluder, and a homemade MR-compatible stenosis clamp. Serial 20-second occlusions were performed to determine the hyperemic flow response. After tightening the stenosis clamp, another occlusion was performed to assess the decrease in the hyperemic flow response. After attaining the desired level of stenosis defined by reduction in hyperemic flow,11 the occluder and Doppler probe were removed, leaving only the MR-compatible stenosis clamp on the artery. Group 4 dogs with moderate stenosis had approximately 75% reduction in the cross-sectional area of the LAD. The two “severe” stenosis groups (groups 2 and 5) had 95–100% LAD reduction in cross-sectional area of the LAD.
After the stenosis severity was set, the dogs’ chests were then closed and evacuated. Control dogs did not undergo thoracotomy surgery. The dogs were then secured onto a plastic bed in the supine position to immobilize the body during transport between the surgical, MRI, and PET imaging suites. PET imaging always occurred after MR imaging as radiation safety measures do not allow “hot” animals to enter the MR imaging suite. After PET imaging, the animals were euthanized while still under anesthesia with an overdose of potassium chloride to arrest the heart.
MRI Methods
MR imaging was performed on a 1.5T Sonata scanner (Siemens Medical Solutions, Erlanger, Germany). A four-element phased array coil placed around the chest was used for signal reception and a body coil was used as a transmitter. Scout imaging was performed to obtain a short-axis image of the left ventricle (LV) at the mid-cavity level. Cine imaging was performed to determine the motionless period of the cardiac cycle. During all MR scans, respiratory motion was eliminated by turning off ventilation at the end of expiration to simulate breath-holding.
MR First-pass Perfusion Imaging
Images during the bolus injection of 15 µmol/kg Gadomer (Bayer Schering Pharma AG, Berlin, Germany), an intravascular contrast agent, were sequestered by a saturation-prepared turbo fast low-angle shot (FLASH) sequence, as described previously5. The short-axis slice of the LV was acquired during mid-diastole; triggered by the R-wave of the electrocardiogram (ECG). 60–80 dynamic images were gathered sequentially in the motionless period of mid-diastole of every RR interval (typically ~400 ms after the R-wave). Other imaging parameters included: TR = 2.5 ms; TE = 1.2 ms; TI = 90 ms; flip angle = 18° FOV = 220 × 138 mm2; matrix size = 128 × 80%; slice thickness = 8 mm; BW = 675 Hz; and image acquisition time window per cardiac cycle = 150 ms.
Gadomer is a synthetic, paramagnetic complex with 24 chelated Gd ions bonded to a dendritic backbone.12 The macro-molecular contrast agent (30–35 kDa) is almost exclusively intravascular and has fast renal retention; therefore, it has rapid clearance (half-life = 11 minutes in dogs).12 The R1 relaxivity is ~13 mM−1s−1, which is 3-fold higher than extravascular contrast agents at 1.5 T.13 Therefore, Gadomer is the optimal contrast agent for use in this study to allow for rapid clearance before BOLD imaging during pharmacologic stress.
MR Oxygenation Imaging
Imaging of myocardial oxygenation was performed with a BOLD sequence that measures myocardial T2 signals as described previously8–9. The imaging sequence for this technique was a multi-contrast 2D segmented turbo spin-echo (TSE) sequence that collected T2-weighted images. To minimize flow artifacts in the left ventricle, a double-inversion-recovery preparation was used to yield black-blood images. The sequence was ECG-triggered with the segmented TSE train placed in the motionless period of mid-diastole to minimize cardiac motion. Imaging parameters included: FOV = 220 × 131 mm2; matrix size = 256 × 156; slice thickness = 8 mm; inversion time = 350–500 ms, segmentation number = 3, depending on the RR interval; and data acquisition time = 24 × RR, or 14.4 s for a typical 600 ms RR interval. Three echo times were used TE1 = 24, TE2 = 48, TE3 = 72. This sequence was executed twice at rest with two different echo spacings (τ = 8 and τ = 12 ms), and multiple times at τ = 8 ms during pharmacologic vasodilation or hyperemia. Further information regarding the MR BOLD methods can be found in the online supplement.
PET Methods
PET imaging was performed on a Focus 220 microPET scanner (Concorde Medical Systems, Knoxville, TN). A transmission scan was first performed with a rod source to ensure proper positioning and to correct for photon attenuation. 15O-water (average 7.5 ± 1.8 mCi) was administered intravenously, and dynamic PET data was acquired for 5 minutes. After ten minutes, which allowed for decay of the 15O-water, 11C-acetate (average 7.8 ± 2.4 mCi) was injected intravenously and dynamic PET data was collected for 30 minutes. Approximately 40 minutes after the resting 11C-acetate scan (to allow for radionuclide decay), the pharmacologic stressor was started, set to the appropriate dose to approximately match the hemodynamics during MRI, and the 15O-water and 11C-acetate protocols were repeated for stress imaging.
Image Analysis
MR Image Analysis
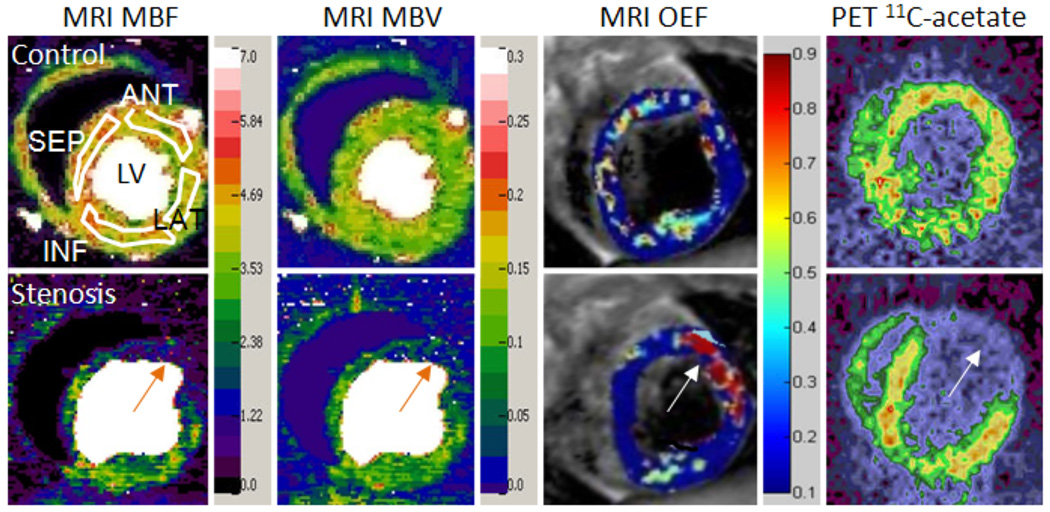
First-pass perfusion images were first analyzed by a non-blinded reviewer with a JAVA program (Java V5.0, Sun Microsystems, Santa Clara, CA) developed in our lab.5 Images were denoised by a wavelet method,14 and then analyzed by a new model-independent perfusion algorithm validated in our lab.5 This algorithm rapidly generated both MBF and MBV maps, on which regions of interest (ROIs) could be drawn. For ease of representation, the fully regional data was averaged in 4 segments: LAD-perfused anterior, lateral, remote inferior and septal myocardial regions. The anterior segment represents perfusion-defected myocardial tissue in stenotic dogs (Figure 2).
Figure 2.
Representative MRI and PET images from one control dog (top row) and one dog given severe LAD stenosis (bottom row), during dipyridamole vasodilation. Four white ROIs on the top left MBF map demonstrate the measured regions. The MRI MBF and MBV maps clearly show the large perfusion deficits caused by a severe coronary stenosis (orange arrows). Both MBF and MBV maps also show reduced perfusion in the remote inferior region compared to the control images. The MRI OEF map shows a region of increased OEF in the ischemic anterior region (arrow), due to greatly reduced perfusion caused by the severe stenosis. The remote regions show a large decrease in OEF, similar to the control dogs. The PET 11C-acetate image, used to determine MVO2, also clearly shows decreased 11C-acetate uptake in the anterior region (arrow), indicating reduced oxygen consumption in the ischemic zone. Left, MRI MBF map; Middle left, MRI MBV map; Middle right, MRI OEF map; Right, PET 11C-acetate image. Ischemic anterior regions are marked by orange arrows. LV, left ventricle; ANT, anterior; LAT, lateral; INF, inferior; SEP, septal; MBF, myocardial blood flow; MBV, myocardial blood volume; OEF, oxygen extraction fraction. MBF units are ml/min/g; MBV units are ml/g.
BOLD T2-weighted images were analyzed with a MATLAB graphics program (The MathWorks, Natick, MA). Pixel-by-pixel maps of the myocardial T2 decay constants were calculated from the T2-weighted signal intensities. Then OEF maps during hyperemia were determined with our previously described model,8–9 on which ROIs similar to the first-pass perfusion map ROIs were drawn. The two T2 maps with different echo spacings at rest were used to determine model parameters for the calculation of OEF during hyperemia. MBV values both at rest and stress, which are required inputs for the OEF calculation, were determined from the first-pass perfusion images. A resting OEF of 0.6 was assumed, which was based on our previous studies of arterial and coronary sinus blood sampling measurements in control dogs at rest (R2 = 0.90),8 as well as PET measurements in dogs with moderate stenosis (R2 = 0.75).10 Resting and hyperemic MVO2 were then estimated by Fick’s law:
| (1) |
The constant [O2]a is defined as the total oxygen content of arterial blood,15 and a value of 7.99 µmol · mL−1 was used. All images were analyzed in a fully regional manner with anterior, lateral, inferior, and septal ROIs assessed in the LV.
PET Image Analysis
The non-gated, attenuation-corrected images were reconstructed with filtered back-projection and transferred to a Sun workstation (Sun Microsystems, Menlo Park, CA). Three image slices that approximately matched the MR slice were selected, and ROIs matching the MR image ROIs were drawn to generate blood and myocardial time-activity curves. MBF was determined by a previously validated compartmental modeling method.2 MVO2 was then determined by a one-compartment kinetic model to estimate the rate at which 11C-acetate was converted to 11CO2.3 Regional OEF was then estimated by Fick’s law (Eq. 1). PET images were analyzed by a second non-blinded reviewer.
Statistical Analysis
Data are reported as mean ± SD. Linear regressions were used to assess the accuracy of the MRI determined values for MBF, MVO2, and OEF measurements compared to those obtained with PET. The correlation data were pooled from data measured on all four myocardial segments. Bland-Altman plots were also used, and percentiles of differences (mean difference ± 1.96 SD) were calculated. Unpaired t-tests were used to determine the significance of differences between MRI and PET measurements. Two-sided P values < 0.05 were considered statistically significant.
Results
Interventions and Hemodynamics
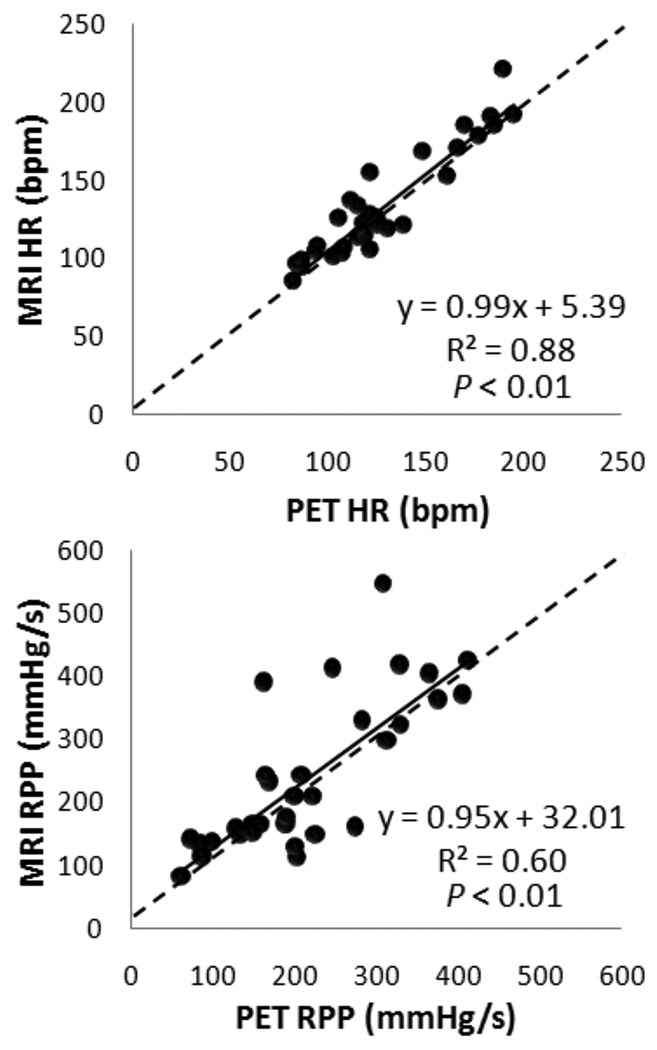
Surgical preparation of animals took an average of 1.5 hours. Hemodynamics at rest and stress appeared comparable for all dogs between the MR and PET imaging sessions (Figure 3). Strong correlation for heart rate was observed with moderate correlation in RPP, which reflects some physiological variations between PET and MRI scan sessions.
Figure 3.
Regression analysis shows good correlation between MR and PET imaging for all dogs for heart rate and rate-pressure product. Solid lines represent the linear fit and dotted lines represent the line of identity. HR, heart rate; RPP, rate-pressure product.
Regional MBF
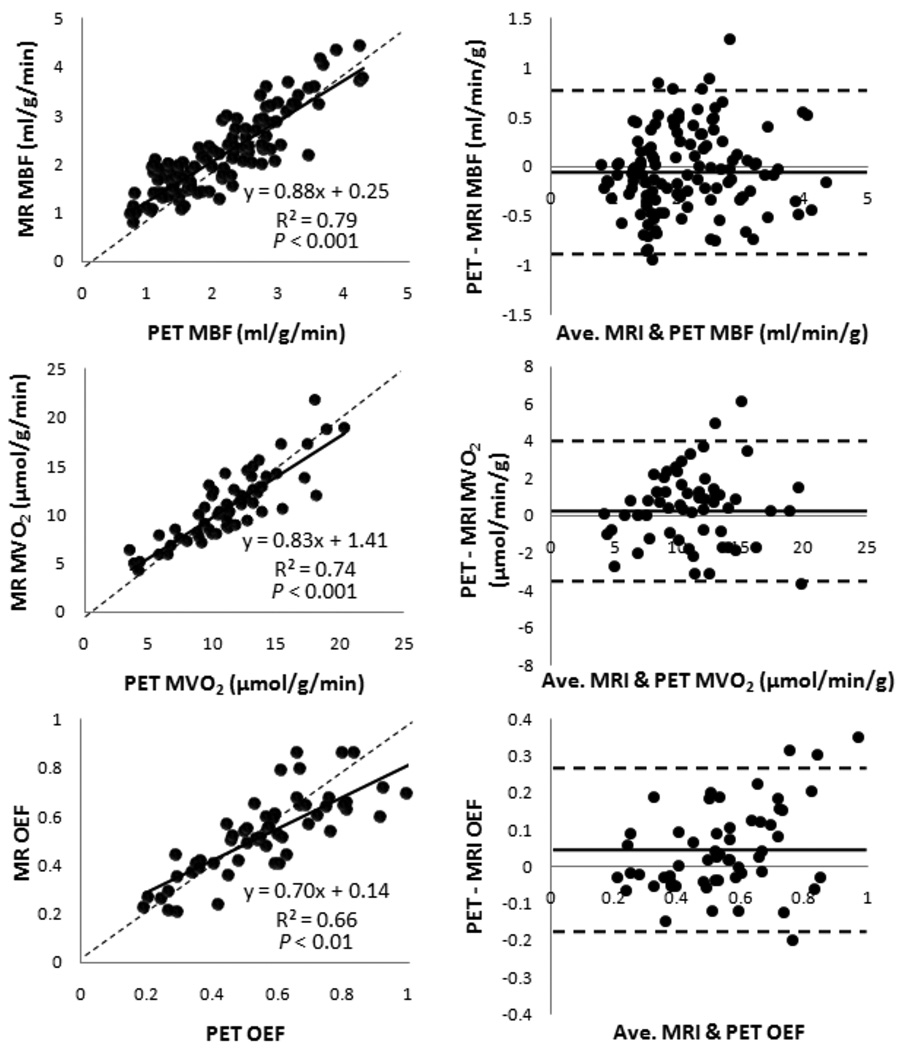
Representative MRI and PET images from a control dog and a dog with a severe LAD stenosis are shown in Figure 2. As expected, increased stenosis severity progressively attenuated the MBF increase during pharmacologically induced hyperemia. With myocardial segment-based analysis, the correlation between MR and PET measurements was strong (slope 0.88, intercept 0.25, r = 0.90, P < 0.001; Figure 4). The Bland-Altman plot shows a mean difference of 0.006 mL/g/min (limits of agreement: −0.76 to 0.77). There was no systematical error in MRI MBF measurements.
Figure 4.
Correlation between MBF, MVO2, and OEF measured with MRI and PET. Left, regression analysis with solid line representing the linear fit and dotted line, the line of identity; Right, Bland-Altman analysis with distribution percentiles of differences (mean difference ± 1.96 SD). Plots contain regional data from all dogs. MBF plots contain rest and stress data; MVO2 and OEF plots contain only stress data because of the assumed rest OEF of 0.6 for MRI. MBF, myocardial blood flow; MVO2, myocardial oxygen consumption; OEF, oxygen extraction fraction.
Regional Myocardial Oxygenation (OEF and MVO2)
The regional MVO2 and OEF data included data during pharmacologic stress only (Figure 4), due to the assumed resting OEF of 0.6 for MRI. The regression plot in MVO2 demonstrated good correlation (slope 0.83, intercept 1.41, r = 0.86, P < 0.001). Bland-Altman analysis showed a mean difference of 0.42 µmol/g/min (limits of agreement: −3.6 to 4.5). For OEF measurements, moderate correlation was observed for MRI measurements in comparison with PET measurements (slope 0.7, intercept 0.14, r = 0.81, P < 0.01), although the relatively low slope indicates slightly systematic underestimation. Bland-Altman analysis showed a mean difference of −0.015 (limits of agreement: −0.28 to 0.25).
Discussion
This study evaluated several MRI techniques for the assessment of myocardial perfusion and oxygenation compared with PET quantification methods in a canine model of coronary artery stenosis. We found that the MR methods provided reasonable estimates of both oxygen supply and demand. With PET as the “gold standard,” MBF, OEF, and MVO2 were quantified and validated with moderate to very good correlations by MRI methods.
The experimental design with various coronary artery stenoses and two pharmacological stressors provided a wide range of changes in MBF (0.74 to 4.3 mL/g/min), OEF (0.19 to 0.9), and MVO2 (2.5 to 20.4 µmol/g/min). In general, the vasodilator dipyridamole can increase MBF three- to four-fold and can substantially reduce myocardial OEF in normal tissue, but it also produces a minimal effect on MVO2. With increasing coronary artery stenosis, the impact of dipyridamole will be less pronounced and reduction of OEF will decline progressively. In contrast, the inotropic agent dobutamine increases MVO2 by increasing cardiac workload, which in turn increases MBF. Small changes in MVO2 with the vasodilator dipyridamole were also observed in our study, possibly due to slight systemic hypotension and reflex tachycardia, which have been reported previously.16 In this study, MBF shows the best correlation between MRI and PET measurements, followed by MVO2 and OEF measurements. This was likely due to the robust measurement of MBF by our well-established perfusion quantification technique.5 The variation observed in MVO2 measurement may be due to measurement errors in MBF and OEF, but also partially related to hemodynamic differences in the dogs between MRI and PET sessions. Notably, Figure 3 shows a moderate correlation coefficient of RPP data between the two studies (r = 0.77), which matches well with the moderate correlation of MVO2 in Figure 4 (r = 0.86).
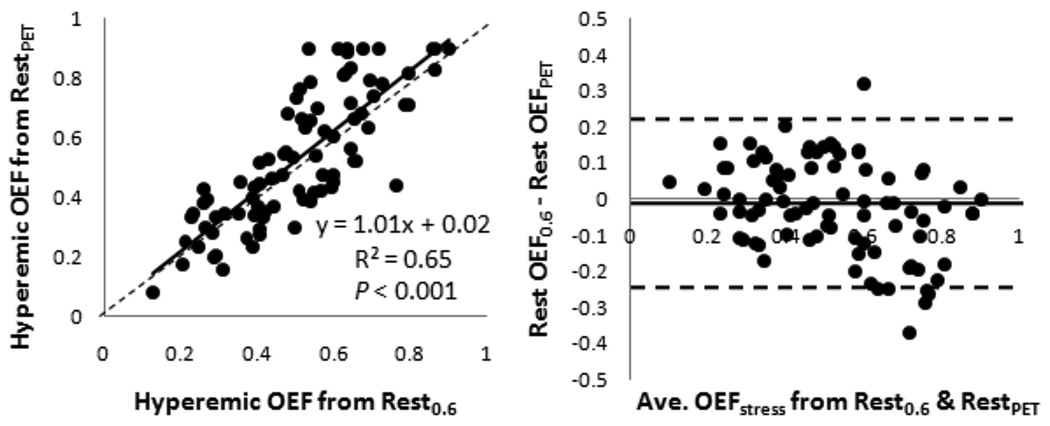
Compared to MBF and MVO2 measurements, OEF showed the greatest dissimilarities between MRI and PET measurements in this study. This was likely due to the assumed resting OEF of 0.6 for MRI, which was determined in an earlier study using arterial and coronary sinus blood gases in control dogs.8 In this study, OEF in the entire left ventricle wall was 0.64 ± 0.17, measured by PET. The slightly lower resting OEF value of 0.6 would result in a lower calculated hyperemic OEF as well, which can be seen from the Bland-Altman analysis in Figure 4, showing that MRI slightly underestimated the hyperemic OEF determined by PET. Again, these differences were not significant, and MR and PET OEF measurements were reasonably well correlated. Additionally, if the MRI hyperemic OEF is calculated using the resting OEF value determined by PET (instead of the assumed 0.6), the calculated MRI hyperemic OEF is not significantly changed (slope 1.01, intercept 0.02, r = 0.81, P < 0.001; Figure 5).
Figure 5.
Correlation between the MRI hyperemic OEF calculated with assumed rest OEF and rest OEF from PET. Left, regression analysis with solid line representing the linear fit and dotted line, the line of identity; Right, Bland-Altman analysis with distribution percentiles of differences (mean difference ± 1.96 SD). OEF, oxygen extraction fraction.
Another issue is the possible interference of the first contrast injection with the pharmacologic stress BOLD imaging. As noted, Gadomer has high renal retention and rapid clearance. With a half-life of 11 minutes in dogs,12 as well as the low dosage of Gadomer, a lag time of 60 minutes before starting the stress BOLD imaging was found to be sufficient to minimize the effect of the first contrast injection. Based on the information from the previous report about the pharmacokinetics of Gadomer,12 it can be estimated that the change in myocardial T2 value due to the contrast injection at 60 min was less than 1.1%, which is well within the myocardial T2 measurement error range (~ 3.5%).8 One limitation to the measurement of perfusion in stenotic dogs is the possible leakage of Gadomer into the extravascular space due to capillary breakdown. We also performed late enhancement analyses in several dogs in groups 2 and 5, and no significant enhancement was observed at rest or during the pharmacologically induced stress, indicating no infarction occurred in this animal ischemia model. It should be noted that our perfusion quantification method used a model-free deconvolution, which may be applicable to the extracellular contrast agent as well. Nevertheless, the effect of Gadomer leakage on the accuracy of the perfusion measurement should be investigated systematically in the future. It is also recognized that the PET scan was always performed after the MRI scan due to the availability of the isotopes at the time of the PET scan and radiation safety issues. This experimental design sequence may introduce systematical errors because the physiological states of the dogs, such as resting MBF, may progressively change. Every effort was made to ensure stability of the heart rate and blood pressure of the dogs during and between the MRI and PET scans (Figure 3).
Conclusions
MRI quantification methods for myocardial oxygenation are promising alternatives to nuclear techniques as they could be utilized for serial assessments of perfusion and oxygenation in settings of regional or global myocardial ischemia. This repeatability could allow for dose response studies necessary for the development of new therapies. In addition, these techniques could easily be coupled with other cardiac MRI methods, such as delayed enhancement and wall-motion analyses, thereby making MRI a valuable “one-stop shop” for imaging regional or global myocardial ischemia.
Myocardial ischemia manifests as an imbalance between myocardial oxygen supply and demand. Cardiac positron-emission tomography (PET) is currently the only imaging modality for absolute quantification of regional myocardial perfusion with 15O-water and oxygen metabolism with 11carbon-acetate. However, the use of PET in this setting is limited due to its low spatial resolution (not suitable for the detection of subendocardial perfusion defects), relatively long acquisition time, limited availability, relative high cost, and ionizing radiation. On the other hand, magnetic resonance imaging (MRI) is a non-invasive imaging modality that is widely available, provides excellent image spatial resolution and soft-tissue contrast and does not require iodinated contrast media or ionizing radiation. In the present study, the technique for assessing myocardial oxygenation was validated against gold standard PET measurements in a large animal model in a clinical 1.5 T MRI scanner. With the rapid image acquisition used in this study, it is possible to integrate our methods with other established cardiac MRI approaches, such as perfusion, myocardial cine, and even delayed enhancement for characterizing ischemic myocardial tissue. This non-radiation method also allows for consecutive monitoring of the myocardium’s dose-responses to various therapeutic interventions. While this MR technique was validated with altered myocardial oxygen status caused by upstream coronary artery stenosis, this method may potentially be used to assess change in MVO2 due to other generalized disease conditions such as hypertension, diabetes, cardiomyopathies, and valvular heart disease.
Supplementary Material
Acknowledgements
The authors wish to thank Pamela Baum, Susannah Grathwohl, Nicholas Perez, Paul Eisenbeis, Amanda Roth, Nicole Fettig, and Terry Sharp for their assistance with animal preparation and PET imaging.
Sources of Funding:
This study was supported by a research grant from the NIH (R01 HL74019-01).
Footnotes
Publisher's Disclaimer: This is a PDF file of an unedited manuscript that has been accepted for publication. As a service to our customers we are providing this early version of the manuscript. The manuscript will undergo copyediting, typesetting, and review of the resulting proof before it is published in its final citable form. Please note that during the production process errors may be discovered which could affect the content, and all legal disclaimers that apply to the journal pertain.
Disclosures:
Dr. Misselwitz is an employee of Bayer Schering Pharma AG, Berlin, Germany. The remaining authors report no conflicts.
References
- 1.Strauer BE. Myocardial oxygen consumption in chronic heart disease: role of wall stress, hypertrophy, and coronary reserve. Am J Cardiol. 1979;44:730–740. doi: 10.1016/0002-9149(79)90295-9. [DOI] [PubMed] [Google Scholar]
- 2.Bergmann SR, Herrero P, Markham J, Weinheimer CJ, Walsh MN. Noninvasive quantitation of myocardial blood flow in human subjects with oxygen-15-labeled water and positron emission tomography. J Am Coll Cardiol. 1989;14:639–652. doi: 10.1016/0735-1097(89)90105-8. [DOI] [PubMed] [Google Scholar]
- 3.Walsh MN, Geltman EM, Brown MA, Henes CG, Weinheimer CJ, Sobel BE, Bergmann SR. Noninvasive estimation of regional myocardial oxygen consumption by positron emission tomography with carbon-11 acetate in patients with myocardial infarction. J Nucl Med. 1989;30:1798–1808. [PubMed] [Google Scholar]
- 4.Le DE, Bin JP, Coggins MP, Wei K, Lindner JR, Kaul S. Relation between myocardial oxygen consumption and myocardial blood volume: a study using myocardial contrast echocardiography. J Am Soc Echocardiogr. 2002;15:857–863. doi: 10.1067/mje.2002.121275. [DOI] [PubMed] [Google Scholar]
- 5.Goldstein TA, Jerosch-Herold M, Misselwitz B, Zhang H, Gropler RJ, Zheng J. Fast mapping of myocardial blood flow with MR first-pass perfusion imaging. Magn Reson Med. 2008;59:1394–1400. doi: 10.1002/mrm.21559. [DOI] [PubMed] [Google Scholar]
- 6.Jerosch-Herold M, Swingen C, Seethamraju RT. Myocardial blood flow quantification with MRI by model-independent deconvolution. Med Phys. 2002;29:886–897. doi: 10.1118/1.1473135. [DOI] [PubMed] [Google Scholar]
- 7.McCommis KS, Goldstein TA, Zhang H, Misselwitz B, Gropler RJ, Zheng J. Quantification of myocardial blood volume during dipyridamole and dobutamine stress: a perfusion CMR study. J Cardiovasc Magn Reson. 2007;9:785–792. doi: 10.1080/10976640701545206. [DOI] [PubMed] [Google Scholar]
- 8.Zheng J, Wang J, Nolte M, Li D, Gropler RJ, Woodard PK. Dynamic estimation of the myocardial oxygen extraction ratio during dipyridamole stress by MRI: a preliminary study in canines. Magn Reson Med. 2004;51:718–726. doi: 10.1002/mrm.20025. [DOI] [PubMed] [Google Scholar]
- 9.Zheng J, Wang J, Rowold FE, Gropler RJ, Woodard PK. Relationship of apparent myocardial T2 and oxygenation: towards quantification of myocardial oxygen extraction fraction. J Magn Reson Imaging. 2004;20:233–241. doi: 10.1002/jmri.20111. [DOI] [PubMed] [Google Scholar]
- 10.McCommis KS, Zhang H, Herrero P, Gropler RJ, Zheng J. Feasibility study of myocardial perfusion and oxygenation by noncontrast MRI: comparison with PET study in a canine model. Magn Reson Imaging. 2008;1:11–19. doi: 10.1016/j.mri.2007.04.009. [DOI] [PMC free article] [PubMed] [Google Scholar]
- 11.Nohara R, Abendschein DR, Bergmann SR. Transmural gradients of coronary flow reserve with physiologically and morphometrically defined stenoses in dogs. Am Heart J. 1989;118:1167–1175. doi: 10.1016/0002-8703(89)90005-7. [DOI] [PubMed] [Google Scholar]
- 12.Misselwitz B, Schmitt-Willich H, Ebert W, Frenzel T, Weinmann HJ. Pharmacokinetics of Gadomer, a new dendritic magnetic resonance contrast agent. MAGMA. 2001;12:128–134. doi: 10.1007/BF02668094. [DOI] [PubMed] [Google Scholar]
- 13.Li D, Zheng J, Weinmann HJ. Contrast-enhanced MRI of coronary arteries: comparison of intra- and extravascular contrast agents in swine. Radiology. 2001;218:670–678. doi: 10.1148/radiology.218.3.r01mr03670. [DOI] [PubMed] [Google Scholar]
- 14.Goldstein TA, Zhang H, Misselwitz B, Gropler RJ, Zheng J. Improvement of quantification of myocardial first-pass perfusion mapping: a temporal and spatial wavelet denoising method. Magn Reson Med. 2006;56:439–445. doi: 10.1002/mrm.20950. [DOI] [PubMed] [Google Scholar]
- 15.Iida H, Rhodes CG, Araujo LI, Yamamoto Y, de Silva R, Maseri A, Jones T. Noninvasive Quantification of Regional Myocardial Metabolic Rate for Oxygen by Use of 15O2 Inhalation and Positron Emission Tomography. Circulation. 1996;94:792–807. doi: 10.1161/01.cir.94.4.792. [DOI] [PubMed] [Google Scholar]
- 16.Bin JP, Pelberg RA, Wei K, Le DE, Goodman NC, Kaul S. Dobutamine versus dipyridamole for inducing reversible perfusion defects in chronic multivessel coronary artery stenosis. J Am Coll Cardiol. 2002;40:167–174. doi: 10.1016/s0735-1097(02)01908-3. [DOI] [PubMed] [Google Scholar]
Associated Data
This section collects any data citations, data availability statements, or supplementary materials included in this article.


