Abstract
Functional electrical stimulation (FES) is a rehabilitation technology that can restore some degree of motor function in individuals that have sustained a spinal cord injury or stroke. One way to identify the spatio-temporal patterns of muscle stimulation needed to elicit complex upper limb movements is to use electromyographic (EMG) activity recorded from able-bodied subjects as a template for electrical stimulation. However, this requires a transfer function to convert the recorded (or predicted) EMG signals into an appropriate pattern of electrical stimulation. Here we develop a generalized transfer function that maps EMG activity into a stimulation pattern that modulates muscle output by varying both the pulse frequency and the pulse amplitude. We show that the stimulation patterns produced by this transfer function mimic the active state measured by EMG insofar as they reproduce with good fidelity complex patterns of joint torque and joint displacement.
1. Introduction
Functional electrical stimulation (FES) is a rehabilitative technology that serves to restore some degree of motor function in paralyzed individuals following spinal cord injury or stroke. FES devices take advantage of the retained electrical excitability of the motor axons that innervate most paretic muscles. This residual function allows for the induction of muscle contraction through artificial stimulation. By stimulating combinations of muscles with a specific temporal pattern, useful motor responses can be elicited. However, identification of such stimulation patterns is difficult because even simple movements involve multiple muscles acting across several joints (Schieber, 1995; Valero-Cuevas, 2000). Thus, a major barrier to implementing flexible control of FES is identifying the complex spatio-temporal patterns of muscle stimulation needed to evoke a large repertoire of movements.
Existing upper-limb FES systems focus on providing a few motor behaviours such as lateral and palmar grasp of the hand (Kilgore et al., 1989). These behaviours are operationally defined by contact forces and segment positions, not by muscle activity per se. Typically, an iterative, qualitative approach is used to identify the final stimulus patterns needed to produce these behaviours (Kilgore et al., 1989) although automated methods have been attempted (Kilgore and Peckham, 1993a). For each muscle, threshold levels (minimum and maximum) of the controlled stimulus parameter (stimulus pulse duration, amplitude, or frequency) are first determined, and stimulus intensity is then varied as a piece-wise, and muscle specific, linear function of a command signal between the two threshold levels. The command signal is derived from a motor function retained by the patient, such as shoulder movements or electromyographic (EMG) activity from an unaffected muscle (Kilgore et al., 1989, 2008). The stimulation patterns across muscles are then tuned to produce the desired outcome (position, grip force, etc.). Once the stimulation patterns are identified, they are stored and subsequently triggered and “played out” in proportion to the magnitude of the command signal.
Another approach has been to use EMG signals recorded in able-bodied subjects as activity templates that can be turned into stimulation patterns (Hoshimiya et al., 1989). The minimum and maximum current levels are determined, and the time-varying EMG signals are linearly mapped to a designated stimulation parameter. This approach is particularly useful when the number of muscles to control is large, as is the case for high-level spinal cord injuries. An additional advantage to this method is that it captures the complex co-activation of prime movers, synergists, antagonists, and stabilizers thought to contribute to smooth, well-controlled movements (Handa and Hoshimiya, 1987). However, the number of allowed behaviours is still limited to the specific set of behaviours that are recorded.
A variation on this method is to predict, rather than record, the muscle activity associated with a desired movement (Seifert and Fuglevand, 2002; Blana et al., 2008; Anderson and Fuglevand, 2008; Johnson and Fuglevand, 2009; Pohlmeyer et al., 2009). Using probabilistic approaches (Seifert and Fuglevand, 2002; Anderson and Fuglevand, 2008; Johnson and Fuglevand, 2009), we have shown that it is possible to identify complex patterns of muscle activity associated with natural movements of the upper limb. The number of different behaviours that can be identified with this method is theoretically unlimited. The challenge with this approach, as well as with the approach used by others (Hoshimiya et al., 1989; Pohlmeyer et al., 2009), relates to how to convert a recorded or predicted pattern of muscle activity into an appropriate stimulus pattern that mimics, to a reasonable degree, the associated time-varying active state of the muscle. The primary purpose of this study, therefore, was to develop a transfer function that transforms predicted EMG signals into stimulation patterns that evoke desired motor behaviours with reasonable fidelity. A secondary goal was to design the transfer function such that it was generalizable across muscles, subjects, and motor tasks in order to minimize the laborious process that would otherwise be necessary to identify such stimulus templates.
2. Methods
2.1. Overview
The objective of this experiment was to artificially recreate the active states of muscles associated with voluntary motor behaviours using electrical stimulation. The normalized amplitude of the rectified EMG signal was used as a measure of muscle active state during voluntary activity (Hof and Van den Berg, 1981; Zajac, 1989; Jacobs et al., 1996). The primary output measured in response to particular patterns of muscle activity (either naturally occurring or electrically induced) was the isometric torque generated about a single joint. We used the interphalangeal joint of the thumb for this purpose as it is controlled by a single extensor muscle, extensor pollicis longus (EPL) and a single flexor muscle, flexor pollicis longus (FPL), and therefore, we could readily record from and stimulate the main muscles that act at the joint.
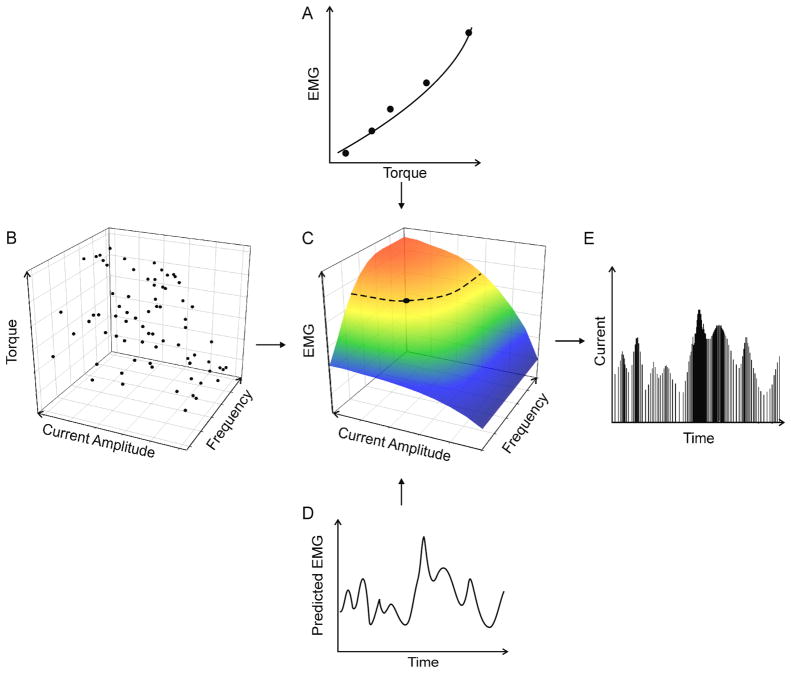
An overview of our experimental design is depicted in figure 1 (details are provided in subsequent sections). For each muscle, we first determined the relationship between the intramuscular EMG magnitude and the torque generated at the interphalangeal joint (Fig. 1A). Next, we determined the relationship between the electrical stimulation parameters (in terms of current pulse amplitude and pulse frequency) and torque at the joint (Fig. 1B). Having established these two relationships, and with torque as a common parameter, we were able to identify a direct transfer function between EMG and the stimulus parameters (Fig. 1C). We then used this transfer function to convert previously recorded or predicted EMG signals associated with a desired motor behaviour (Fig. 1D) into a pattern of stimulus pulses that varied both in amplitude and in frequency (Fig. 1E). The stimulus patterns associated with each muscle were then delivered concurrently through the intramuscular electrodes and the evoked torque pattern was recorded and compared to the desired pattern.
Figure 1.
Schematic representation of the procedures. (A) The relationship between the EMG magnitude and isometric torque was experimentally determined. (B) Then the relationship between the electrically-evoked torque and stimulus parameters (pulse frequency and pulse amplitude) was also determined experimentally. Because these two relationships have torque as a common variable, they were combined (C) to form a relationship between EMG and stimulus parameters. The dashed curve in C represents an example of all combinations of stimulus current and stimulus frequency associated with a particular level of EMG. The filled circle on this curve indicates the specific combination of pulse frequency and current amplitude that was chosen in the subject-optimized transfer function. This point was selected by first identifying the central value in the available current-amplitude range and then identifying the corresponding stimulus frequency. Subsequently, (D) a desired or predicted EMG pattern served as the input to the derived transfer function (shown in C) in order to generate (E) the associated stimulation pattern that varied in both stimulus frequency and amplitude.
These procedures were carried out in two ways in different experimental sessions. In one, we generated transfer functions that were tailor-made for each subject and muscle. These are referred to as optimized transfer functions. For the other, we developed a single generalized transfer function that was applied in the same way across subjects and muscles. After a brief description of electrode placement, we first describe the procedures associated with the optimized transfer function, and then describe the approach used for the generalized transfer function.
2.2. Electrode placement and torque recordings
Seven adult male subjects, each of whom gave informed consent, participated in the study which was approved by the institutional human subjects committee. The subject’s hand and proximal phalanx of the thumb were immobilized in a thermoplastic cast that was fixed to a horizontal platform (figure 2). The distal phalanx of the thumb was enclosed in a fitting that was attached to a force transducer aligned to measure flexion and extension forces of the distal segment of the thumb. The perpendicular distance from the centre of the interphalangeal joint to the centre of the fitting was measured for each subject and used to calculate joint torque.
Figure 2.
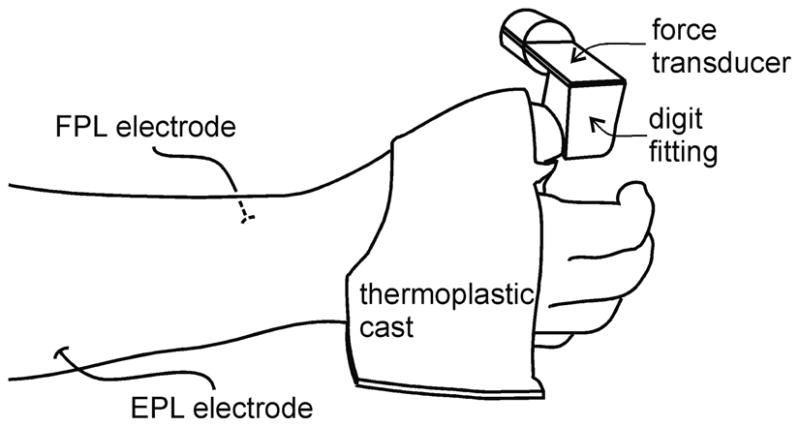
Experimental set up. The right hand was held in a mid-supinated position using a custom-fit thermoplastic cast that was fixed to a horizontal platform. The distal segment of the thumb was enclosed in a fitting that was attached to a force transducer. Intramuscular electrodes were placed into the two muscles controlling the distal joint of the thumb, the flexor pollicis longus (FPL) on the ventral side of the forearm, and the extensor pollicis longus (EPL) on the dorsal side of the forearm.
EMG signals were recorded with hook-wire intramuscular electrodes (stainless steel, 75 μm diameter, ~ 3 – 4 mm denuded of insulation) and referenced to surface electrodes placed over the lateral epicondyle of the elbow. Prior to placement of hook-wire electrodes, muscle locations were identified by stimulating at 1 Hz through a tungsten microelectrode inserted through the skin and directed toward the target muscle. When the evoked responses were consistent with the actions of the target muscle, the tungsten electrode was removed and the hook-wire electrode was inserted in the same location, using the same angle of penetration and to the same depth with a hypodermic needle (27 gauge). The hypodermic needle was then removed leaving the hook-wire electrode in place. The placement of the hook-wire electrode was then verified with stimulation.
The force transducer signal was sampled at 1000 Hz. The EMG traces were differentially amplified (x1000), band-pass filtered (100 to 1000 Hz) and sampled at 2000 Hz. In addition, acquisition software (Spike2, Cambridge Electronics Design, UK) was used to remove DC offset and to full-wave rectify and low-pass filter EMG signals at 50 Hz. In off-line (but within-session) processing, EMG signals were further moving-average filtered with a 0.25 s window (4 Hz) and down-sampled to 1000 Hz to match the sampling frequency of the force trace.
2.3. Optimized transfer function: EMG-torque mapping protocol
Once electrodes were in place in FPL and EPL, subjects were asked to perform two maximum voluntary contractions (MVC) of thumb flexion and thumb extension. The trials associated with the largest torque in each direction were considered the MVCs. These trials were followed by a series of isometric contractions during which torque was slowly increased and then held constant for about 2 s at one of several levels of increasing magnitude up to approximately 50% MVC in both the flexion and extension directions. Mean torque and rectified EMG values measured over a 1 s window for each step were then normalized to their MVC values. The relationship between EMG and torque was fit with a second-order polynomial using the least squares method (figure 1A).
2.4. Optimized transfer function: stimulation-torque mapping protocol
To determine the relationship between stimulus parameters (pulse amplitude and frequency) and torque (e.g. figure 1B), a working range of current amplitudes was first established. To do this, each muscle was stimulated repeatedly with 2 s trains of 30 Hz pulses (pulse width 0.5 ms) (Multi Channel Systems, Germany). The current amplitude was incremented automatically by 0.1 mA for each train. The smallest current amplitude that first elicited a detectable torque response was deemed the minimum current. As the current amplitude was increased above threshold, torque typically initially increased steeply and then reached a plateau, beyond which no further systematic increases in torque were observed. Therefore, we designated the smallest current that elicited the maximum torque as the maximum current. This process was repeated 2 – 5 times to evaluate the stability of the range.
Once the current amplitude range had been determined, a set of 75 randomly generated combinations of stimulus amplitude (between minimum and maximum current) and frequency (between 10 and 50 Hz) was generated to sample the amplitude/frequency space. This frequency range was selected because it represents a typical range over which motor unit force in hand muscles is modulated by stimulus frequency (Fuglevand et al., 1999). Torque responses in each muscle were recorded during repeated 2 s stimulation trains (0.5-ms width pulses, 3 s rest between trials) with each train using one of the 75 different amplitude/frequency combinations. In off-line (but within-session) automated processing, the baseline torque was removed, the average (over a 0.5 s epoch) steady-state torque evoked by the stimulation was determined, and the torque was normalized to the maximum torque elicited by stimulation. Current amplitude was normalized so that threshold current was set to 0 and maximum current was set to a value of 1. Likewise, stimulus frequency was normalized with 9 Hz set to 0, and 50 Hz set to 1.0. The three-dimensional relationship between torque, current amplitude, and stimulus frequency was then determined by fitting the data with a 3rd order by 3rd order polynomial surface using the least squares method. Then, based on the relationships between EMG and torque (Fig. 1A) and stimulus parameters and torque (Fig. 1B) for each subject and muscle, the relationships between EMG and stimulus parameters were derived to obtain the optimized transfer functions (Fig. 1C).
2.5 Optimized transfer function: creation of EMG templates
To evaluate the ability of the optimized transfer functions to recreate torque profiles via electrical stimulation based on recorded EMG signals, we recorded a set of template EMG signals that were converted into stimulus patterns. A single template consisted of two EMG traces (one for each muscle) and a torque trace. Each subject performed four isometric ‘test’ behaviours, each behaviour comprising one template: flexion to different target torques, extension to different target torques, slow flexion-extension oscillations, and fast flexion-extension oscillations. For these tasks, subjects exerted torque to match a target trace displayed on a computer monitor. Target torques were scaled to each subject’s MVC torque and did not exceed 20% MVC. Subjects were given practice trials before the templates were recorded.
2.6. Optimized transfer function: stimulation protocol
For each test behaviour, EMG signals were full-wave rectified, low-pass filtered, normalized to the MVC EMG, and re-sampled using 100 ms intervals. For each time point and each muscle, the derived transfer function (Fig. 1C) was used to generate a combination of stimulus pulse-frequency and pulse-amplitude (using 0.5 ms pulses) based on the template EMG signals (Fig. 1D). Because a desired EMG value corresponds to a curve in stimulus amplitude/frequency space (dashed trace, Fig. 1C), a unique combination of pulse frequency and current amplitude was chosen by first selecting the central value in the allowed amplitude range and then identifying the corresponding stimulus frequency (filled circle, Fig. 1C). Pulse frequency values were rounded to the nearest 1 Hz and amplitude values were rounded to the nearest 0.1 mA.
Within the same experimental session, the predicted pulse trains associated with each test behaviour were delivered concurrently to the muscles through the intramuscular electrodes using a programmable stimulator (Multi Channel Systems). Subjects were instructed to relax the hand and thumb during stimulation while the evoked thumb torque was recorded. Subjects were not informed of the type of test behaviour elicited. Different test behaviours were evoked in random order, and 3 – 5 trials were carried out for each behaviour.
2.7. Generalized transfer function: derivation
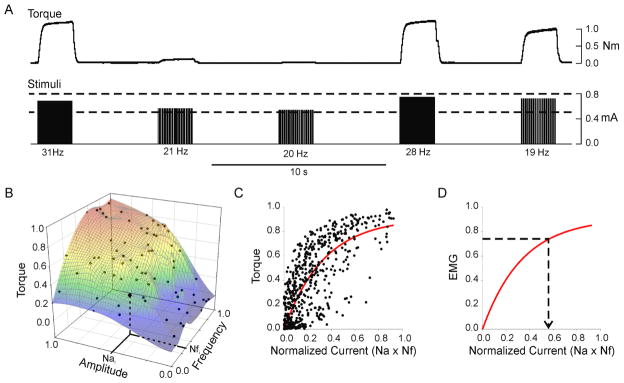
The experiments described above are based on an idealized situation in which mapping functions are customized for each subject, muscle, and electrode placement. Furthermore, derivation of the mapping functions involves recording voluntary EMG and torque signals. Clearly, it would not be possible to generate such mapping functions in a paralyzed individual. Consequently, we developed a generalized transfer function that relied only on identifying the minimum and maximum threshold currents for each muscle. This generalized transfer function was derived from the normalized torque/amplitude/frequency relationships obtained over several recording sessions in one subject (subject A). Figure 3A shows a brief example segment of data recorded in this subject, and figure 3B shows a complete data set obtained for one recording session. In order to simplify this representation and to facilitate merging data across sessions, we combined normalized pulse amplitude (Na) and normalized pulse frequency (Nf) into a single parameter that was simply the product of the two parameters. We refer to this product as normalized average current (Nc) based on the following line of reasoning. In non-normalized units, the product of pulse amplitude and pulse width yields charge/pulse. This value multiplied by pulse frequency (i.e. pulse/s) yields a term that is numerically equivalent to average current.
Figure 3.
Generalized transfer function. A generalized transfer function was derived from the torque –stimulus amplitude – stimulus frequency data obtained from 8 experimental sessions in one subject. (A) Brief segment of data recorded during one session in this subject. Bottom traces show stimuli, top traces show flexion torque. Two dashed lines indicate minimum and maximum current levels for this session. For each combination of stimulus current amplitude and frequency, the evoked torque (average over a 0.5 s epoch during plateau in torque) was measured. (B) Example of complete set of normalized torque-stimulus amplitude-stimulus frequency data obtained for one session. The normalized stimulus amplitude (Nai) and normalized stimulus frequency (Nfi) for a single trial are indicated on the axes. In (C) the product of the normalized amplitude and normalized frequency (referred to as normalized current) is plotted against torque for all 8 recording sessions in this subject. (D) Under the assumption that the relationship between EMG magnitude and torque is linear, the relationship between EMG magnitude and normalized current (red trace) has the same form as in C. Subsequently, this relationship can be used to convert a desired or predicted level of EMG (dashed horizontal line) into an associated normalized current value (arrow).
Figure 3C shows all the normalized current - torque data obtained from all eight recording sessions of subject A. These data were fit with a rising exponential (solid line, Fig. 3C) in the form:
| (1) |
where T is the normalized torque, Tm represents the maximum value of normalized torque, e is the base of the natural logarithms, Nc is the normalized current, and θ represents the amount of normalized current associated with a 63% (i.e. 1 − e−1) increase in normalized torque. The specific values of Tm and θ for the curve shown in figure 3C were 0.91 and 0.34 (r2 = 0.58, p <0.0001).
For the generalized transfer function, the relationship between normalized torque and normalized current (shown in Fig. 3C) was converted into a relationship between normalized EMG amplitude and normalized current (Fig. 3D) based on the following. The relationship between EMG and isometric torque (or force) differs somewhat across muscles. For some muscles, the relationship between torque and EMG amplitude is best fit as a linear function (Bigland and Lippold 1954, Woods and Bigland-Ritchie 1983) whereas for others, the relationship has more of parabolic form (Vredenbregt and Rau 1973; Lawrence and De Luca 1983). Nevertheless, for the sake of generality, we assumed that a linear form would serve as a fair approximation of the EMG-torque relationship, even for muscles exhibiting the parabolic form. Therefore, when torque and EMG were normalized to their respective maximal values, a linear relationship with a slope of 1.0 was used to represent the EMG-torque relationship for the purposes of deriving a generalized transfer function. Consequently, the normalized current - torque relationship (Fig. 3C) was readily converted into an equivalent normalized current - EMG relationship (Fig. 3D) that served as the generalized transfer function. EMG values were subsequently transformed into associated values of normalized current (dashed arrow, Fig. 3D) using this generalized transfer function.
2.8. Generalized transfer function: identification of stimulus parameters
To resolve a normalized current (Nc) value into constituent normalized amplitude (Na) and frequency (Nf) values (all parameters represent unitless values between 0 and 1.0), we used the simple relationship
| (2) |
This did not provide an unambiguous solution as multiple frequency/amplitude combinations satisfy this equation. In order to resolve this ambiguity it was necessary to define a relationship between normalized amplitude (Na) and normalized frequency (Nf). These two factors, in a coarse way, represent modulation of muscle fibre recruitment and rate coding, respectively, enacted by electrical stimulation. Because natural muscle contraction, particularly at levels less than 50% MVC, involve concurrent recruitment and rate coding (Milner-Brown et al., 1973; Monster and Chan, 1977; De Luca et al., 1982; Fuglevand et al., 1993), we chose to introduce a simple weighting-factor constant, W, to represent the fixed ratio of normalized frequency to normalized amplitude, viz., W = Nf /Na. Therefore, the relative contributions of stimulus frequency (i.e. rate coding) and pulse amplitude (i.e. recruitment) to muscle output could be adjusted by changing the selected value of W. A W value of 1.0 would simply imply that modulation of contraction intensity comes about by varying normalized frequency and amplitude in equal measure. Furthermore, if this ratio is rearranged to
| (3) |
and the right-hand side of equation 3 is substituted into equation 2, then this gives:
| (4) |
Then, when equation 4 was rearranged to
| (5) |
we could solve for the normalized amplitude (Na) given the predicted level of normalized current (Nc, see dashed arrow, fig. 2D) and given the pre-selected value of W The normalized frequency (Nf) could then be determined from equation 3. The value of W was nominally set to 1.0. For some values of W, it was possible that the calculated value for Na or Nf to exceed 1.0. In those cases, the parameter value was set to 1.0.
Once minimum and maximum currents were identified for each muscle, the only parameter that required an input value for the generalized transfer function was the weighting factor, W. For most subjects, this factor was not adjusted from its nominal value of 1.0. However, in some subjects, better results were achieved (the contraction was more fused and more comfortable) by biasing towards a higher frequency contribution (i.e. W > 1.0).
2.9. Generalized transfer function: protocol for evoking isometric behaviors
EMG signals recorded during the four isometric test behaviours (see section 2.5) from one subject only (subject A) were used to generate stimulus patterns derived from the generalized transfer function. These patterns were then delivered to other subjects. The evoked torque profiles in these subjects were then compared to the original torque profiles recorded in subject A. This approach was taken in order to more realistically approximate the situation in which a transfer function developed from recordings in able-bodied subjects would be deployed in paralyzed individuals.
2.10. Generalized transfer function: protocol for evoking displacement behaviours
In order to evaluate whether this approach could be applied to a different mechanical condition, we used the same generalized transfer function to recreate the muscle active states associated with unloaded free movements of the distal segment of the thumb. For these tests, the force transducer and coupling were removed from the thumb and a light-weight electogoniometer (Biopac, USA) was fixed over the interphalengeal joint of the thumb to measure angular displacement. The test behaviours, recorded in subject A, involved flexion-extension movements of the interphalangeal joint during which angular displacement and the EMG signals from the two muscles were recorded. Because the transfer function was independent of mechanical variables used to represent behaviour, it was possible to transform the EMG signals recorded during free movements into patterns of electrical stimulation based on the transfer function derived from isometric contractions. The predicted patterns of electrical stimulation were delivered to the muscles in the other subjects and the evoked angular displacement signals recorded.
2.11. Data analysis
We compared the evoked output (torque or displacement) to the desired output (i.e. the torque or displacement that was measured during the voluntary test behaviours) to assess how well the active states of the muscle were recreated by the stimulation. The similarity of the stimulated output to the desired was assessed using two metrics: the coefficient of determination (r2) and the root mean square error (RMSE). The r2 measures the similarity in shape between the desired output and the stimulated output, whereas the RMSE measures the similarity in magnitude. A good outcome would be reflected by a high r2 and a low RMSE. The baseline was subtracted from both the desired and evoked response but the amplitude was not normalized.
3. Results
For two of the seven subjects tested (subjects E and F), evoked torque responses deteriorated or ceased altogether over repeated trials. We assume that this was due to migration of electrodes out of the target muscles. Data from these subjects, therefore, were excluded from the analysis. Three subjects (A, B, and D) successfully completed the experiments associated with the optimized transfer function while four subjects (A, B, C, and G) completed the experimental sessions associated with the generalized transfer function.
3.1. Torque production with a subject-optimized transfer function
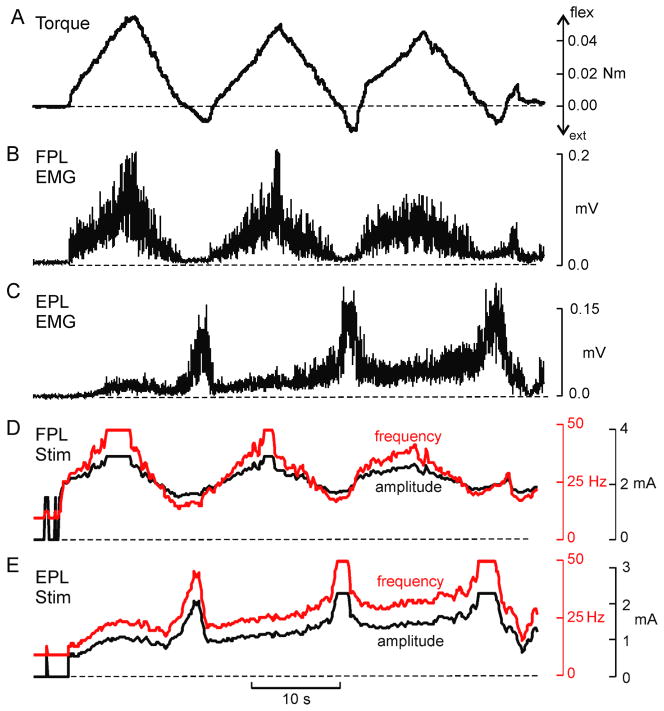
For three subjects, the transfer functions between EMG amplitude and stimulus parameters were individually determined. This involved characterizing the relationship between torque and EMG amplitude, and between stimulus parameters and torque (see Fig. 1). This process was performed independently for each muscle and the results were used to derive an ideal transfer function for each electrode placement. These transfer functions were then used to generate stimulation patterns that were intended to re-create a set of desired test behaviours, in this case, a set of isometric torque profiles. The EMG signals that were recorded during these voluntary behaviours served as the inputs to the transfer function. Figure 4 shows an example of a desired torque profile (Fig. 4A), the associated EMG signals recorded from the thumb flexor, FPL (Fig. 4B), and from the thumb extensor, EPL (Fig. 4C). Also shown in Figure 4 are the predicted stimulus patterns for FPL (Fig. 4D) and EPL (Fig. 4E). The test behaviour depicted in Figure 4 was the slow flexion/extension oscillation task to target torque levels of ~ 20% MVC. The asymmetry between flexor and extensor torques (in non-normalized units) arose because of the substantially larger MVC torque for FPL compared to EPL. Flexion torques are indicated as positive and extension torques negative.
Figure 4.
Example test behaviour and derived stimulus patterns. (A) Voluntarily generated torque profile, and simultaneously recorded EMG signals from (B) FPL, and (C) EPL. These EMG traces constituted the template that was converted into a stimulation pattern by the transfer function. The stimulation pattern for (D) FPL (D) and (E) EPL vary in both pulse frequency (red traces) and pulse amplitude (black traces). These stimulus patterns were subsequently delivered back to the muscles in an attempt to evoke the original test behaviour, shown in A.
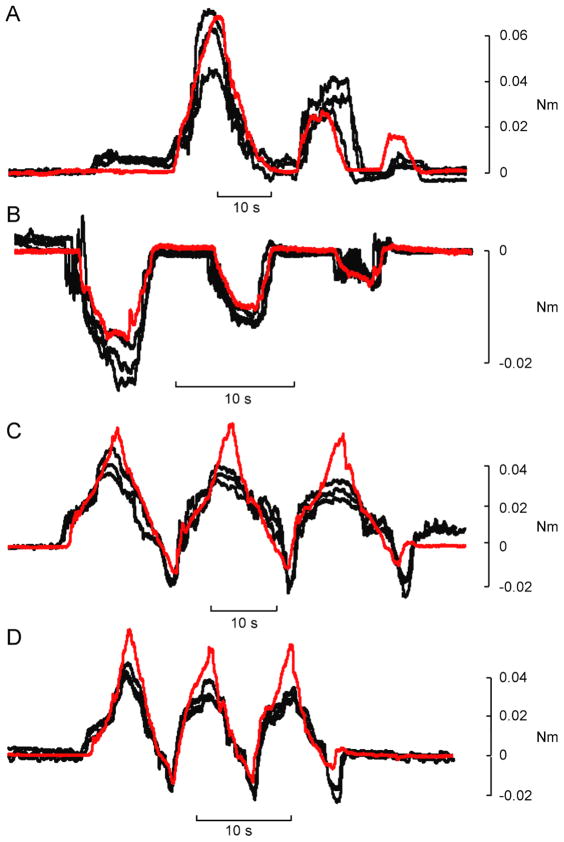
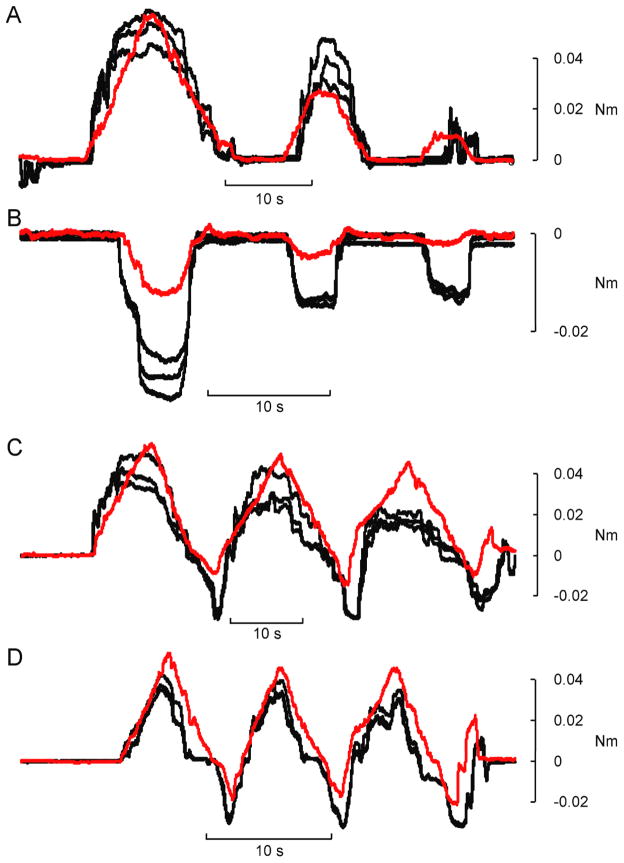
Four isometric test behaviours were elicited: 1) a series of flexions, 2) a series of extensions, 3) slow flexion/extension oscillations, and 4) fast flexion/extension oscillations. All test behaviours involved some degree of co-contraction of the two muscles, even those that were unidirectional. Figure 5 shows repeated examples of the torque outputs elicited for each test behaviour in one subject. In each panel, the black traces are the evoked responses, and the red trace is the desired profile.
Figure 5.
Example reproductions of desired torque trajectories with subject-optimized model. Stimulation patterns derived from EMG recordings using the subject-optimized model were delivered to the same subject in the same session. Each stimulus pattern was replayed three times. In each panel the red line is the desired torque trajectory and the black lines are the torques patterns evoked by the electrical stimulation. Four different isometric torque behaviours were generated: flexions (A), extensions (B), slow oscillations (C) and fast oscillations (D).
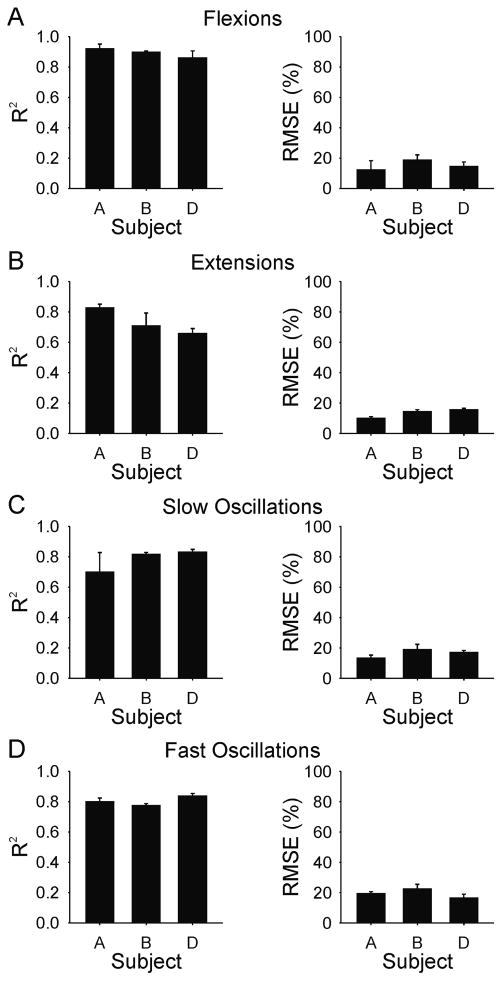
The mean and standard deviation of the r2 and the RMSE for each test behaviour and for each subject using the optimized transfer functions are shown in Figure 6. The average r2 over all subjects and all behavioural conditions was 0.80 ± 0.09; the corresponding average RMSE was 16 ± 4.1% of the full range.
Figure 6.
Subject mean (SD) coefficient of determination (R2) and root mean squared error (RMSE) values for torque reproduction with subject-optimized model for (A) flexions, (B) extensions, (C) slow oscillations, and (D) fast oscillations. Means are based on the average of three evoked responses of each test behaviour in each subject.
3.2. Torque production with a generalized transfer function
The above results indicate that it is possible to recreate, with reasonable accuracy, the active state of muscles when their individual properties and electrode placements are known. For spinal cord injured patients, however, it would not be possible to experimentally measure the EMG/stimulation/torque relationship in each muscle. Thus, we developed a generalized transfer function that might serve as an initial approximation to enable EMG signals to be converted into stimulus patterns for different muscles and individuals. This generalized model was based on data collected over 8 different sessions in one subject (subject A).
The test behaviours were recorded in subject A and the EMG signals recorded during these behaviours were used to generate the stimulus patterns. These stimulus patterns were subsequently delivered to FPL and EPL muscles in three other subjects, and then again to subject A for comparison. Therefore, the test behaviours were identical across subjects. Each set of stimulus patterns was delivered three consecutive times.
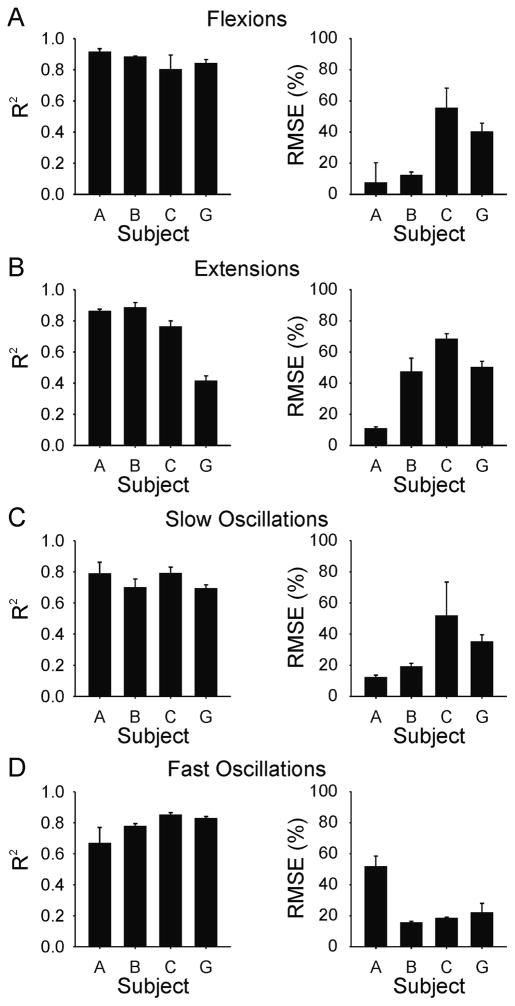
Figure 7 shows examples of the torque profiles elicited for each test behaviour in subject B based on the generalized transfer function derived from data recorded in subject A. In this subject (subject B), the evoked responses were similar to the desired trajectories for all four types of test behaviours. The average r2 and RMSE are shown in Figure 8 for each subject and test behaviour. As expected, the best predictions (i.e. largest r2 and smallest RMSE) tended to occur for subject A, the subject from whose data the original transfer function was derived. Across these four subjects and four behaviours using the generalized transfer function, the average r2 value was 0.78 ± 0.13 and the corresponding average RMSE was 31 ± 19.5% of full range.
Figure 7.
Example reproductions of desired torque trajectories using generalized transfer function. EMG signals recorded in one subject, (subject A) were replayed in another subject (subject B) using stimulation patterns that were based on a general model created from 8 sets of data collected in subject A. Each stimulus pattern was replayed three times. In each panel the red line is the desired torque trajectory (from subject A) and the black lines are the torques patterns evoked by the electrical stimulation in subject B. Four different isometric torque behaviours were generated: flexions (A), extensions (B), slow oscillations (C) and fast oscillations (D).
Figure 8.
Subject mean (SD) coefficient of determination (R2) and root mean squared error (RMSE) values for torque reproduction using generalized transfer function for (A) flexions, (B) extensions, (C) slow oscillations, and (D) fast oscillations. Means are based on the average of three evoked responses of each test behaviour in each subject.
It should be noted that the fit of the evoked responses for subject A associated with the generalized transfer function (figure 8) were similar to and just about as good as that obtained with the optimized transfer function (figure 6). This occurred even though the data used to generate these two sets of results were obtained in separate experimental sessions, using different electrode placements, and also using different algorithms to derive the transfer functions. This finding partially implies that a key assumption associated with the generalized transfer function, namely, that of a linear EMG-torque relationship, was not an unreasonable approximation.
Although the evoked torques were generally well matched to the templates, there were inter-subject differences in the quality of fit. For example, subject C (fig. 8) had the highest RMS error for three of the four test behaviors even though the r2 values for this subject were consistently high. This occurred because the magnitude of the evoked torque in both flexion and extension exceeded the desired magnitude, while the overall shape of the evoked response was similar to the desired output. This implies that the transfer function gain was too high for this subject. In contrast, for subject A, the RMS error was higher and the r2 coefficient was lower for the fast oscillation test (fig 8D) as compared to the other tests. In this set of experiments for subject A, the fast oscillation test was done last. It is likely that a shift in electrode position just prior to, or during the fast oscillation tests contributed to the poorer performance.
3.3. Evoked movements with generalized transfer function
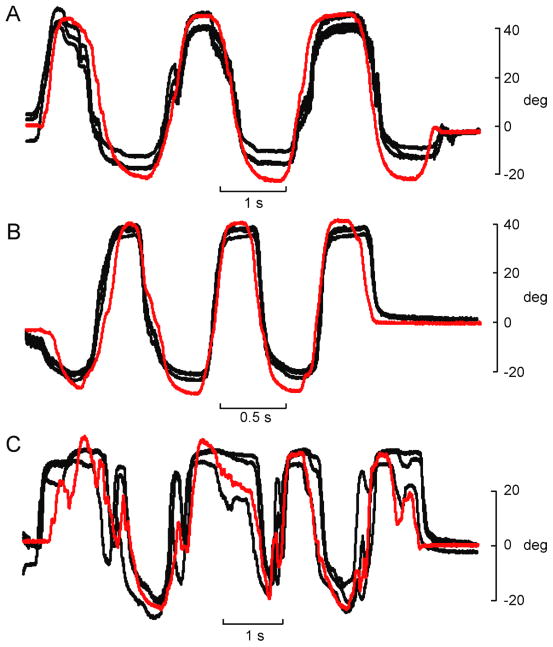
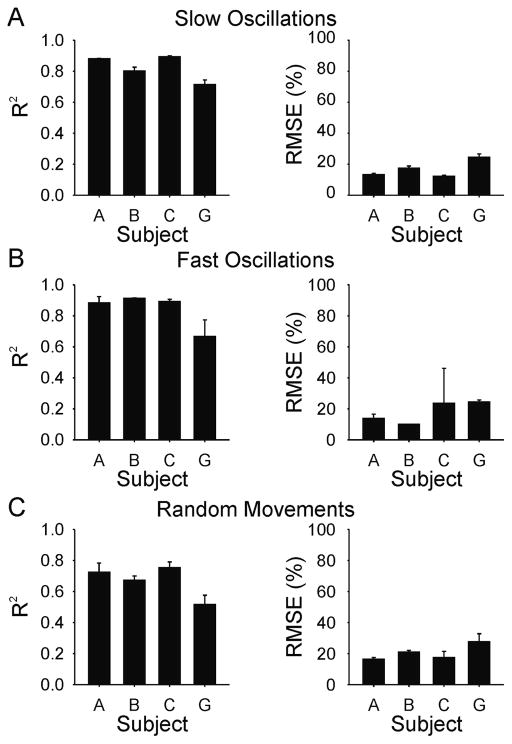
The same generalized transfer function used to evoke isometric torque profiles was also used to elicit desired movement (angular displacement) profiles. The four subjects in whom isometric behaviours were elicited were used for evoking angular displacement of the thumb. Examples of the movements evoked in subject B for each test behaviour (slow oscillations, fast oscillations, and random movements) are shown in Figure 9. Note the difference in time scale between Figure 9A and 9B. Overall, the evoked movements in this subject were remarkably similar to the desired trajectories even though the training data were obtained from a different subject performing isometric contractions. Figure 10 shows the average r2 and RMSE values for each of the four subjects and for each of the three behaviours. The average r2 across all subjects and behaviours was 0.78 ± 0.13; and the corresponding average RMSE was 18.5 ± 7.9% of full range.
Figure 9.
Example reproduction of movement trajectories using generalized transfer function. EMG signals recorded during angular displacement of unloaded interphalangeal joint were recorded in one subject (subject A) and replayed in another subject (subject B) using stimulation patterns that were based on a generalized transfer function. In each panel the red line is the desired movement trajectory (from subject A) and the black lines are the angular displacement patterns evoked by the electrical stimulation in subject B. Three different movement behaviours were generated: slow oscillations (A), fast oscillations (B), and random movements (C).
Figure 10.
Subject mean (SD) coefficient of determination (R2) and root mean squared error (RMSE) values for reproduction of unloaded movement behaviours using generalized transfer function for (A) slow oscillations, (B) fast oscillations, and (C) random movements. Means are based on the average of three evoked responses of each test behaviour in each subject
4. Discussion
These results demonstrate that it is possible to produce behavioural outputs (i.e. torque or displacement profiles) that closely match desired behaviours by converting EMG signals into patterns of electrical stimulation. The transfer function between EMG amplitude and the stimulation parameters was derived by measuring isometric torque output in response to voluntary and electrically evoked contractions. It is notable that this same generalized transfer function was also able to produce desired displacements. This result is encouraging because it suggests that it is possible to transition between loaded and unloaded muscle activity without changing the underlying model. Furthermore, the generalized transfer function, based on training data from one subject, was successful in eliciting desired torque and movement trajectories in other subjects. This finding is significant because it implies that such a transfer function, developed in able-bodied subjects, could be deployed as a initial approximation of a transfer function for use in spinal cord injured individuals (with important qualifications, see below).
The strength of an electrically evoked muscle contraction can be modulated by varying pulse amplitude, the duration of the stimulating pulse, and the frequency with which pulses are delivered. Increasing either the amplitude or the width of the pulse increases the number of motor units that are recruited to the contraction. Increasing the frequency of stimulation increases the contractile strength through temporal summation of twitches. Varying any of these parameters independently results in a non-linear force response (Crago et al., 1980; Binder-Macleod and McDermond, 1992). Generally, it has been standard practice in FES applications to use pulse width to control muscle output (Crago et al., 1980; Kilgore et al., 1989; Kilgore and Peckham, 1993a, 1993b; Giuffrida and Crago, 2005; Pohlmeyer et al., 2009; Lujan and Crago, 2009). In the present experiments, amplitude and frequency of the stimulus pulses were co-varied. Such co-modulation more closely approximates natural activation of muscle wherein motor unit recruitment and rate coding operate in parallel over much of the force range (Milner-Brown et al., 1973; Monster and Chan, 1977; De Luca et al., 1982; Fuglevand et al., 1993). Furthermore, implementation of both recruitment and rate-coding strategies in FES applications has been shown to be more effective in preventing fatigue than using either intensity (i.e. recruitment) or frequency-modulated approaches alone (Chou et al., 2008a, 2008b). In addition, an advantage of this somewhat more complicated approach is that it increases the resolution enabling a more gradual control of torque output.
Data from relatively few subjects are reported here. This was partly due to the arduous nature of these experiments. Both the EPL and the FPL are deep forearm muscles and required relatively long needle electrodes to be accessed. In addition, the EPL is a small muscle and the anatomical location seemed to vary across subjects. Therefore, it was difficult to locate and it was often necessary to try several different locations before the EPL electrode could be correctly placed. There were some subjects in whom the EPL could not located at all, and those experimental sessions were terminated without collecting data. In some other subjects, after initial successful placement of the intramuscular electrode into EPL, evoked responses deteriorated, which was likely due to migration of the electrode out of the muscle. Unfortunately, it was not possible to use surface electrodes for the present experiments because surface electrodes are not selective enough to activate individual muscles, particularly in the forearm. Furthermore, movements of the target muscles below skin-affixed electrodes can significantly alter the relationship between stimulus parameters and torque output (Kilgore et al. 1989). This overall combination of factors, therefore, limited the number of subjects from whom data were collected in the present experiments. It should be remembered, however, that electrode migration is unlikely to be a major complication with chronically implanted electrodes used for upper limb neuroprosthetics because they are surgically secured to muscle or nerve. Indeed, such electrodes can remain stable for years (Peckham et al. 2001).
The interphalangeal joint of the thumb was chosen for this experiment because it is one of the only joints that is controlled by a single pair of muscles. Thus, we were able to map the frequency/amplitude/torque relationship and also the EMG/torque relationship independently for all muscles that operates at this joint. In principle, this approach should also work for more complex joints but would require that all muscles operating at the joint be instrumented with electrodes and that torque be detected for each degree of freedom at the joint. Because this was our initial undertaking with this approach, we opted for the simplicity of the distal joint of the thumb as our test system.
We were then able to use these EMG/torque and frequency/amplitude/torque relationships to identify the optimized transfer function for each muscle. Using these individualized maps, reasonably accurate torque profiles were elicited. However, this approach would not be feasible for an individual with a spinal cord injury. One of the objectives of this study, therefore, was to determine if a generalized transfer function could be used to produce accurate behavioural outputs across different subjects. Using data recorded over multiple sessions in one subject, and using a single parameter (normalized current) to represent the two original stimulus variables (amplitude and frequency), a simple transfer function was derived. While an infinite number of different combinations of amplitude and frequency could theoretically produce the same output response, a simple weighting factor was used to vary contraction intensity by modulating recruitment and rate-coding more or less equally. This generalized transfer function was capable of producing desired motor behaviours with reasonable accuracy across subjects. Furthermore, because this generalized transfer function nominally required only the minimum and maximum threshold current values as inputs for each muscle, it should be relatively easy to implement in an upper limb neuroprosthesis involving many muscles.
It should be recognized that for the generalized transfer function, a linear EMG/torque relationship was assumed for all muscles. Because the match of evoked to desired responses using the generalized transfer function was just about as good as that based on the optimized transfer function (where the actual EMG/torque relationships were used), then this might suggest that the assumption of a linear EMG/torque relationship was reasonable. However, our experiments only involved two muscles, and therefore, we cannot say with certainty how satisfactory this assumption would be for other muscles. Furthermore, we only tested torque levels up to 20% of the maximum voluntary torque. Therefore, while an assumption of linearity in this low output range might be reasonable, it might not be adequate for higher torque levels. Nevertheless, it is important to point out that over a typical day in a healthy subject, it is rare for muscle activity to exceed 20% of maximum, even for a locomotor/postural muscle like the vastus lateralis (Klein et al. 2010). Therefore, the capacity to evoke torque with good fidelity at levels up to 20% of maximum would seem adequate to accomplish most activities of daily living.
It is also important to note that all of these experiments were performed in healthy, able-bodied subjects. Musculoskeletal physiology is likely to be different in subjects with spinal cord injury or stroke (Shields, 2002; Hafer-Macko et al., 2008; Biering-Sørensen et al., 2009). Spinal cord injury can lead to significant muscle atrophy (Gordon and Mao, 1994), changes in muscle contractile properties (Gerrits et al., 1999; Scott et al., 2006) including increases in muscle fatigue (Stein et al., 1992; Shields, 1995). In addition, hyperexcitability of spinal reflexes associated with spasticity, a common feature of spinal cord injury (Adams and Hicks 2005), will further complicate attempts to restore motor function using functional electrical stimulation based on templates derived exclusively from healthy subjects. One approach, therefore, to address such complications would be to customize the transfer functions for affected muscles (Kilgore et al. 1989). Another possibility, however, would be to use electrical stimulation of muscle first as a therapeutic intervention (Stein et al. 2002, Dudley-Javoroski and Shields 2008) to ameliorate muscle atrophy (Baldi et al. 1998, Scremin et al 1999), spasticity (Mirbagheri et al. 2002, Lo et al. 2009), and fatigue (Gerrits et al. 2000; Duffell et al. 2008). In this way, normal physiological properties would be partially reinstated in paretic muscle, thereby making a generalized transfer function derived from healthy subjects more appropriate for use in subjects with spinal cord injury or stroke.
An alternative method for identifying the transfer function needed for FES applications, as described recently by Lujan and Crago (2009) is to stimulate different combinations of muscles with varying intensity levels and to record the evoked motor responses for each combination. An artificial neural network can then be applied to generate an inverse model of the muscular system, which has parameters of the desired motor behaviour as inputs, and the associated stimulus intensity delivered to each muscle as outputs. This approach was used successfully by Lujan and Crago to evoke isometric flexion/extension and abduction/adduction forces of the thumb through concurrent stimulation of three muscles. As recognized by these authors, however, one limitation of this approach is that the amount of training data required increases geometrically with the number of muscles involved or types of motor behaviours, and therefore becomes impractical for more complex applications. Perhaps one advantage of the EMG-based method used here is that it uses the ‘knowledge’ of the central nervous system, manifest in the recorded patterns of voluntary muscle activity, as a solution as how to coordinate multiple muscles in the elaboration of complex motor behaviours. In other words, when attempting to identify appropriate stimulation patterns needed to control movements in paralyzed individuals, it seems reasonable to use the patterns of activity already identified during the process of normal development and stored in the nervous system, rather than attempt to discover them de novo.
4.1. Potential application to neuroprosthetics
The objective of these experiments was to reproduce the active state of muscle associated with recorded EMG signals using electrical stimulation. To a reasonable degree, the generalized transfer function accomplished this aim for different subjects, different muscles, and for different mechanical situations. Therefore, it would seem that this approach holds promise for use with an algorithm that predicts the EMG activity across multiple muscles associated with desired motor behaviours (Seifert and Fuglevand, 2002; Blana et al., 2008; Anderson and Fuglevand, 2008; Johnson and Fuglevand, 2009; Pohlmeyer et al., 2009). Furthermore, if a patient were equipped with an appropriate interface to the CNS, it seems feasible that kinematic and kinetic features of desired motor behaviours could be identified directly from the cerebral cortex (Wessberg et al., 2000; Serruya et al., 2002; Schalk et al., 2008; Velliste et al., 2008; Pohlmeyer et al., 2009; Hatsopoulos and Donoghue, 2009). Indeed, we envision a three part system in which (1) recordings of activity from the cerebral cortex provide a moment-by-moment representation of the desired trajectory of the limb (e.g. Georgopoulus et al. 1989; Schwartz 1993), (2) the complex patterns of muscle activity associated with the desired limb trajectory are predicted moment-by-moment using probabilistic algorithms (Seifert and Fuglevand 2002, Anderson and Fuglevand 2008, Johnson and Fuglevand 2009), and (3) the predicted patterns of muscle activity are converted to patterns of electrical stimulation that elicit the intended movement. Related to the third part of this system, here we have shown that it is possible, using a generalized transfer function, to accurately reproduce movements (or isometric torque profiles) using electrical stimulation patterns derived from muscle activity patterns. This result, in conjunction with previous results reported by our lab and by others, supports the feasibility of this kind of system for restoring movement in patients with high-level spinal cord injuries.
Acknowledgments
This work was supported by a grant from the National Institutes of Health (NS 061146).
References
- Adams MM, Hicks AL. Spasticity after spinal cord injury. Spinal Cord. 2005;43:577–586. doi: 10.1038/sj.sc.3101757. [DOI] [PubMed] [Google Scholar]
- Anderson CV, Fuglevand AJ. Probability-based prediction of activity in multiple arm muscles: implications for functional electrical stimulation. J Neurophysiol. 2008;100:482–494. doi: 10.1152/jn.00956.2007. [DOI] [PMC free article] [PubMed] [Google Scholar]
- Baldi JC, Jackson RD, Moraille R, Mysiw WJ. Muscle atrophy is prevented in patients with acute spinal cord injury using functional electrical stimulation. Spinal Cord. 1998;36:463–469. doi: 10.1038/sj.sc.3100679. [DOI] [PubMed] [Google Scholar]
- Biering-Sørensen B, Kristensen IB, Kjaer M, Biering-Sørensen F. Muscle after spinal cord injury. Muscle Nerve. 2009;40:499–519. doi: 10.1002/mus.21391. [DOI] [PubMed] [Google Scholar]
- Bigland B, Lippold OC. The relation between force, velocity and integrated electrical activity in human muscles. J Physiol. 1954;123:214–24. doi: 10.1113/jphysiol.1954.sp005044. [DOI] [PMC free article] [PubMed] [Google Scholar]
- Binder-Macleod SA, McDermond LR. Changes in the force-frequency relationship of the human quadriceps femoris muscle following electrically and voluntarily induced fatigue. Phys Ther. 1992;72:95–104. doi: 10.1093/ptj/72.2.95. [DOI] [PubMed] [Google Scholar]
- Blana D, Hincapie JG, Chadwick EK, Kirsch RF. A musculoskeletal model of the upper extremity for use in the development of neuroprosthetic systems. J Biomech. 2008;41:1714–1721. doi: 10.1016/j.jbiomech.2008.03.001. [DOI] [PMC free article] [PubMed] [Google Scholar]
- Chou L, Kesar TM, Binder-Macleod SA. Using customized rate-coding and recruitment strategies to maintain forces during repetitive activation of human muscles. Phys Ther. 2008a;88:363–375. doi: 10.2522/ptj.20070201. [DOI] [PMC free article] [PubMed] [Google Scholar]
- Chou L, Lee SC, Johnston TE, Binder-Macleod SA. The effectiveness of progressively increasing stimulation frequency and intensity to maintain paralyzed muscle force during repetitive activation in persons with spinal cord injury. Arch Phys Med Rehabil. 2008b;89:856–864. doi: 10.1016/j.apmr.2007.10.027. [DOI] [PMC free article] [PubMed] [Google Scholar]
- Crago PE, Peckham PH, Thrope GB. Modulation of muscle force by recruitment during intramuscular stimulation. IEEE Trans Biomed Eng. 1980;27:679–684. doi: 10.1109/TBME.1980.326592. [DOI] [PubMed] [Google Scholar]
- De Luca CJ, LeFever RS, McCue MP, Xenakis AP. Behaviour of human motor units in different muscles during linearly varying contractions. J Physiol (Lond ) 1982;329:113–128. doi: 10.1113/jphysiol.1982.sp014293. [DOI] [PMC free article] [PubMed] [Google Scholar]
- Dudley-Javoroski S, Shields RK. Muscle and bone plasticity after spinal cord injury: review of adaptations to disuse and to electrical muscle stimulation. J Rehabil Res Dev. 2008;45:283–296. doi: 10.1682/jrrd.2007.02.0031. [DOI] [PMC free article] [PubMed] [Google Scholar]
- Duffell LD, Donaldson Nde N, Perkins TA, Rushton DN, Hunt KJ, Kakebeeke TH, Newham DJ. Long-term intensive electrically stimulated cycling by spinal cord-injured people: effect on muscle properties and their relation to power output. Muscle Nerve. 2008;38:1304–1311. doi: 10.1002/mus.21060. [DOI] [PubMed] [Google Scholar]
- Fuglevand AJ, Winter DA, Patla AE. Models of recruitment and rate coding organization in motor-unit pools. J Neurophysiol. 1993;70:2470–2488. doi: 10.1152/jn.1993.70.6.2470. [DOI] [PubMed] [Google Scholar]
- Fuglevand AJ, Macefield VG, Bigland-Ritchie B. Force-frequency and fatigue properties of motor units in muscles that control digits of the human hand. J Neurophysiol. 1999;81:1718–1729. doi: 10.1152/jn.1999.81.4.1718. [DOI] [PubMed] [Google Scholar]
- Georgopoulos AP, Lurito JT, Petrides M, Schwartz AB, Massey JT. Mental rotation of the neuronal population vector. Science. 1989;243:234–236. doi: 10.1126/science.2911737. [DOI] [PubMed] [Google Scholar]
- Gerrits HL, De Haan A, Hopman MT, van Der Woude LH, Jones DA, Sargeant AJ. Contractile properties of the quadriceps muscle in individuals with spinal cord injury. Muscle Nerve. 1999;22:1249–1256. doi: 10.1002/(sici)1097-4598(199909)22:9<1249::aid-mus13>3.0.co;2-n. [DOI] [PubMed] [Google Scholar]
- Gerrits HL, De Haan A, Sargeant AJ, Dallmeijer A, Hopman MT. Altered contractile properties of the quadriceps muscle in people with spinal cord injury following functional electrical stimulated cycle training. Spinal Cord. 2000;38:214–223. doi: 10.1038/sj.sc.3100974. [DOI] [PubMed] [Google Scholar]
- Giuffrida JP, Crago PE. Functional restoration of elbow extension after spinal-cord injury using a neural network-based synergistic FES controller. IEEE Trans Neural Syst Rehabil Eng. 2005;13:147–152. doi: 10.1109/TNSRE.2005.847375. [DOI] [PubMed] [Google Scholar]
- Gordon T, Mao J. Muscle atrophy and procedures for training after spinal cord injury. Phys Ther. 1994;74:50–60. doi: 10.1093/ptj/74.1.50. [DOI] [PubMed] [Google Scholar]
- Hafer-Macko CE, Ryan AS, Ivey FM, Macko RF. Skeletal muscle changes after hemiparetic stroke and potential beneficial effects of exercise intervention strategies. J Rehabil Res Dev. 2008;45:261–272. doi: 10.1682/jrrd.2007.02.0040. [DOI] [PMC free article] [PubMed] [Google Scholar]
- Handa Y, Hoshimiya N. Functional electrical stimulation for the control of the upper extremities. Med Prog Technol. 1987;12:51–63. doi: 10.1007/978-94-009-3361-3_6. [DOI] [PubMed] [Google Scholar]
- Hatsopoulos NG, Donoghue JP. The science of neural interface systems. Annu Rev Neurosci. 2009;32:249–266. doi: 10.1146/annurev.neuro.051508.135241. [DOI] [PMC free article] [PubMed] [Google Scholar]
- Hof AL, Van den Berg J. EMG to force processing I: An electrical analogue of the Hill muscle model. J Biomech. 1981;14:747–758. doi: 10.1016/0021-9290(81)90031-2. [DOI] [PubMed] [Google Scholar]
- Hoshimiya N, Naito A, Yajima M, Handa Y. A multichannel FES system for the restoration of motor functions in high spinal cord injury patients: a respiration-controlled system for multijoint upper extremity. IEEE Trans Biomed Eng. 1989;36:754–760. doi: 10.1109/10.32108. [DOI] [PubMed] [Google Scholar]
- Jacobs R, Bobbert MF, van Ingen Schenau GJ. Mechanical output from individual muscles during explosive leg extensions: the role of biarticular muscles. J Biomech. 1996;29:513–523. doi: 10.1016/0021-9290(95)00067-4. [DOI] [PubMed] [Google Scholar]
- Johnson LA, Fuglevand AJ. Evaluation of probabilistic methods to predict muscle activity: implications for neuroprosthetics. J Neural Eng. 2009;6:055008. doi: 10.1088/1741-2560/6/5/055008. [DOI] [PubMed] [Google Scholar]
- Kern H, Carraro U, Adami N, Hofer C, Loefler S, Vogelauer M, Mayr W, Rupp R, Zampieri S. One year of home-based daily FES in complete lower motor neuron paraplegia: recovery of tetanic contractility drives the structural improvements of denervated muscle. Neurol Res. 2010;32:5–12. doi: 10.1179/174313209X385644. [DOI] [PubMed] [Google Scholar]
- Kilgore KL, Peckham PH. Grasp synthesis for upper-extremity FNS. Part 1. Automated method for synthesising the stimulus map. Med Biol Eng Comput. 1993a;31:607–614. doi: 10.1007/BF02441809. [DOI] [PubMed] [Google Scholar]
- Kilgore KL, Peckham PH. Grasp synthesis for upper-extremity FNS. Part 2. Evaluation of the influence of electrode recruitment properties. Med Biol Eng Comput. 1993b;31:615–622. doi: 10.1007/BF02441810. [DOI] [PubMed] [Google Scholar]
- Kilgore K, Peckham P, Thrope G, Keith M, Gallaher-Stone K. Synthesis of hand grasp using functional neuromuscular stimulation. IEEE Trans Biomed Eng. 1989;36:761–770. doi: 10.1109/10.32109. [DOI] [PubMed] [Google Scholar]
- Kilgore KL, Hoyen HA, Bryden AM, Hart RL, Keith MW, Peckham PH. An implanted upper-extremity neuroprosthesis using myoelectric control. J Hand Surg Am. 2008;33:539–550. doi: 10.1016/j.jhsa.2008.01.007. [DOI] [PMC free article] [PubMed] [Google Scholar]
- Klein CS, Peterson LB, Ferrell S, Thomas CK. Sensitivity of 24-h EMG duration and intensity in the human vastus lateralis muscle to threshold changes. J Appl Physiol. 2010;108:655–661. doi: 10.1152/japplphysiol.00757.2009. [DOI] [PMC free article] [PubMed] [Google Scholar]
- Lawrence JH, De Luca CJ. Myoelectric signal versus force relationship in different human muscles. J Appl Physiol. 1983;54:1653–1659. doi: 10.1152/jappl.1983.54.6.1653. [DOI] [PubMed] [Google Scholar]
- Lo HC, Tsai KH, Su FC, Chang GL, Yeh CY. Effects of a functional electrical stimulation-assisted leg-cycling wheelchair on reducing spasticity of patients after stroke. J Rehabil Med. 2009;41:242–246. doi: 10.2340/16501977-0320. [DOI] [PubMed] [Google Scholar]
- Lujan J, Crago P. Automated optimal coordination of multiple-DOF neuromuscular actions in feedforward neuroprostheses. IEEE Trans Biomed Eng. 2009;56:179–187. doi: 10.1109/TBME.2008.2002159. [DOI] [PMC free article] [PubMed] [Google Scholar]
- Milner-Brown HS, Stein RB, Yemm R. Changes in firing rate of human motor units during linearly changing voluntary contractions. J Physiol (Lond) 1973;230:371–390. doi: 10.1113/jphysiol.1973.sp010193. [DOI] [PMC free article] [PubMed] [Google Scholar]
- Mirbagheri MM, Ladouceur M, Barbeau H, Kearney RE. The effects of long-term FES-assisted walking on intrinsic and reflex dynamic stiffness in spastic spinal-cord-injured subjects. IEEE Trans Neural Sys Rehab Engin. 2002;10:280–289. doi: 10.1109/TNSRE.2002.806838. [DOI] [PubMed] [Google Scholar]
- Monster AW, Chan H. Isometric force production by motor units of extensor digitorum communis muscle in man. J Neurophysiol. 1977;40:1432–1443. doi: 10.1152/jn.1977.40.6.1432. [DOI] [PubMed] [Google Scholar]
- Peckham PH, Keith MW, Kilgore KL, Grill JH, Wuolle KS, Thrope GB, Gorman P, Hobby J, Mulcahey MJ, Carroll S, Hentz VR, Wiegner A. Efficacy of an implanted neuroprosthesis for restoring hand grasp in tetraplegia: a multicenter study. Arch Phys Med Rehabil. 2001;82:1380–1388. doi: 10.1053/apmr.2001.25910. [DOI] [PubMed] [Google Scholar]
- Pohlmeyer EA, Oby ER, Perreault EJ, Solla SA, Kilgore KL, Kirsch RF, Miller LE. Toward the restoration of hand use to a paralyzed monkey: brain-controlled functional electrical stimulation of forearm muscles. PLoS ONE. 2009;4:e5924. doi: 10.1371/journal.pone.0005924. [DOI] [PMC free article] [PubMed] [Google Scholar]
- Schalk G, Miller KJ, Anderson NR, Wilson JA, Smyth MD, Ojemann JG, Moran DW, Wolpaw JR, Leuthardt EC. Two-dimensional movement control using electrocorticographic signals in humans. J Neural Eng. 2008;5:75–84. doi: 10.1088/1741-2560/5/1/008. [DOI] [PMC free article] [PubMed] [Google Scholar]
- Schieber MH. Muscular production of individuated finger movements: the roles of extrinsic finger muscles. J Neurosci. 1995;15:284–297. doi: 10.1523/JNEUROSCI.15-01-00284.1995. [DOI] [PMC free article] [PubMed] [Google Scholar]
- Schwartz AB. Motor cortical activity during movements: population representation during sinusoid tracing. Journal of Neurophysiology. 1993;70:28–36. doi: 10.1152/jn.1993.70.1.28. [DOI] [PubMed] [Google Scholar]
- Scott WB, Lee SCK, Johnston TE, Binkley J, Binder-Macleod SA. Contractile properties and the force-frequency relationship of the paralyzed human quadriceps femoris muscle. Phys Ther. 2006;86:788–799. [PubMed] [Google Scholar]
- Scremin AM, Kurta L, Gentili A, Wiseman B, Perell K, Kunkel C, Scremin OU. Increasing muscle mass in spinal cord injured persons with a functional electrical stimulation exercise program. Arch Phys Med Rehabil. 1999;80:1531–1536. doi: 10.1016/s0003-9993(99)90326-x. [DOI] [PubMed] [Google Scholar]
- Seifert HM, Fuglevand AJ. Restoration of movement using functional electrical stimulation and Bayes’ theorem. J Neurosci. 2002;22:9465–9474. doi: 10.1523/JNEUROSCI.22-21-09465.2002. [DOI] [PMC free article] [PubMed] [Google Scholar]
- Serruya MD, Hatsopoulos NG, Paninski L, Fellows MR, Donoghue JP. Brain-machine interface: Instant neural control of a movement signal. Nature. 2002;416:141–142. doi: 10.1038/416141a. [DOI] [PubMed] [Google Scholar]
- Shields RK. Fatigability, relaxation properties, and electromyographic responses of the human paralyzed soleus muscle. J Neurophysiol. 1995;73:2195–2206. doi: 10.1152/jn.1995.73.6.2195. [DOI] [PubMed] [Google Scholar]
- Shields RK. Muscular, skeletal, and neural adaptations following spinal cord injury. J Orthop Sports Phys Ther. 2002;32:65–74. doi: 10.2519/jospt.2002.32.2.65. [DOI] [PMC free article] [PubMed] [Google Scholar]
- Stein RB, Chong SL, James KB, Kido A, Bell GJ, Tubman LA, Bélanger M. Electrical stimulation for therapy and mobility after spinal cord injury. Prog Brain Res. 2002;137:27–34. doi: 10.1016/s0079-6123(02)37005-5. [DOI] [PubMed] [Google Scholar]
- Stein RB, Gordon T, Jefferson J, Sharfenberger A, Yang JF, de Zepetnek JT, Belanger M. Optimal stimulation of paralyzed muscle after human spinal cord injury. J Appl Physiol. 1992;72:1393–1400. doi: 10.1152/jappl.1992.72.4.1393. [DOI] [PubMed] [Google Scholar]
- Valero-Cuevas FJ. Predictive modulation of muscle coordination pattern magnitude scales fingertip force magnitude over the voluntary range. J Neurophysiol. 2000;83:1469–1479. doi: 10.1152/jn.2000.83.3.1469. [DOI] [PubMed] [Google Scholar]
- Velliste M, Perel S, Spalding MC, Whitford AS, Schwartz AB. Cortical control of a prosthetic arm for self-feeding. Nature. 2008;453:1098–1101. doi: 10.1038/nature06996. [DOI] [PubMed] [Google Scholar]
- Vredenbregt J, Rau G. Surface electromyography in relation to force, muscle length, and endurance. In: Desmedt JE, editor. New Developments in Electromyographyand Clinical Neurophysiology. Basel: Karger; 1973. pp. 607–622. [Google Scholar]
- Wessberg J, Stambaugh CR, Kralik JD, Beck PD, Laubach M, Chapin JK, Kim J, Biggs SJ, Srinivasan MA, Nicolelis MAL. Real-time prediction of hand trajectory by ensembles of cortical neurons in primates. Nature. 2000;408:361–365. doi: 10.1038/35042582. [DOI] [PubMed] [Google Scholar]
- Woods JJ, Bigland-Ritchi B. Linear and non-linear surface EMG/force relationships in human muscles. An anatomical/functional argument for the existence of both. Am J Phys Med. 1983;62:287–299. [PubMed] [Google Scholar]
- Zajac FE. Muscle and tendon: properties, models, scaling, and application to biomechanics and motor control. Crit Rev Biomed Eng. 1989;17:359–411. [PubMed] [Google Scholar]


