Abstract
An estimated one-third of the world's population is latently infected with Mycobacterium tuberculosis, the etiologic agent of tuberculosis. Here, we demonstrate that, unlike wild-type M. tuberculosis, a strain of M. tuberculosis disrupted in the mce1 operon was unable to enter a stable persistent state of infection in mouse lungs. Instead, the mutant continued to replicate and killed the mice more rapidly than did the wild-type strain. Histological examination of mouse lungs infected with the mutant strain revealed diffusely organized granulomas with aberrant inflammatory cell migration. Murine macrophages infected ex vivo with the mutant strain were reduced in their ability to produce tumor necrosis factor α, IL-6, monocyte chemoattractant protein 1, and nitric oxide (NO), but not IL-4. The mce1 mutant strain complemented with the mce1 genes stimulated tumor necrosis factor α and NO production by murine macrophages at levels stimulated by the wild-type strain. These observations indicate that the mce1 operon mutant is unable to stimulate T helper 1-type immunity in mice. The hypervirulence of the mutant strain may have resulted from its inability to stimulate a proinflammatory response that would otherwise induce organized granuloma formation and control the infection without killing the organism. The mce1 operon of M. tuberculosis may be involved in modulating the host inflammatory response in such a way that the bacterium can enter a persistent state without being eliminated or causing disease in the host.
Approximately 60% of people who become infected with Mycobacterium tuberculosis develop asymptomatic latent infection (1). This reservoir of latently infected individuals has a 2-23% lifetime risk of developing active disease, referred to as reactivation tuberculosis (1). How M. tuberculosis establishes and maintains latent infection in an animal host is poorly understood. Several candidate M. tuberculosis genes have been recently reported to be important for persistence in the mouse model of tuberculosis. They include the isocitrate lyase gene (icl), mycolic acid cyclopropane synthase gene (pca), and a two-component response regulator called mprA (2-4). In each case, the disruption of the gene led to attenuation of the mutant strains in the mouse model of infection, whereas their in vitro growth kinetics remained similar to that of the respective wild-type strain (2-4).
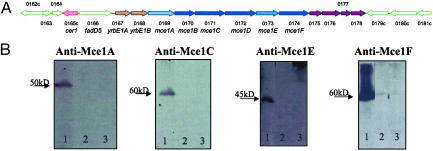
We reported previously the identification of a M. tuberculosis gene mce1A (Rv0169, Sanger Centre genome sequence designation) that conferred on a nonpathogenic Escherichia coli strain an ability to enter nonphagocytic cells (5). The encoded product facilitated uptake of synthetic microspheres into nonphagocytic cells, and an active domain of the protein was recently shown to cause cytoskeletal rearrangement in HeLa cells that was both microfilament- and microtubule-dependent (6, 7). The gene mce1A is located in a putative operon called mce1 containing 12 genes in the M. tuberculosis H37Rv genome (8) (Fig. 1A). The genome of M. tuberculosis contains four mce operons (mce1-4), each with a similar arrangement of the genes within the operon (8). Six of the mce1 genes (mce1A-F) encode proteins with hydrophobic stretches at their N terminus, indicative of surface-exposed proteins. They were recently shown to localize to the cell wall fraction of M. tuberculosis (Fig. 9, which is published as supporting information on the PNAS web site), and Mce1A has been shown to be surface expressed (6).
Fig. 1.
(A) mce1 operon based on M. tuberculosis H37Rv genome sequence (8). (B) Western blot analysis of wild-type M. tuberculosis H37Rv (lane 1) (Rv 0169), yrbE1B (Rv0168) H37Rv mutant (lane 2), and mce1A Erdman mutant (lane 3). The immunoblot analysis was performed with a rabbit polyclonal antibody raised against Mce1A, Mce1C, Mce1E, or Mce1F. The antibodies recognize the respective mce1 operon proteins encoded by the wild-type strain only. Disruption of yrbE1B or mce1A by the hygromycin resistance gene cassette led to loss of expression of downstream genes in the operon.
The observed effect of the mce1A gene product on cytoskeletal rearrangement in HeLa cells and the presence of the Mce1 proteins in the mycobacterial cell wall suggest that the products of the mce1 operon may affect the interaction of the pathogen with mammalian cells. We reasoned that in macrophages, the natural target of M. tuberculosis, such an interaction might alter host immune responses that determine the fate of both the organism and the host. In this report, we provide evidence that the mce1 operon plays a major role in disease progression and outcome in mice infected with M. tuberculosis.
Materials and Methods
Disruption of the mce1 Operon. First we disrupted mce1A (Rv0169) in Mycobacterium bovis bacillus Calmette-Guérin and M. tuberculosis (Erdman) strains by homologous recombination by using a previously described method (9). To disrupt mce1A, we cloned a 3.9-kb DNA fragment encompassing the mce1A gene into pBluescript (nonreplicative in mycobacteria) and replaced 1,040 bp of the mce1A gene with a hyg cassette conferring resistance to hygromycin. The resulting plasmid pMce:hyg was amplified in E. coli DH5α, and the sequence of the mce1A upstream and downstream region was confirmed. Five micrograms of pMce:hyg was pretreated with 100 mJ UV light cm-2 and electroporated into M. tuberculosis strain Erdman or bacillus Calmette-Guérin. The electroporated bacteria were kept in nonselective 7H9 medium with 10% ADC for 24 h and then plated onto 7H11 plates containing 10% oleic acid, albumin, dextrose, catalase, and 50 μg/ml hygromycin.
Next we disrupted another gene in the operon upstream of mce1A called yrbE1B (Rv0168) in M. tuberculosis strain H37Rv by using the two-step counter selection strategy described by Parish and Stoker (10). Briefly, the knockout vector was constructed by first inserting a hygromycin resistance cassette into p2NIL. Second, 2-kb regions upstream and downstream of Rv0168 were amplified from H37Rv DNA and cloned into the multicloning site flanking the hygromycin resistance gene. Finally, the lacZ-sacB counter-selection cassette from pGOAL17 was inserted. Vector DNA was pretreated with 100 mJ UV light cm-2 and electroporated into M. tuberculosis strain H37Rv. Single crossovers were selected on 7H11 plates with 40 μg/ml 5-bromo-4-chloro-3-indolyl β-d-galactoside (X-Gal), 50 μg/ml hygromycin, and 20 μg/ml kanamycin. Double crossovers were selected on 7H11 plates containing 40 μg/ml X-Gal, 2% sucrose, and 50 μg/ml hygromycin. The candidate double crossover mutants were screened by PCR and then confirmed by Southern blot hybridization.
We performed immunoblot analyses of the Mce1 proteins using available antibodies and found that the mce1A and yrbE1B mutants did not express the products of mce1A, C, E, and F (Fig. 1B). Thus, allelic exchange of mce1A or yrbE1B led to the disruption of the downstream mce1 genes. Henceforth, mce1A or yrbE1B mutants will be referred to as mce1 operon mutants. All of these mutants showed in vitro broth (7H9) growth kinetics indistinguishable from that of the respective wild-type strains (data not shown). The studies described below were performed with the mce1 operon mutants and their respective parent wild-type strains.
Complementation of the mce1 Mutant Strain. Despite numerous attempts, it was not possible to complement the mce1 operon knockout mutants by expression of the missing genes from an alternative locus or plasmids. Thus, we adopted a knockin strategy, whereby the disrupted genes were replaced at the original locus. The knockin vector contained a 5.6-kb fragment of the mce1 operon encompassing Rv 0167-Rv 0171. In the first cloning step, the upstream 3.6-kb fragment containing a C-terminal 6× histidine (HIS) tag was cloned between HindIII and XbaI sites of p2NIL (10) (see Fig. 10, which is published as supporting information on the PNAS web site). In the second step, the remaining 2 kb was cloned between the XbaI and PacI sites. Cloning the entire fragment in two steps allowed us to engineer the 6× HIS tag immediately preceding the stop codon for mce1A and the start codon for mce1B. The placement of a 6× HIS tag and an XbaI restriction site between mce1A and mce1B was confirmed by sequencing and used to distinguish the complemented from the wild-type strain. Last, a lacZ-sacB cassette was cloned into the PacI site of p2NIL for two-step counter selection of knockin mutants (10). The Erdman and H37Rv mce1 operon mutants were transformed with the knockin construct. Single crossovers were selected on 7H11 plates with 40 μg/ml 5-bromo-4-chloro-3-indolyl β-D-galactoside (X-Gal) and 20 μg/ml kanamycin. Double crossovers were selected on 7H11 plates with 40 μg/ml X-Gal and 2% sucrose.
The Erdman mutant strain could not be complemented, most likely due to poor transformation efficiency. Colonies representing potential double crossovers in H37Rv were screened by PCR, and knockin strains were confirmed by Southern blot analysis and sequencing. Expression of Mce1 proteins was demonstrated by Western blot analysis (see Fig. 11, which is published as supporting information on the PNAS web site).
Mouse Infection. M. tuberculosis H37Rv, Erdman, M. bovis bacillus Calmette-Guérin, and their mutant constructs were each passaged once in mice before use. They were grown in 7H9 broth for animal inoculation or 7H11 agar for colony-forming unit (cfu) enumeration.
We infected 8-wk-old female BALB/c mice (The Jackson Laboratory) via tail vein with 0.1 ml of PBS, pH 7, suspension containing ≈3 × 10⁵ cfu of the wild-type or mce1 mutant bacillus Calmette-Guérinor3.5 × 105 cfu of the wild-type or mce1 mutant M. tuberculosis Erdman. Each infection group included 42-50 animals. At regular intervals (2, 4, 10, 16, 25, and 41 wk), four animals from each group were killed and lungs, spleen, and liver were removed and examined grossly, histologically, and microbiologically. Histology slides were made commercially, and they were examined by a veterinary pathologist specializing in mouse pathology. We enumerated bacterial recovery from each organ by comparing cfu on 7H11 agar plates.
Murine Macrophage Infections. Peritoneal exudate cells were obtained from an uninfected mouse peritoneal cavity washed with 8 ml of Hanks' balanced saline solution (HBSS) 3 days after the administration of 2 ml of 3% thioglycolate (Difco). The cells were suspended at a concentration of 5 × 10⁵ cells per ml in culture medium consisting of RPMI medium 1640 supplemented with 10% FCS and 100 μg/ml ampicillin. They were cultured in 24-well plates overnight at 37°C. Nonadherent cells were then removed by gentle washing with warm HBSS, and adherent cells were used as macrophages. Macrophages were infected with wild-type bacillus Calmette-Guérin (3.5 × 10⁵ cfu/ml) or mce1 mutant bacillus Calmette-Guérin (1.8 × 10⁶ cfu/ml), wild-type Erdman (7.5 × 10⁵ cfu/ml) or mce1 mutant Erdman (1.5 × 10⁶ cfu/ml), wild-type H37Rv (1 × 10⁶ cfu/ml) or mce1 mutant H37Rv (1.5 × 10⁶ cfu/ml), or PBS alone for 24 h. The culture supernatant of macrophages was collected, filtered through a 0.2-μM pore membrane, and stored at -80°C until analysis. Tumor necrosis factor α (TNFα) levels were measured by ELISA (R & D Systems).
Kinetic analyses were performed with RAW 264.7 murine macrophage-like cell line (American Type Culture Collection), which was cultured and maintained in DMEM (GIBCO) supplemented with 10% FBS (Omega Scientific, Tarzana, CA) and 1% penicillin/streptomycin (BioWhittaker) in a 5% CO2 humidified incubator at 37°C. Cells were plated at 1 × 10⁵ cells per ml in 24-well tissue culture plates and incubated overnight until they were ≈70% confluent. Viability of cells was monitored for all experimental conditions by trypan blue exclusion. In addition, culture supernatants were harvested, and cell death was assessed by the lactate dehydrogenase-release assay (Roche, Gipf-Oberfrick, Switzerland).
We incubated 104 or 105 bacteria with 105 RAW macrophages in triplicate wells of a 24-well plate for a multiplicity of infection (moi) of 1:10 or 1:1, respectively. After2hofinfection, macrophages were washed three times with DMEM to remove extracellular bacteria. Lipopolysaccharide (1 μg/ml) (Sigma) was used as a positive control, and uninfected or mock-infected (PBS) macrophages served as negative controls for each experiment. For some experiments, RAW macrophages were activated with 30 units/ml recombinant IFN-γ (R & D Systems) 24 h before infection. At least three independent experiments were performed for each strain, and macrophages were infected in triplicate for each experiment. For some of the cytokines, we repeated the infections with primary murine bone marrow macrophages to confirm our observations with RAW cells.
TNFα, IL-4, IL-6, and monocyte chemoattractant protein 1 (MCP-1) produced by RAW macrophages in response to infection with the M. tuberculosis strains were measured by ELISA (R & D Systems). The amount of nitric oxide (NO) produced by macrophages in each experimental infection was assessed in culture supernatant by the Griess colorimetric assay (Promega).
Murine bone marrow macrophages were plated at 5 × 10⁵ cells per well in 24-well plates and incubated overnight. The next day, 300 units of IFN-γ was added to each well, and 24 h later, mycobacteria were added at a moi of 1:1. TNFα and NO levels were measured 24 h after infection.
To control for the effect of potential differences in the number of bacterial organisms interacting with macrophages, we compared intracellular uptake or survival of the organisms by lysing macrophages with 200 μl of PBS/0.1% Triton X-100 and plating serial dilutions on 7H11 agar to enumerate cfu. This was performed at 2 h postinfection (day 0) through day 4. cfu were enumerated after 3-4 wk of plate incubation.
Statistics. Data are presented from representative experiments as the mean ± SE of triplicate infections. Differences between the means of each treatment group were analyzed by Student's t test and were considered significant at P < 0.05.
Results
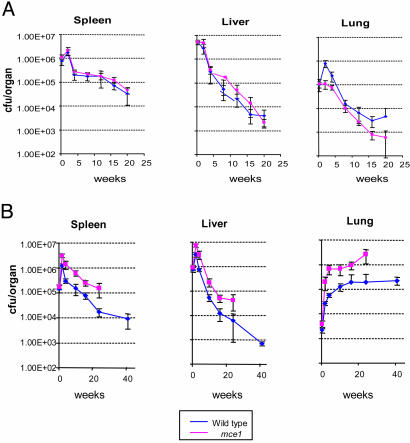
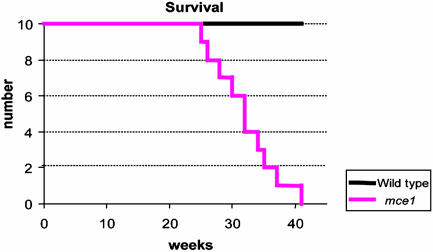
Mouse Virulence Studies. No difference in bacterial cfu recovery from spleen or liver was observed at any time point in mice infected with wild-type or mutant bacillus Calmette-Guérin (Fig. 2A). However, the number of cfu recovered from lungs of mice infected with wild-type bacillus Calmette-Guérin was significantly higher than that recovered from lungs of mice infected with the mce1 mutant bacillus Calmette-Guérin, especially after 20 wk of infection (Fig. 2A). Unexpectedly, in mice infected with M. tuberculosis, the number of cfu recovered even after 2 wk of infection from each of the organs was significantly greater for mice infected with the mce1 mutant strain compared with that in mice infected with the wild-type strain (Fig. 2B). Most importantly, in the lungs, the cfu continued to increase over time in mice infected with the mce1 mutant Erdman strain until the animals died, whereas in mice infected with the wild-type Erdman strain, the number of recovered organisms reached a plateau after ≈17 wk and remained unchanged up to 41 wk of follow-up (Fig. 2B). The mutant-infected mice started to die as early as 27 wk after infection, and by 41 wk, 100% of a group of 10 initially infected mice were dead, whereas all 10 of the wild-type-infected mice remained alive at 41 wk (Fig. 3).
Fig. 2.
Time course of infection after tail vein injection of bacillus Calmette-Guérin wild-type and mce1 mutant (A) and M. tuberculosis Erdman wild-type and mce1 mutant (B). Recovery of the bacteria is enumerated by cfu per organ at 0, 2, 4, 10, 16, 25, and 41 wk after injection. The curve for cfu recovered from mice infected with the M. tuberculosis mce1 mutant stops at ≈27 wk, because all of the initially infected mice were dead by this time point.
Fig. 3.
Survival kinetics of BALB/c mice infected with M. tuberculosis Erdman. Ten mice each were initially infected via tail vein and followed for the indicated number of weeks. By 41 wk, all mice infected with the mce1 mutant strain were dead.
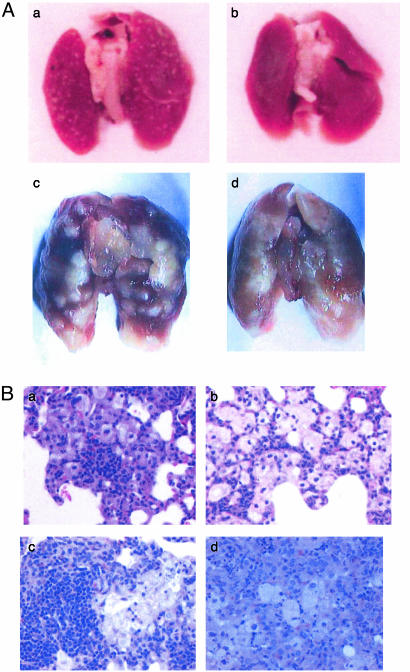
Mouse Pathology Studies. Gross organ examinations revealed that as early as 16 wk after infection, the lung surface of mice infected with the wild-type bacillus Calmette-Guérin showed a greatly increased number (>500) of discrete well-circumscribed granulomas (Fig. 4Aa) compared with the lungs of mutant-infected mice (<20) (Fig. 4Ab). In Erdman M. tuberculosis-infected mice, the lungs infected with the wild-type strain showed progressively enlarging granulomas with sharp circumscribed borders (Fig. 4Ac), whereas the lungs of mutant-infected mice showed progressively enlarging granulomas that were diffuse, poorly circumscribed, and coalescing (Fig. 4Ad). Differences in the gross pathology changes between the Erdman mutant and wild-type-infected mice were evident as early as 10 wk of infection.
Fig. 4.
(A) Gross examination of lungs of BALB/c mice infected with bacillus Calmette-Guérin or M. tuberculosis. Lungs of mice were examined after 16 wk of infection with the wild-type bacillus Calmette-Guérin (a) or bacillus Calmette-Guérin mce1 mutant (b). Lungs of mice were examined after 32 wk of infection with wild-type M. tuberculosis Erdman (c) or M. tuberculosis Erdman mce1 mutant (d). Lung lesions with discrete well circumscribed borders are evident in wild-type-infected lungs, whereas lungs infected with either of the mce1 mutants show coalescing poorly circumscribed lesions. (B) Histological examination (hematoxylin/eosin stain) of lung sections of BALB/c mice infected with bacillus Calmette-Guérin or M. tuberculosis Erdman. At 12 wk of infection, there is greater and denser lymphocyte infiltration in lungs infected with the wild-type bacillus Calmette-Guérin strain (a), whereas the lungs infected with the mutant bacillus Calmette-Guérin show many foamy macrophages with sparse migration of lymphocytes (b). At 16 wk of infection with M. tuberculosis, lungs infected with the wild-type strain show densely packed lymphocytes surrounded by macrophages (c), whereas lungs infected with the mutant strain show mostly macrophages with diffuse distribution of the lymphocyte population (d). (Magnification in B, ×400.)
Histologic examination revealed that around 12 wk, the lungs of mice infected with the mutant bacillus Calmette-Guérin were typically characterized by granulomatous pneumonia with multifocal small granulomas consisting of macrophages containing eosinophilic cytoplasm, and occasional granulomas consisting of epithelioid binucleated macrophages with peripheral infiltrate of lymphocytes and plasma cells (Fig. 4Bb). In the wild-type bacillus Calmette-Guérin-infected mice, there was moderate to severe granulomatous pneumonia characterized by multiple foci of granulomas of varying degrees of severity (Fig. 4Ba). At 16 wk, lungs of mice infected with the wild-type Erdman strain contained a higher density of lymphocytes and fewer coalescent granulomas (Fig. 4Bc), whereas lungs infected with the mutant Erdman strain contained large epithelioid granulomas with intralesional cholesterol clefts and lymphocytic and plasma cell infiltration affecting 25-50% of the lung parenchyma (Fig. 4Bd).
In bacillus Calmette-Guérin-infected mice, despite nonsignificant differences between wild-type and mutant strain-infected mice in the number of cfu recovered from lungs up to 15 wk, there were dramatic gross and histologic differences in the number and size of granulomatous lesions detected. Although it is difficult to attribute the differences in the extent of lung pathology in Erdman-infected mice to the number of organisms present in the lungs vs. the effect of mce1 products, the observation we made with bacillus Calmette-Guérin-infected mice, controlling for the number of organisms recovered, suggests that the absence of mce1 expression contributes to an aberrant host cell response that leads to less well-organized granuloma formation.
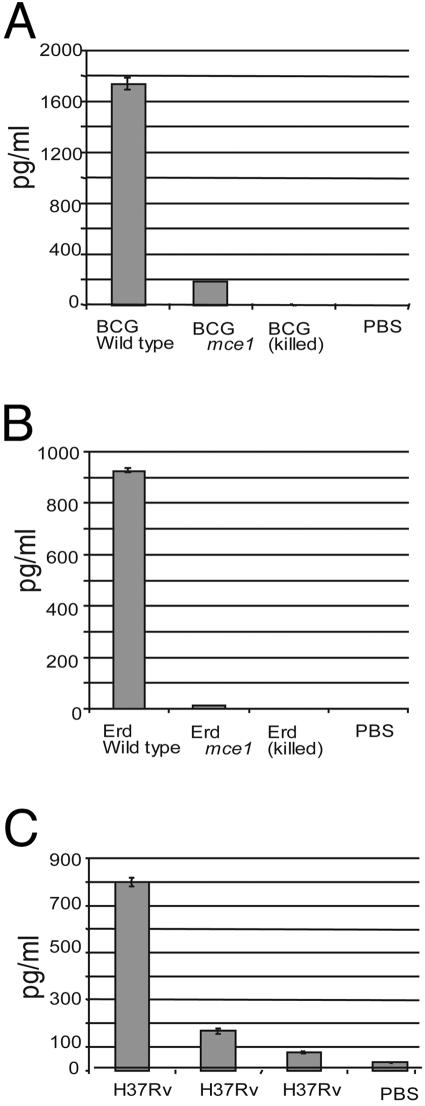
Cytokine Production by Infected Murine Macrophages. Because TNFα is essential for granuloma formation (11, 12), we analyzed TNFα production by thioglycolate-stimulated murine peritoneal macrophages infected ex vivo with bacillus Calmette-Guérin, Erdman, or H37Rv. The levels of TNFα expression as measured by ELISA were significantly less in cells infected with the bacillus Calmette-Guérin, Erdman, or H37Rv mce1 operon mutant strains compared with those infected with the respective wild-type strains (Fig. 5).
Fig. 5.
TNFα determinations in BALB/c peritoneal macrophages infected ex vivo with bacillus Calmette-Guérin or M. tuberculosis. TNFα levels were measured in cells infected with live bacillus Calmette-Guérin wild-type or mce1 mutant (A), M. tuberculosis Erdman or mce1 mutant (B), and M. tuberculosis wild-type H37Rv or mce1 mutant (C). Control cells were mock-infected with PBS in each experiment.
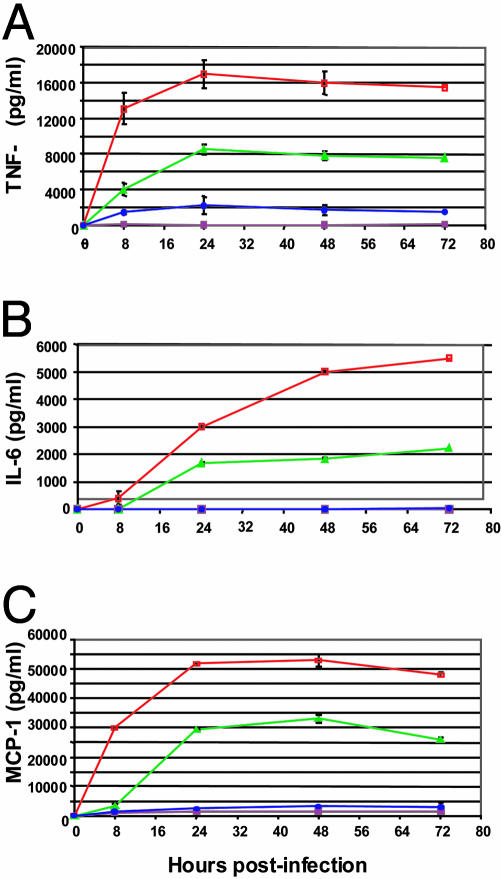
To further characterize the interaction of mce1 mutants with macrophages, we performed kinetic studies with RAW macrophages. Similar to the observation made with peritoneal macrophages, RAW macrophages infected with H37Rv mce1 mutant produced ≈4- to 6-fold less TNFα than macrophages infected with wild-type H37Rv after 24 h of infection. (P < 0.05) (Fig. 6A). The H37Rv mce1 mutant was significantly reduced in its ability to stimulate early TNFα production (P < 0.05) (8 h postinfection), and by 72 h postinfection, the H37Rv mce1 mutant still failed to elicit significant TNFα production (Fig. 6A).
Fig. 6.
Kinetic analysis of TNFα (A), IL-6 (B), and MCP-1 (C) production by RAW macrophages infected with H37Rv wild-type (green) or mce1 mutant (blue) strains at a moi of 1:1. Controls included uninfected RAW cells (maroon) or lipopolysaccharide-treated cells (red).
In addition to a defect in TNFα production, RAW macrophages infected with H37Rv mce1 mutant produced very little IL-6 or MCP-1 over a 72-h period (Fig. 6 B and C). IL-6 production peaked at 72 h for H37Rv wild-type-infected RAW cells, reaching >2,000 pg/ml. However, cells infected with H37Rv mce1 mutant produced levels of IL-6 equivalent to that of uninfected cells (<100 pg/ml) (Fig. 6B). After 24 h, RAW macrophages produced ≈11-fold less MCP-1 when infected with H37Rv mce1 mutant compared with the cells infected with wild-type H37Rv. MCP-1 expression by H37Rv wild-type-infected cells peaked at 48 h postinfection to >30,000 pg/ml, whereas the mce1 mutant-infected cells produced significantly less MCP-1 (3,000 pg/ml) (P < 0.05) (Fig. 6C). IL-4 expression was measured in RAW cells infected for 24 h for comparison. IL-4 was produced by RAW cells at detectable levels but showed no significant difference between cells infected with the Erdman mce1 mutant (80 pg/ml, SE 6.9) or the wild-type (74 pg/ml, SE 4.8) strain (P > 0.05).
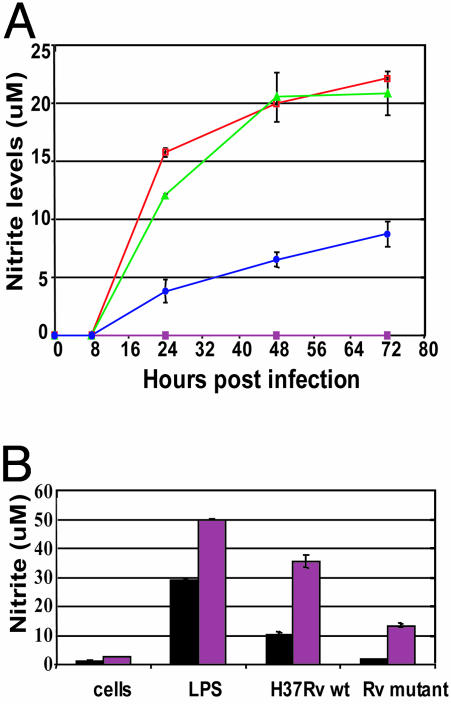
NO Production and Intracellular Growth. We also measured the kinetics of NO production in infected RAW macrophages up to 72 h. Over the course of the infection, H37Rv mce1 stimulated significantly less nitrite production than did H37Rv wild type (P < 0.05, Fig. 7A). NO production by RAW macrophages in response to infection with H37Rv mce1 was 3- to 4-fold less than that stimulated by H37Rv wild type after 24 h of infection. Moreover, by 72 h postinfection, the mce1 mutant failed to induce NO at levels induced by wild-type H37Rv as early as 24 h postinfection. Similar differences in NO production were also observed between Erdman wild-type and Erdman mce1 mutantinfected macrophages (data not shown).
Fig. 7.
(A) Kinetic analysis of nitrite production by RAW macrophages infected with H37Rv wild-type (green) or mce1 mutant (blue) strains at a moi of 1:1. Controls included uninfected RAWs (solid squares) or lipopolysaccharide-treated cells (red). (B) Nitrite production by untreated (black bar) and IFN-γ-pretreated (maroon bar) RAW macrophages infected with H37Rv wild-type or mce1 mutant strains (moi 1:1) 24 h after infection.
When equal cfu for each strain were added to macrophages, there was no significant difference in the number of bacteria recovered (2.1-3.9 × 10⁴ cfu/ml) from infected RAW cells 2 h postinfection, indicating that there were no differences in the ability of the strains to invade RAW macrophages (see graphs in Fig. 12A, which is published as supporting information on the PNAS web site). However, after 2 days of infection, there was a greater number of bacteria recovered from cells infected with H37Rv mce1 mutant (1.3 × 10⁵ cfu/ml) than cells infected with H37Rv wild type (2.5 × 10⁴ cfu/ml) (P < 0.05). The mce1 mutant continued to proliferate up to day 4, at which time the experiment was terminated due to decreased cell viability. In contrast to the mce1 mutant, the cfu recovered from the wild-type-infected cells remained constant (2 2.5 × 10⁴ cfu/ml) over 4 days, although after 4 days, the cfu recovery of the wild-type strain increased. This difference in intracellular proliferation was also observed when RAW cells were infected with the Erdman wild-type and mce1 mutant strains (data not shown).
Because macrophages infected with the mce1 mutant strains produced significantly less NO than wild-type-infected cells, and because NO has been shown to be bacteriostatic to M. tuberculosis in vitro, we tested whether pretreatment of the macrophages with IFN-γ could enhance the NO production of macrophages infected with the mce1 mutant and thus inhibit its intracellular growth. Pretreatment of macrophages with IFN-γ did increase the nitrite levels of H37Rv mce1 mutant-infected RAW cells to that of wild-type-infected RAW cells (but the levels were still significantly reduced compared with wild-type-infected RAW cells also pretreated with IFN-γ) (Fig. 7B). Treatment of the RAW cells with IFN-γ enabled the macrophages to suppress the growth of the mce1 mutant strain intracellularly (see Fig. 12B).
Coinfection with H37Rv Wild-Type and mce1 Mutant Strains. To test whether the mce1 mutant strain directly inhibited macrophage activation rather than failed to induce the macrophage's response to infection, we coinfected RAW cells with the H37Rv wild-type and H37Rv mce1 strains at a moi of 2:1. Coinfected macrophages produced TNFα (9,600 ± 910 pg/ml) and NO levels (11.9 ± 0.6 μM) equal to that induced by infection with wild-type H37Rv alone (8,840 ± 642 pg/ml and 11.1 ± 0.7 μM, respectively). Furthermore, growth and survival of each strain were determined on 7H11 plates with and without 40 μg/ml hygromycin at days 0, 2, and 4. In coinfected macrophages, a similar number of cfu (2-3.8 × 10⁴ cfu/ml) were recovered for each strain over the infection period, and no growth was observed, suggesting that the activated response of the macrophage to the wild-type strain was sufficient to inhibit the growth of the mce1 mutant strain (Fig. 12C). However, it should be noted that the possible suppressive effect of the mutant strain, even if it had such an effect, may not have been detectable at the moi used in this experiment.
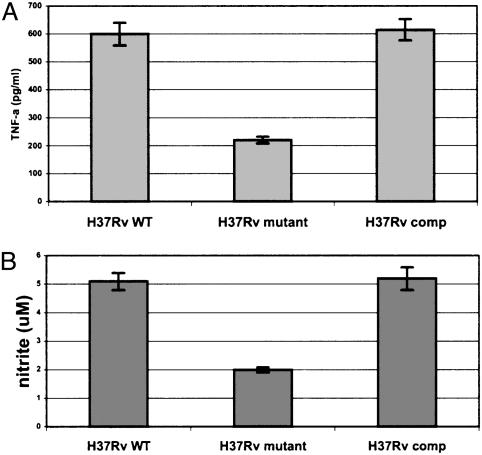
Complementation of the H37Rv mce1 Mutant. IFN-γ-stimulated bone marrow macrophages derived from the femurs of 6- to 8-wk-old BALB/c mice were infected with 1 × 10⁵ H37Rv wild-type, mce1 mutant, or the complemented M. tuberculosis H37Rv strain. The levels of TNFα and NO production by macrophages infected with the complemented strain were equivalent to that observed with the wild-type strain, supporting the causal role of the mce1 operon products in the observed phenotype of the mutant (Fig. 8).
Fig. 8.
TNFα (A) and nitrite (B) production by IFN-γ-treated murine bone marrow-derived macrophages infected with H37Rv wild-type, mutant, or mce1 operon-complemented strain of M. tuberculosis. The cells were infected with 1 × 10⁵ bacilli at a moi of 1:10, and the TNFα or nitrite measurements were made at 24 h of infection. Each bar represents a mean value ± SD of infection done in triplicate per strain.
Discussion
The disruption of the mce1 operon in M. tuberculosis led to hypervirulence of the mutant strain and aberrant granuloma formation in mice. Furthermore, murine macrophages infected ex vivo with the mce1 mutant strains, compared with the corresponding wild-type strains, were reduced in their ability to express TNFα, IL-6, MCP-1, and NO, but not IL-4. The mce1 mutant complemented with the mce1 operon genes was restored in its ability to induce the proinflammatory response by the macrophages. These observations are consistent with the suggestion that the mce1 operon products are associated with the induction of a proinflammatory response or T helper 1-type immunity in mice.
In the mouse infection, we observed that M. tuberculosis and M. bovis bacillus Calmette-Guérin disrupted in the mce1 operon failed to elicit well organized granuloma formation. Lungs of M. tuberculosis wild-type and bacillus Calmette-Guérin wild-type-infected mice showed numerous well organized granulomas that appeared to be associated with control of the proliferation of the bacilli, as evidenced by the plateau in the cfu recovery curve after 15-17 wk of infection (Fig. 2B). In contrast, the absence of organized granulomas in the M. tuberculosis mce1 mutant-infected mice was associated with a significantly greater number of bacilli in the lungs, which eventually killed the mice (Figs. 2B and 3). The observed granuloma formation in mice infected with the mce1-disrupted M. tuberculosis or bacillus Calmette-Guérin strains resembles that observed in TNFα-deficient mice infected with M. tuberculosis (13-17). These observations suggest that a certain level of proinflammatory response is necessary for M. tuberculosis to establish a stable nonproliferative state of infection in the animal.
The observed differences in proinflammatory response could be related to the differences in the number of intracellular organisms. However, the results from the in vivo study with bacillus Calmette-Guérin-infected mice as well as the ex vivo macrophage infection studies that controlled for the number of recovered organisms show that the proinflammatory cellular and cytokine responses depend more on the presence of the mce1 operon in the infecting strain than the differences in the number of organisms. That is, the diminished proinflammatory response appears to allow the enhanced proliferation of the intracellular mutant strain.
At this time, we do not know which product or set of products of the mce1 operon mediates the hypervirulence and macrophage cytokine expression patterns we describe above. The complemented strain was able to stimulate TNFα and NO expression in murine macrophages in vitro, which provides evidence for the causal role of the operon in the induction of a T helper 1-type immune response. Furthermore, we found that all of the independent mce1 mutants (bacillus Calmette-Guérin mce1A, M. tuberculosis Erdman mce1A, and M. tuberculosis H37Rv yrbE1B) we have constructed yielded the same pattern of cytokine response by the mouse macrophages. The disruption of cell wall proteins encoded by some of the mce1 genes (mceA-F) may alter the structure of nonprotein cell wall components, which in turn may have an immunomodulatory effect. Or, the Mce1 proteins themselves may form a complex in the cell wall that transports products extracellularly that have a proinflammatory effect. One of the mce1 proteins (Mce1E) is a putative lipoprotein, which may induce proinflammatory responses by macrophages via toll-like receptor 2 (18, 19).
Manca et al. (20) recently examined the differential response of mice to infection by using clinical M. tuberculosis isolates (20). One isolate HN878 was found to be hypervirulent in mice, and they found that this phenotype was associated with 2- to 4-fold lower levels of TNFα, IL-6, IL12, and IFNγ mRNA in lungs of mice infected with this strain (20). They suggested that the hypervirulence of this strain may be due to failure of the strain to stimulate T helper 1 type immunity (20). Our findings are consistent with this view and raise an intriguing possibility that the different clinical manifestations, latent infection, rapidly progressive disease, and reactivation tuberculosis, after M. tuberculosis infection may be influenced by a regulated expression of the Mce products.
Hypervirulence has recently been reported with another human intracellular pathogen, Leishmania major (21). Cunningham et al. (21) reported that L. major disrupted in pteridine reductase 1 express low levels of tetrahydrobiopterin, which is needed to control differentiation of the parasite into the metacyclic promastigote. Such mutants were arrested in the amastigote stage, were highly infectious to mice, and produced larger cutaneous lesions. More recently, four M. tuberculosis strains with mutations in distinct two-component regulatory system genes were shown to become hypervirulent in the SCID mouse model, suggesting that M. tuberculosis has a set of genes that enables the organism to keep its in vivo proliferation in check even in an immunocompromised animal (22). These observations suggest that the disruption of genes of pathogens associated with persistent infection may unmask the organism's full virulence potential. The M. tuberculosis mce1 operon may have evolved to “fine-tune” the host immune response to the bacillus' advantage to establish latent infection without causing active disease in the host.
Supplementary Material
Acknowledgments
We thank Ryan Senaratne, Takao Fujimura, and Marvin Ryou for assistance with the animal studies and gene disruption experiments. This work was supported by a grant from National Institute of Allergy and Infectious Diseases, National Institutes of Health (AI35266).
Abbreviations: MCP-1, monocyte chemoattractant protein 1; cfu, colony-forming unit; TNFα, tumor necrosis factor α; moi, multiplicity of infection.
This paper was submitted directly (Track II) to the PNAS office
References
- 1.Parrish, N. M., Dick, J. D. & Bishai, W. R. (1998) Trends Microbiol. 6, 107-112. [DOI] [PubMed] [Google Scholar]
- 2.Mckinney, J. D., zu Bentrup, D. H., Munoz-Elias, E. J., Miczak, A. Cehn, B., Chan, W., Swenson, D., Sacchettini, J. C., Jacobs, W. R. & Russell, D. G. (2000) Nature 406, 735-738. [DOI] [PubMed] [Google Scholar]
- 3.Glickman, M. S., Cox, J. S. & Jacobs, W. R. (2000) Mol. Cell 5, 717-727. [DOI] [PubMed] [Google Scholar]
- 4.Zahrt, T. C. & Deretic, V. (2001) Proc. Natl. Acad. Sci. USA 98, 12706-12711. [DOI] [PMC free article] [PubMed] [Google Scholar]
- 5.Arruda, S., Bomfim, G., Knights, R., Huima-Byron, T. & Riley, L. W. (1993) Science 261, 1454-1457. [DOI] [PubMed] [Google Scholar]
- 6.Chitale, S., Ehrt, S., Kawamura, I., Fujimura, Y., Shimono, N., Anand, N., Lu, S., Cohen-Gould & L. Riley, L. W. (2001) Cell Microbiol. 3, 247-254. [DOI] [PubMed] [Google Scholar]
- 7.Casali, N., Konieczny, M., Schmidt, M. A. & Riley, L. W. (2002) Infect. Immun. 70, 6846-6852. [DOI] [PMC free article] [PubMed] [Google Scholar]
- 8.Cole, S. T., Brosch, R., Parkhill, J., Garnier, T., Churcher, C., Harris, D., Gordon, S. V., Eiglmeier, K., Gas, S., Barry, C. E., III, et al. (1998) Nature. 393, 537-544. [DOI] [PubMed] [Google Scholar]
- 9.Hinds, J., Mahenthiralingam, E., Kempsell, K. E., Duncan, K., Stokes, R. W., Parish, T. & Stoker, N. G. (1999) Microbiology 145, 519-527. [DOI] [PubMed] [Google Scholar]
- 10.Parish, T. & Stoker, N. G. (2000) Microbiology 146, 1969-1975. [DOI] [PubMed] [Google Scholar]
- 11.Saunders, B. M. & Cooper, A. M. (2000) Immunol. Cell. Biol. 78, 334-341. [DOI] [PubMed] [Google Scholar]
- 12.Orme, I. M. & Cooper, A. M. (1999) Immunol. Today 20, 307-312. [DOI] [PubMed] [Google Scholar]
- 13.Kindler, V., Sappino, A., Grau, G., Piguet, P. & Vassalli, P. (1989) Cell 56, 731-740. [DOI] [PubMed] [Google Scholar]
- 14.Flynn, J. L., Goldstein, M. M., Chan, J., Triebold, K. J., Pfeffer, K., Lowenstein, C. J., Schreiber, R., Mak, T. W. & Bloom, B. R. (1995) Immunity 2, 561-572. [DOI] [PubMed] [Google Scholar]
- 15.Senaldi, G., Yin, S., Shaklee, C. L., Piguet, P.-F., Mak, T. W. & Ulich, T. R. (1996) J. Immunol. 157, 5022-5026. [PubMed] [Google Scholar]
- 16.Bean, A. G., Roach, D. R., Briscoe, H., France, M. P., Korner, H., Sedgwick, J. D. & Britton, W. (1999) J. Immunol. 162, 3504-3511. [PubMed] [Google Scholar]
- 17.Mohan, V. P., Scanga, C. A., Yu, K., Scott, H. M., Tanaka, K. E., Tsang, E., Tsai, M. C., Flynn, J. L. & Chan, J. (2001) Infect. Immun. 69, 1847-1855. [DOI] [PMC free article] [PubMed] [Google Scholar]
- 18.Underhill, D., Ozinsky, A., Smith, K. & Aderem, A. (1999) Proc. Natl. Acad. Sci. USA 96, 14459-14463. [DOI] [PMC free article] [PubMed] [Google Scholar]
- 19.Brightbill, H., Libraty, D., Drutzik, S., Yang, R., Belisle, J., Bleharski, J., Maitland, M., Norgard, M., Plevy, S., Smale, S., et al. (1999) Science. 285, 732-735. [DOI] [PubMed] [Google Scholar]
- 20.Manca, C., Tsenova, L., Begtold, A., Freeman, S., Tovey, M., Musser, J. M., Barry, C. E., III., Freedman, V. H. & Kaplan, G. (2001). Proc. Natl. Acad. Sci. USA 98, 5752-5757. [DOI] [PMC free article] [PubMed] [Google Scholar]
- 21.Cunningham, M. L., Titus, R. G., Turco, S. J. & Beverley, S. M. (2001) Science 292, 285-287. [DOI] [PubMed] [Google Scholar]
- 22.Parish, T., Smith, D. A. Kendall, S., Casali, N., Bancroft, G. J. & Stoker, N. G. (2003) Infect. Immun. 71, 1134-1140. [DOI] [PMC free article] [PubMed] [Google Scholar]
Associated Data
This section collects any data citations, data availability statements, or supplementary materials included in this article.


