

Abstract
GABAA receptors (GABAARs) are ligand gated chloride ion channels that mediate overall inhibitory signaling in the CNS. A detailed understanding of their structure is important to gain insights in e.g. ligand binding and functional properties of this pharmaceutically important target. Homology modeling is a necessary tool in this regard because experimentally determined structures are lacking. Here we present an exhaustive approach for creating a high quality model of the α1β2γ2 subtype of the GABAAR ligand binding domain, and we demonstrate its usefulness in understanding details of orthosteric ligand binding.
The model was constructed by using multiple templates and by incorporation of knowledge from biochemical/pharmacological experiments. It was validated on the basis of objective energy functions, its ability to account for available residue specific information, and its stability in molecular dynamics (MD) compared to that of two homologous crystal structures. We then combined the model with extensive structure-activity relationships available from two homologous series of orthosteric GABAAR antagonists to create a detailed hypothesis for their binding modes. Excellent agreement with key experimental data was found, including the ability of the model to accommodate and explain a previously developed pharmacophore model. A coupling to agonist binding was thereby established and discussed in relation to activation mechanisms.
Our results highlight the importance of critical evaluation and optimization of each step in the homology modeling process. The approach taken here can greatly aid in increasing the understanding of GABAARs and related receptors where structural insight is limited and reliable models are difficult to obtain.
Keywords: Homology modeling, spatial restraints, molecular dynamics, ligand docking, GRID analysis, 5-(4-piperidyl)-3-isoxazolol, 4-(4-piperidyl)-1-hydroxypyrazole, 4-PIOL, 4-PHP
INTRODUCTION
γ-Aminobutyric acid (GABA, Figure 1), the major inhibitory neurotransmitter in vertebrate central nervous system (CNS), exerts its action primarily by activating the GABAA receptors (GABAARs). This system is of high pharmaceutical relevance due to its important roles in cognition, learning and memory, as well as its involvement in e.g. anxiety, schizophrenia, sleep disorders, and epilepsy.1 A rich and complex pharmacology has been observed and exploited for the GABAARs, with benzodiazepines (BZD), anesthetics, and ethanol as key examples of drugs influencing this system by binding to distinct allosteric binding sites in the receptor.1 Orthosteric ligands also have a potential in pharmaceutical treatment2 although currently they are used mostly as pharmacological tools. Important examples of orthosteric ligands are shown in Figure 1 and include the potent agonist muscimol,3,4 the weak partial agonist 5-(4-piperidyl)-3-isoxazolol (4-PIOL),5,6 its recently characterized analog 4-(4-piperidyl)-1-hydroxypyrazole (4-PHP),7 and the hallmark selective antagonists bicuculline4 and gabazine (also known as SR-95531).8
Figure 1.

Chemical structures of the GABAAR agonists GABA and muscimol, and the antagonists 4-PIOL, 4-PHP, gabazine, and bicuculline.
The GABAARs are ligand gated chloride ion channels belonging to the superfamily of Cys-loop receptors which also comprises the nicotinic acetylcholine receptors (nAChRs), serotonin type 3 (5-HT3) receptors, and glycine receptors. They are all membrane bound proteins composed of five subunits assembled around the central ion conducting pore. Each subunit has an N-terminal extracellular (EC), a transmembrane (TM), and an intracellular domain. The GABAAR is a heteromeric complex, and several subtypes exist due to the 19 different subunits that have been identified: α1-6, β1-3, γ1-3, δ, ε, θ, π, and ρ1-3 (the ρ subunits form homopentameric receptors also known as GABACRs). The most abundant form found in the CNS consists of two α1, two β2, and one γ2 subunits that assemble counter-clockwise in the order β2-α1-β2-α1-γ2 when viewed from the extracellular side. GABA binds to the two orthosteric sites that are located in the EC domain, in the interfaces between the β2 and α1 subunits that form the “principal” and “complementary” sides, respectively.9,10
In spite of intense research over the past decades, a structure has yet to be produced for the GABAARs. Hence, information of which amino acids are important for receptor function and ligand binding has mainly been derived from biochemical and pharmacological studies. Several residues line the orthosteric binding site, the most important of which will be briefly mentioned in the following. In the GABAAR α1β2γ2 subtype, β2 Y97, Y157 and Y205, and α1 F64 line the binding pocket and are highly important for receptor function.11-16 They likely form the so-called “aromatic box”, which is a conserved feature among the Cys-loop receptors. Further, four arginines – β2 R207, and α1 R66, R119, and R131 – are present in or near the pocket. All except α1 R131 have been suggested to be directly involved in ligand binding, but the major body of evidence points towards R66 as the main interaction partner for the acidic moiety of orthosteric ligands.14-21 Finally, β2 E155 is a pivotal residue in terms of both receptor function and ligand binding.22
Detailed knowledge of the protein structure is of paramount importance for understanding biochemical and pharmacological data and exploiting these in structure based design of new drug candidates. Because an experimentally determined structure of the GABAAR remains to be solved, a good structural model of the receptor is required to facilitate these investigations.
Templates for such a model have appeared in the form of 3D structures of related receptors, perhaps most notably the acetylcholine binding protein (AChBP) isolated from the freshwater snail species Lymnaea stagnalis (Ls),23,24 Aplysia californica (Ac),25,26 and Bulinus truncatus (Bt).27 These proteins have the architecture of the EC domain of Cys-loop receptors, although the overall sequence identity is low (around 20%). This also means that in regions corresponding to the interface between the EC and TM domain in Cys-loop receptors, the fold or conformation does not accurately reflect that of full-length receptors. However, they bind standard nAChR ligands, and important insights have been obtained from the AChBP co-crystallized with these ligands. A high-resolution crystal structure of the EC domain of the mouse nAChR α1 subunit has also been published,28 and although the pentameric assembly and hence the ligand binding sites are lacking, it confirms a high degree of resemblance to the AChBPs. Insight into the full-length structure of Cys-loop receptors has been provided by the electron microscopy structure of the muscle type nAChR from the marbled electric ray Torpedo marmorata29 and the recent X-ray structures of pentameric ligand gated ion channels from the bacteria Erwinia chrysanthemii (ELIC)30 and Gloeobacter violaceus (GLIC).31,32 However, with 4 Å resolution important details are missing in the Torpedo structure, and recent NMR studies have questioned the correctness hereof in crucial areas.33 The ELIC and GLIC structures have higher resolution but also very low sequence identities with the eukaryotic Cys-loop receptors. Moreover, structural features of ELIC and GLIC in areas corresponding to the orthosteric binding sites of Cys-loop receptors differ markedly from the other structures, most notably the so-called loops B and C that are important binding site elements. Thus, for homology modeling purposes the existing structures all suffer from drawbacks that must be considered when using them as templates.
Several descriptions of GABAAR homology models have been published to date, most of which have used a single template for the EC domain. Typically, the Ls-AChBP structure originally published by Brejc et al.24 has been used,12,34-42 but also the later reported nicotine bound AChBP43 and the Torpedo structures have been employed.17,37,42,44 With the crystal structures from different species that have now become available, solely relying on a single template would prevent crucial information from being incorporated into the model. It would thus be reasonable to include several templates, especially when considering the relatively low sequence identity that exists between the GABAARs and the available templates. Mokrab et al.44 used an AChBP structure from each of the three snail species (Ac, Ls, Bt) as template in one of their models. However, using only the AChBPs that lack the TM domain of the functioning membrane bound receptor will likely result in a problematic structure in interface regions where the EC and TM domains interact, especially the Cys-loop. Also, the three structures used in that study have markedly different conformations in several loop regions, most notably in the so-called loop C, which is a highly flexible hairpin shaped loop that lines the binding pocket. Therefore, in regions where templates deviate from each other, selecting the most relevant is necessary for obtaining a reliable model.
Some of the above referred studies additionally report using the model to predict how ligands (typically GABA) bind to the orthosteric site.12,17,41,44 However, although a wealth of experimental data have pointed to which residues in the GABAAR are important for ligand binding and/or function, no consensus has been reached on how ligands are oriented in the site. Being a small and flexible molecule, GABA is not ideal for establishing a binding mode. Ligand series with a more rigid scaffold and for which extensive structure-activity relationships (SAR) exist are more likely to give the necessary information in this regard. Such compounds are available through the antagonists based on the 4-PIOL scaffold which is structurally similar to muscimol (Figure 1). This series of orthosteric GABAAR ligands has been studied extensively in recent years through the development of systematic SAR data and a pharmacophore model representing the structure of the orthosteric site.45-48 Very recently, the 4-PHP scaffold was designed to provide new insight to the properties of the binding pocket by introducing an additional position for chemical modification (Figure 1).7
With the combination of experimental data, new and more diverse structural templates, and relevant ligand SAR, a firm basis exists for creating a reliable GABAAR model that can aid in interpreting GABAAR ligand binding and functional data.
We here present the structure and validation of a model of the EC domain of the GABAAR α1β2γ2 pentameric structure based on multiple templates, with particular focus on the orthosteric binding site. Our approach consists of a structure based template alignment followed by a thorough multiple sequence alignment, careful selection of structural templates, and an iterative model building protocol with loop optimizations and incorporation of residue specific restraints derived from experimental data and/or inferred roles of individual amino acids. We demonstrate that our procedure improves model quality as measured by various scoring and energy functions, and hence leads to a more reliable structure. Through ligand docking, binding pocket analysis, and comparison with experimental knowledge and ligand SAR data, we present a hypothesis for the binding modes of 4-PIOL and 4-PHP based antagonists. Our results provide a basis for structure-based design of orthosteric GABAAR ligands and enable a rational approach to designing and interpreting pharmacological experiments in order to expand current knowledge of the GABAAR structure and function.
METHODS
Templates and sequences
Templates chosen for homology modeling include the AChBP structures from Ac (Ac-AChBP; PDB49 code: 2byn)50 and Ls (Ls-AChBP; PDB: 1ux2),43 the mouse nAChR α1 subunit (PDB: 2qc1),28 and the ELIC structure (PDB: 2vl0).30 In addition to these, the AChBP X-ray structure from Bt (Bt-AChBP; PDB: 2bj0),27 the Torpedo nAChR electron microscopy structure (PDB: 2bg9),29 and the GLIC crystal structure (PDB: 3eam)51 were used in the sequence alignment process (see below). To ensure accordance with the deposited PDB structure files, all template sequences and their corresponding numbering are those found herein. All human nAChR and GABAAR sequences for the EC part of the mature receptor subunits were retrieved from the UniProt database.52 In accordance with consensus in the literature, GABAAR sequence numbering in this study is defined so that the subunits in the model start at α1 9-DNTT, β2 7-SNMS, and γ2 22-VPEG (cf. sequences in Figure 2).
Figure 2.

Multiple sequence alignment of Ac, Ls, and Bt AChBPs, and the EC domains of ELIC and GLIC, the mouse nAChR (M. ACh) α1 subunit, the Torpedo nAChR (T. ACh) α, β, γ and δ subunits, and, highlighted in gray, the human GABAAR α1, β2 and γ2 subunits. Secondary structure features of the GABAAR model are shown above the alignment rows, with α, β and L denoting α-helical, β-strand, and loop segments, respectively. The traditional loop notations for binding site regions (loops A-F; see e.g. ref. 85), and the signature Cys-loop, are indicated below each row. Regions highlighted in blue indicate the parts of the corresponding experimental structures that were used as template in the initial model building (step 1); for instance, only Ac-AChBP was used to model the first 12 residues of the α1 helix, whereas all four templates were used for e.g. the β1-β2 strands. Frames indicate regions in the GABAAR model subjected to loop sampling. GABAAR residues predicted from ligand docking to engage in direct interactions with the 4-PIOL derived antagonists are highlighted in red.
Sequence alignment
A structure based sequence alignment of all templates was established using the structural alignment feature (the super command) of PyMOL53 and can be seen from the mutual template alignments in Figure 2. Hereafter, a “profile alignment” of all human nAChR sequences to the structure alignment was performed with ClustalX v. 2.0.12,54 iterating the final alignment and otherwise keeping standard settings. The alignment was manually altered so that the two-residue gap at the N-terminal α-helix found in most nAChR sequences compared to the Torpedo δ subunit consistently aligned the residues I13-V14 of that subunit, in agreement with the structural alignment. The resulting alignment was used in a second round of profile alignment of all human GABAAR sequences hereto with the same settings as previously.
Finally, the GABAAR sequence alignment was edited manually in the following regions (cf. Figure 2): 1) in and after the N-terminal α-helix, 2) in the L5-β5’ segment, 3) in loop F, and 4) in loop C. The rationale behind this is addressed in Supporting Information. A comparison of the raw ClustalX alignment and that used for the actual modeling in these regions is provided in Supporting Information Fig. S.I.-2.
Model building
A detailed description of the homology modeling procedure is provided in Supporting Information. Briefly, using Modeller 9v755 the process was conducted as an iterative protocol in three steps: 1) generation of initial models, 2) sampling of the β5-L5’ loop and loop F, and 3) building the refined model based on the two previous steps. The process is shown schematically in Figure 3.
Figure 3.

Schematic overview of the iterative multi-step model building procedure taken in this study.
In step 1, the alignment shown in Figure 2 was used to generate 400 initial models. The extent to which each of the four templates was used is also indicated in Figure 2, and the rationale behind the selection hereof is as follows: In general, large parts of the β-sheet core were modeled on all four templates because these regions are highly similar. In areas with more variation, only one or a few templates were selected. The Ac-AChBP α1 helix is longest and was chosen as template in order to start the GABAAR model at the earliest possible residue position. The α1-L1 border (corresponding to the GABAAR residues α1 L21-R30) was based on the mouse nAChR α1 subunit because it contains the conserved Tyr residue corresponding to GABAAR α1 Y25. This residue seems to play a significant structural role in the mouse nAChR α1 subunit as it gives this region a conformation distinct from that of the AChBPs. The remainder of L1 was modeled on Ls-AChBP so as to avoid gaps in the alignment, and also because it follows the mouse nAChR α1 subunit better than does the Ac-AChBP. In the L3-L4 region the Ac-AChBP and mouse nAChR α1 subunit follow each other closely and correspond best to the GABAAR in terms of number of residues. The β4-L5 region was modeled on ELIC because it was found to optimally position β2-Y97 inside the binding pocket11 and letting it engage in a cation-π interaction.12 ELIC also served as template for the Cys-loop because of the presence of an ion channel in the structure which likely holds the Cys-loop in a conformation relevant to the functional receptor. The GABAAR binding site residues β2 E155 and Y157 in loop B (β7-L8) correspond well to the ELIC E131 and F133, again suggesting ELIC to be the best template here. In loop F (L9) the Ac-AChBP, ELIC and mouse nAChR α1 subunit were used to some extent in the first half where their residues are positioned so that the corresponding GABAAR residues obtained an orientation in apparent accordance with the substituted cysteine accessibility method (SCAM) study of Newell & Czajkowski.36 Finally, loop C was based on the Ac-AChBP to obtain an open conformation corresponding to what is expected for the inactive receptor state.
From step 1, two models, termed model 1a and 1b, were chosen as the overall best (according to the criteria given below). They were used in step 2 where three rounds of loop sampling were performed, namely, a) of loop F of the α1 subunit, b) of the β5-L5’ loop in the α1 subunit, and c) of the β5-L5’ loop in the γ2 subunit. From each sampling generating 500 models, one was selected as the best (termed models 2a, 2b and 2c, respectively). In step 3, the selected models from steps 1 and 2 were used as templates to generate 400 models of which one was selected as the overall best.
In the refined model, backbone conformations resulting in Ramachandran plot violations were manually adjusted to the proper configuration using the “rotate peptide plane” tool in the molecular modeling program Maestro v. 9.0.56 Finally, the refined model was treated according to the Protein Preparation procedure57 implemented in Maestro which optimizes H-bond networks and flip orientations/tautomeric states of Gln, Asn and His residues, and performs a geometry optimization to a maximum RMSD of 0.3Å.
During the above outlined steps, the residue specific restraints listed in Table I were enforced (in practice, they were imposed as atom specific distance restraints, the details of which are listed in Supporting Information Table S.I.-1). They were primarily derived from experimental data reported in the literature, indicating relative spatial positions and/or roles of certain amino acids that could not be satisfied by solely relying on the structural templates.
Table I.
Summary of the residue specific restraints imposed in model building.
| Restraint | Rationale |
|---|---|
| Pentamer generation (steps 1 and 3) | |
| α1 D54 … α1 R220 a | Salt bridge demonstrated by mutation studies in the GABAA ρ1 receptor.88 |
| α1 R119 … β2 D163 b | Salt bridge demonstrated by mutation studies in the GABAA ρ1 receptor. 18 Also observed in Ls-AChBP. |
| β2 E153 … β2 K196 | Salt bridge demonstrated by mutation and disulfide trapping studies.76 |
| α1 R73 is solvent exposed b | CHE c |
| β2 R86 is solvent exposed | CHE c |
| β2 Y97 lines the binding pocket | Shown by mutation studies to line the pocket.11 Likely makes cation-π interaction with ligands.12 |
| β2 D95 H-bonds to loop B residues | Conserved feature seen in all AChBPs (necessary because of the β2 Y97 restraint) |
| Loop F sampling (step 2) | |
| α1 W170 faces own subunit b,d | CHE.c Also rationalized in a previous study.75 |
| α1 A175, V179 face own subunit. | In accordance with a solvent accessibility study using the substituted cysteine accessibility method.36 |
| α1 S177, A181 are solvent exposed. | |
| α1 V178, V180, D183 line binding site. | |
| β5-L5’ loop sampling (step 2) | |
| γ2 W123, I124, M130 face own subunit | CHE c |
Also set for the corresponding residues in β2 subunits.
Also set for the corresponding residues in the other subunits.
Conservation of hydrophobic environment, i.e. avoid solvent exposed hydrophobic residues or hydrophobic packing of hydrophilic residues.
Also imposed when building the refined model (step 3).
Model evaluation and selection
A consensus approach, combining the Modeller built-in objective (molpdf) and Discrete Optimized Protein Energy (DOPE)58 functions, the ProSA z-score,59 and the energy according to the OPLS 2001 force field as implemented in the Schrödinger software,60,61 was taken in order to increase the chance of selecting the best model(s). Initially, all models were evaluated with the two Modeller functions (molpdf and DOPE). From each run, models that were within top 50 of both scoring functions simultaneously, as well as the highest scoring model of each function separately, were selected for further analysis (collectively referred to as the group of Modeller top ranked models). A z-score for each chain in all top ranked models was then calculated using the ProSA web server.62 The OPLS 2001 force field energy was obtained for each top ranked model after having geometry optimized the structure with the above referred protein preparation protocol.
The models having the best combination of z-score and OPLS energy were selected from each run. It was confirmed by Ramachandran plots and visual inspection that the selected models had a satisfactory geometry.
Molecular Dynamics (MD)
The stability of the refined model in aqueous solvent at room temperature was probed by an MD simulation in the apo state, using the Desmond v. 2.263,64 engine. An extensive equilibration protocol (~10.3 ns in total) preceded the 48 ns unrestrained production run. The equilibration comprised a series of energy minimizations and short simulations with constraints on protein atoms that were gradually lowered. The system setup and MD protocol are described in detail in Supporting Information.
In order to be able to relate the MD trajectory to those of comparable structures determined by X-ray crystallography, simulations were also performed for the Ac-AChBP apo structure 2byn and the EC domain of the ELIC structure 2vl0. The same protocol was followed except the production runs were shorter (30.0 ns for Ac-AChBP, 35.6 ns for ELIC), and for Ac-AChBP the equlibration phase was also shorter (see Supporting Information for details).
Binding site characterization
The program GRID65,66 was used to characterize the non-bonded interaction properties of the orthosteric binding pocket between chains A and B of the refined model using the following probes: DRY (hydrophobic), COO− (aliphatic carboxylate), and N2+ (protonated secondary amine). A grid spacing of 0.5 Å was used, and all other settings were kept at their default values.
The size and shape of the pocket was investigated with the program PASS67 using the “more” and “allprobes” options.
Ligand docking
A series of 52 ligands based on the 4-PIOL and 4-PHP scaffolds (Table II; see Supporting Information Table S.I.-3 for a full list) were docked in their zwitterionic state to the putative binding site in the interface between chains A and B of the model. As a validation, gabazine and bicuculline were also docked to the site.
Table II.
Structures and binding affinities of 4-PIOL and 4-PHP derived ligands docked to the refined GABAAR model.
 |
 |
|||
|---|---|---|---|---|
| Compound | R1 | R2 | Ki (μM)a | Ref. b |
| 1 (4-PIOL) | H | - | 9.1 | 46 |
| 2 | phenyl | - | 0.22 | 47 |
| 3 | benzyl | - | 3.8 | 46 |
| 4 | 3,3-diphenylpropyl | - | 0.068 | 46 |
| 5 | 3-biphenyl | - | 0.010 | 48 |
| 6 | 2-naphthylmethyl | - | 0.049 | 46 |
| 7 | 1-phenyl-2-naphthylmethyl | - | 0.021 | 47 |
| 8 | 1-bromo-2-naphthylmethyl | - | 0.011 | 47 |
| 9 | 5-bromo-2-naphthylmethyl | - | 0.080 | 47 |
| 10 | 7-bromo-2-naphthylmethyl | - | 0.109 | 47 |
| 11 | 8-bromo-2-naphthylmethyl | - | 0.045 | 47 |
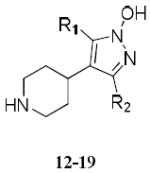
| 12 (4-PHP) | H | H | 10 | 7 |
| 13 | 3-biphenyl | H | 0.0028 | 7 |
| 14 | 2-naphthylmethyl | H | 0.033 | 7 |
| 15 | 1-bromo-2-naphthylmethyl | H | 0.0095 | 7 |
| 16 | H | 3-biphenyl | 0.030 | 7 |
| 17 | H | 4-biphenyl | 0.42 | 7 |
| 18 | H | 2-naphthylmethyl | 0.0030 | 7 |
| 19 | phenyl | 2-naphthylmethyl | 0.022 | 7 |
| Gabazine | - | - | 0.074 | 46 |
| Bicuculline | - | - | 17 | 84 |
Binding affinity from [3H]muscimol displacement studies.
Literature reference for the binding affinity.
Initially, in order to allow the binding pocket to shape itself around a ligand, and to generate different conformational states for α1 R66, the Induced Fit Docking (IFD) protocol68,69 implemented in Maestro was employed to dock the high-affinity disubstituted compound 19 to the site. IFD is a three-step procedure comprising, 1) initial docking, 2) side chain sampling (α1 R66) and protein optimization around initial docking poses, and 3) redocking to the optimized site. Twenty docking poses were requested for 19 in steps 1 and 3; otherwise, standard settings were kept. Docking poses were ranked according to the protocol specific IFDScore, and the resulting top ranked 19–GABAAR complex was geometry optimized using MacroModel v. 9.7.70
Subsequently, using the docking program Glide 5.5,71-73 all ligands were docked flexibly to the AB interface of the IFD optimized model and scored according to Glide’s Standard Precision (SP) function. Twenty poses were generated per ligand, and all other settings were kept at their default values. Poses were ranked internally by their Glide Emodel scores. During all docking steps, the binding pocket was defined as a 103 Å3 box around the center of mass between residues α1 R66, β2 E155 and β2 Y205. Poses of high internal conformational energy (> 5 kcal/mol), as calculated by the procedure of Boström & Liljefors,74 were discarded.
RESULTS
Model building
The pentameric GABAAR α1β2γ2 EC domain model comprised 1059 residue distributed with 213 in α1 and 211 in β2 and γ2 subunits. Overviews of the overall structure and of the orthosteric binding site of the refined model are presented in Figure 4.
Figure 4.
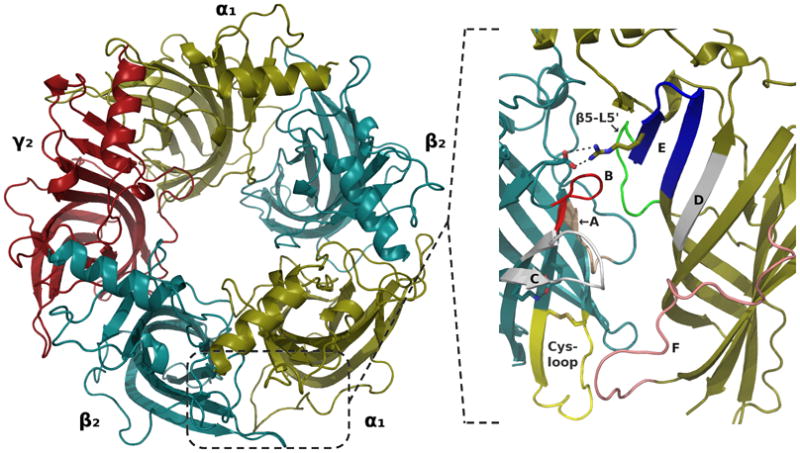
Overviews of the refined GABAAR EC domain model. (Left) The entire pentamer as viewed from above. (Right) Close-up view of the interface between β2 and α1 subunits seen from the side, highlighting the binding site loops as specified in Figure 2 with loops A-C on the β2 side, and loops D-F on the α1 side. The signature Cys-loop of the β2 subunit is highlighted in yellow with the disulfide bridge indicated. The green loop in α1 corresponds to the β5-L5’ segment on which loop sampling was conducted. The two binding site salt bridges discussed in relation to the results of the MD simulation are shown in stick representation and dashed lines: Between α1 R119 (located on loop E) and β2 D163, and between β2 K196 (located on loop C) and β2 E153.
The Ramachandran plot for the refined model (given in Supporting Information Fig. S.I.-3) revealed a backbone geometry of high quality with 99.5% of the residues found in the favorable or additionally allowed regions.
As described in Methods, the model building process was split into three steps: 1) initial model generation yielding models 1a and 1b; 2) loop sampling resulting in models 2a-c; and 3) refined model building (Figure 3). Evaluation in terms of DOPE, ProSA z-scores, and OPLS 2001 energies of the models selected as the best from each run is summarized in Table III to illustrate the stepwise improvements in model quality. (For a complete list of scores for all top ranked models, see Supporting Information Table S.I.-2).
Table III.
DOPE scores, ProSA z-scores, and OPLS 2001 energies of the generated models selected for further use/analysis from each run.
| Model | DOPE | ProSA z-score (by chain and weighted average) | OPLS 2001 energy (kcal/mol) b | |||||
|---|---|---|---|---|---|---|---|---|
| A / β2 | B / α1 | C / β2 | D / α1 | E / γ2 | Avg a | |||
| Initial model generation | ||||||||
| 1a | -112206 | -3.80 | -4.92 | -3.85 | -4.43 | -4.43 | -4.29 | 478 |
| 1b | -112143 | -3.66 | -5.17 | -3.76 | -5.05 | -4.68 | -4.47 | 470 |
| F-loop sampling (α1 subunit) c | ||||||||
| 2a | -1966 | - | -5.41 | - | - | - | - | 185 d |
| β5-L5’ loop sampling (α1 subunit) e | ||||||||
| 2b | -1202 | - | -5.13 | - | - | - | - | 291 f |
| β5-L5’ loop sampling (γ2 subunit) e | ||||||||
| 2c | -2143 | - | - | - | - | -4.79 | - | 282 g |
| Refined model generation | ||||||||
| Refined | -112350 | -4.37 | -5.30 | -4.07 | -5.83 | -4.51 | -4.82 | 401 |
Average z-score per chain weighted by the number of residues in each chain (α1, 213; β2 and γ2, 211).
After being subjected to the Protein Preparation geometry optimization.
Loop sampling was conducted on a dimer so DOPE score and OPLS 2001 energy are incomparable with the other runs.
By comparison, the OPLS 2001 energy of the input dimer was 211 kcal/mol.
Loop sampling was conducted on a trimer so DOPE scores and OPLS 2001 energies are incomparable with the other runs.
By comparison, the OPLS 2001 energy of the input trimer was 307 kcal/mol.
By comparison, the OPLS 2001 energy of the input trimer was 291 kcal/mol.
Significant improvements in z-score and OPLS 2001 energy were obtained for the refined model compared to the initial models 1a and 1b (Table III). The average z-score per subunit was lowered by ca. 0.5, and the force field energy was lowered by ca. 70 kcal/mol. The improvements in z-score for the α1 and β2 subunits were analyzed by comparing the local model quality of the initial and refined models (see Supporting Information Fig. S.I.-4). It is clear that the largest improvement is due to the sampled F-loops. The overall z-scores for the individual subunits in the refined model are also comparable to those found for the AChBPs (-5.05 to -5.54), mouse nAChR α1 subunit (-5.10), and the EC domain of ELIC (-4.96). In general, the z-scores fall well within the range observed for all structures in the PDB with similar numbers of residues.62
Visual inspection confirmed that the residue specific restraints imposed during the initial model generation step had the desired effects (listed in Table I).As expected for the inactive/antagonized receptor state, an open loop C conformation was obtained due to the use of Ac-AChBP in the apo state as template in this region (see Figure 2). This was important for the validity of the model because of its subsequent use in explaining antagonist binding. From the AChBPs it has been observed that loop C, which forms one of the sides of the binding site, can close in on or move away from the pocket, thereby decreasing or increasing the size of the cavity to fit both small and large ligands.50
Likewise, the expected results were obtained from the restraints imposed in the second model generation step (loop samplings). For loop F, α1 W170 (and corresponding residue in the other subunits) packed against the hydrophobic core between the β-sheets rather than being fully exposed to solvent75 as was the case in the initial models. For α1 subunits, the spatial orientations of residues in the upper half of loop F (P174-D183) generally reflected the accessibility data reported by Newell & Czajkowski,36 most notably with V178, V180 and D183 lining the binding site. The lower part (G184-D191) seemed to be less consistent with the data of that study, except that the entire loop F stretch adopts a random coil. However, this part of the loop probably interacts to a greater extent with the TM part and the cell membrane in which the functioning receptor is anchored, thus making the data more difficult to interpret. Moreover there is no indication that this part is involved in ligand binding, although some of the residues are important for expression.36
Sampling of the β5-L5’ loop containing several hydrophobic residues was undertaken in order to prevent it from sticking out into the aqueous central lumen instead of packing against the rest of the subunit, something that was observed in the initial models but not in any of the templates. For the α1 subunit no restraints had to be imposed in order to obtain a good geometry, whereas this was deemed necessary for γ2 (see Table I). In contrast to most of the restraints mentioned above, the ones set here were not derived from experimental data but rather from physical-chemical expectations dictating that the hydrophobic residues W123, I124 and M130 should pack in a hydrophobic environment instead of being solvent exposed.
Model stability in MD
A 48 ns MD simulation of the refined model in the apo state was performed to investigate the overall stability and dynamical properties of the structure, including the residue specific restraints imposed in the modeling process. The energetic and structural stability of the receptor model is summarized in Figure 5.
Figure 5.
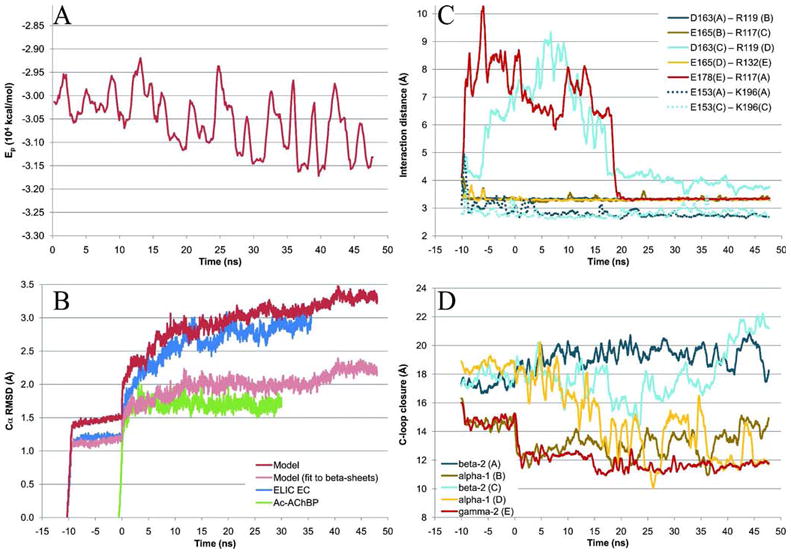
Time series data for the MD simulations. Negative times represent equilibration steps, so that production runs start at 0 ns. (A) Potential energy in vacuo of the model calculated every 126 ps and smoothed over 504 ps intervals to improve readability. (B) All Cα RMSDs, measured with VMD86 after superimposing the protein in each 18 ps snapshot onto the starting structure (9 ps snapshots were used for the equilibration). For the model, data are also shown for β-sheet residues to highlight the stability of the core structure. (C) Stability of binding site salt bridges, measured with VMD as the center of mass distance between the acidic side chain oxygens and the basic side chain nitrogens (see Figure 4 for the location of these salt bridges). Solid lines show the five inter-subunit contacts corresponding to that between α1 R119 and β2 D163, and dashed lines are for the two internal β2 salt bridges between E153 and K196. (D)Loop C openings, measured with VMD as the distance between the tip of loop C (represented as the Cα of residue α1 T206, β2 T202, or γ2 S217) and the center of the β6 strand of the corresponding subunit interface (represented as the Cα of residue α1 T129, β2 G127, or γ2 T142). Data in (C) and (D) were measured for each 18 ps snapshot (9 ps for equilibration steps 1-10) and smoothed over 504 ps intervals.
The potential energy of the protein, as calculated in vacuo with MacroModel and the OPLS 2005 force field, showed a modestly decreasing tendency over the production simulation (Figure 5 A), initially fluctuating around -3.0·104 kcal/mol and ending ca. 1000 kcal/mol lower. This behaviour is expected for a homology model where a large number of bonded and non-bonded interactions will optimize. However, the stable energetic development and moderate decline indicate that the input model had a good geometry. (For clarity, the equilibration phase has been left out of the energy plot. Note that the energies cannot be compared to those listed in Table III.)
The structural deviation of the model from the starting structure over the simulation is represented in Figure 5 B as root mean square deviations (RMSD) for all Cα atoms as well as only for those in the β-sheets (as defined in Figure 2). RMSDs for the ELIC and Ac-AChBP simulations are also given in the figure for comparison. During and immediately after the equilibration series, sharp rises in the RMSD were observed as positional restraints are released. After the first ~10 ns production run the rise leveled off and ends at ca. 3.3 Å. The overall tertiary and quaternary structure of the model was retained, and as evident from the β-sheet RMSD curve the core structure remained stable.
The entire model RMSD was only slightly larger than that of the ELIC crystal structure EC domain which it closely followed, whereas the Ac-AChBP displayed a significantly lower RMSD fluctuating stably around 1.7 Å. The high degree of stability of the water soluble AChBP, even in loop regions, is indicative of a structure in its natural state. By contrast, the larger drift of the two EC domain structures came to a great extent from large movements in the regions designed to engage in inter-domain interactions with the TM region. This was found by analyzing the root mean square fluctuation (RMSF) of the model, the chain average of which is shown in Figure 6 mapped onto an α1 subunit. It confirms the stability of the blue colored β-strand regions with RMSF < ca. 1 Å, while the most mobile parts of the model comprise the red colored terminal and loop regions. (Chain and residue specific RMSF plots can be found in Supporting Information Fig. S.I.-5.) The figure highlights the significance of truncating the structure, primarily by leaving out the TM part that would normally restrain the lower parts of the Cys-loop and loop F, but also at the N-terminal α-helix where several residues were left out of the model due to the lack of a template. The same pattern was observed for the ELIC simulation (not shown), but mostly in the Cys-loop and loop F regions because the structure does not contain the N-terminal α1 and L1 segments (Figure 2). Therefore, we infer that the relatively large overall RMSD of the model is due to missing portions of the structure rather than poor model quality.
Figure 6.

Residue specific Cα RMSF of the MD simulation, averaged over all subunits and mapped onto an α1 subunit (chain B) of the GABAAR EC model. Coloring from blue over white to red corresponds to values from below 0.5 Å to above 2.5 Å. The data were measured with Bio3D87 over the production run relative to the structure at 0 ns (i.e. after equilibration).
Throughout the simulation the orthosteric binding sites retained their overall structure, partly supported by the mostly stable salt bridges that were introduced in the homology modeling (Table I). Figure 5 C (solid lines) shows that three of the five inter-domain ion pairs corresponding to that of α1 R119 and β2 D163 (see Figure 4) were present as bidentate interactions during the entire simulation. Those in chains CD and EA interfaces broke almost immediately but spontaneously reformed again after ca. 17-19 ns and remained intact for the rest of the simulation. The side chain of α1 R119 thus formed a ceiling over the orthosteric pocket in our model (shown in Figure 7), and it appeared the interaction helped stabilize the β2–α1 subunit interface as well as the fold of loop B internally in β2.
Figure 7.

Stereo image (wall-eye) of the orthosteric binding pocket between β2 (teal) and α1 (gold) subunits, highlighting residues of importance in ligand binding. The semi-transparent white surface generated with PASS shows the pocket shape. GRID contours are shown for the hydrophobic DRY probe (green mesh, -1 kcal/mol), the protonated secondary amine N2+ probe (blue mesh, -13 kcal/mol), and the carboxylate COO− probe (red mesh, -9 kcal/mol). β2 D163 is included to highlight the putative salt bridge with α1 R119.
The other binding site salt bridge (β2 E153–K196, see Figure 4)76 specifically built into the model does not directly line the central pocket but is positioned further towards the bottom of the EC domain. E153 is located on the β7 strand after the Cys-loop, and K196 lies on the β9 strand at the start of loop C (Figure 2). In both β2 subunits the interaction was highly stable (Figure 5), and during the entire simulation the residues were actually part of an ionic network also comprising β2 E155 and R207. As described in the next section, β2 E155 is predicted to be a key residue in ligand binding, and it seems this network plays a role in forming and stabilizing the structure in this part of the pocket, as also speculated by Venkatachalan & Czajkowski.76 In addition, this network is unique to and conserved in all GABAAR β subunits, and our simulation suggested that it holds loop C in an open conformation. This is shown in Figure 5 D where the distance between the tip of loop C in each chain and the central residue on the β6 strand (loop E) of the adjacent residue is plotted. The plot can be interpreted structurally by relating to Figure 4 (image to the right): lower values in the plot in Figure 5 D corresponds to loop C moving closer towards the β-sheets of loops E and D, thereby constricting the binding site. As can be seen from the plot, the two β2 subunit C-loops were more open during the simulation than the C-loops in the other three subunits.
The remaining structural features that were specifically incorporated into the model by residue specific restraints (Table I) were also mostly stable throughout the simulation (not shown): the two β2 Y97 residues retained their positions within the binding site while β2 D95 (and corresponding residue in other subunits) stabilized loop B through multiple H-bonds; the β5-L5’ loops remained in close contact with the rest of their respective subunits with conserved hydrophobic environments; and the basic moieties of α1 R73 (and corresponding residue in other subunits) and β2 R86 remained fully solvent exposed and/or engaged in salt bridges with nearby Asp residues. The putative salt bridges between α1 D54 and R220 (and corresponding in β2) were more transient, probably due to their location in the highly mobile lower part of the EC domain. The α1 subunit F-loops were the most unstable segments that were built by means of residue specific restraints, although they displayed dissimilar behavior in chains B and D during the simulation. In chain B, while the loop significantly rearranged, the accessibility pattern of residues P174-D183 remained largely in accordance with data found in the literature.36 Also, here as well as in chains A, C and E, loop F closely lined its own subunit throughout the simulation. This was not the case in chain D where close interactions with the adjacent β2 subunit moved loop F away from the rest of the α1 subunit, thus exposing most of loop F to solvent. As noted above, the lack of a TM domain and cell membrane was likely a major cause of this.
Overall, we found that the refined GABAAR model remained reasonably stable in the MD simulation in terms of both the core and binding site structures, thereby supporting the validity and further use of the model.
Binding modes for 4-PIOL and 4-PHP antagonists
We employed the model to build a hypothesis for a detailed binding mode of a major class of orthosteric GABAAR antagonists based on the structurally similar 4-PIOL and 4-PHP scaffolds (Table II). The SAR data of these compounds imply that in the GABAAR binding pocket, in addition to a central cavity where the zwitterionic core scaffold binds, spaceous cavities must exist on both sides hereof in order to accommodate substituents corresponding to the R1 and R2 positions in the 4-PHP scaffold. Analyzing the size and interaction properties of the binding pocket revealed exactly this pattern (Figure 7). Residues β2 E155 and α1 R66 can favorably interact with a positively charged protonated amine and a negatively charged carboxylic acid probe, respectively, corresponding to the protonated piperidine ring nitrogen and the deprotonated 3-hydroxyisoxazole or 1-hydroxypyrazole moieties (both are carboxylic acid isosteres). We define the “central cavity” as that enclosed by residues α1 R66 and β2 E155, Y157 and Y205. From this area, the pocket extends both upwards and downwards, as evident from the PASS surface shown in Figure 7, and both of these areas favor lipophilic interactions, shown as green contours in the figure. (In the following, the view in Figure 7 is used when referring to these two areas, so that the “upper” region is that enclosed by residues α1 L117, R119, L127, and β2 T160, while the “lower” region is defined by α1 F45, F64, V178, V180, and β2 Y97, L99 and F200.)
In order to determine a more detailed binding mode of the 4-PIOL and 4-PHP derived ligands we performed an automated docking of the ligands listed in Table II (see Supporting Information Table S.I.-3 for a full list). Preliminary dockings of some of the ligands suggested that the smaller compounds could make ionic interactions between the heteroaromatic anion and either of the three arginine residues in the pocket, primarily α1 R66 but also α1 R119 and β2 R207. However, with the protonated piperidine nitrogen consistently placed to interact with β2 E155, only a simultaneous interaction with α1 R66 provided enough space above and below the ligand heteroaromatic ring to be compatible with the high affinity (0.022 μM) of the disubstituted compound 19.
We therefore let this compound guide an induced fit docking in which the rotameric state of α1 R66 was sampled in order to ensure optimal interactions to this residue. The top six poses of 19 were similar to that shown in Figure 8 A, with the protonated piperidine ring nitrogen hydrogen bonding to the β2 E155 carboxylate group and β2 Y157 backbone carbonyl oxygen simultaneously, and the 1-hydroxypyrazole anion forming a bidentate interaction to α1 R66. α1 T129 also donates a H-bond to the anionic moiety. The R1 phenyl substituent fills the area upwards in the pocket while the large R2 naphthylmethyl group is pointing downwards, thereby engaging in hydrophobic interactions. Further, the piperidine ring is confined within the aromatic cage created by α1 F64 and β2 Y97, Y157 and Y205 which helps stabilize the positive charge that is partly distributed over the N-bonded carbons. This is analogous to what is seen for nAChR ligands in various AChBP crystal structures. The orientation is in good agreement with the shape and GRID contours found for the pocket (Figure 7), so we let the receptor optimize around the best pose of 19 and used this structure (Figure 8 A) for docking the entire series of ligands. In the following description of the docking results we will not describe every compound in detail but rather focus on the overall docking pattern exemplified with a few representative compounds.
Figure 8.
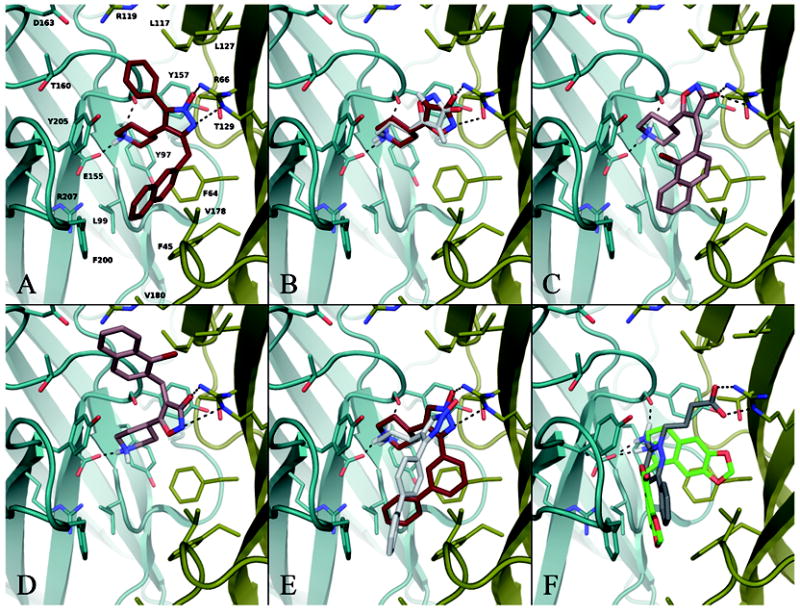
Representative docking pose examples. Key ionic/H-bond interactions with the receptor are shown as dotted lines. For clarity, all receptor and non-polar ligand hydrogens have been left out, and labels are only shown in A. Subunit coloring: β2, teal; α1, gold. (A) Compound 19 in its proposed binding mode after induced fit docking to the binding site model and subsequent geometry optimization defining the pocket to which all the other compounds were docked. (B) Two docking poses of 4-PIOL (1) showing the two primary orientations of the isoxazole ring, represented by the poses ranked no. 1 (ruby carbons) and no. 4 (white carbons), where the former positions the shown R1 hydrogen upwards and obtains more optimal H-bonds and ionic interactions. For clarity, H-bonds are only indicated for pose no. 1. (C) and (D) show the first and second ranked poses of 8, respectively. (E) Top ranked pose of 16 (ruby carbons) compared with the fourth ranked 17 pose (white carbons). For clarity, H-bonds are only indicated for 16. (F) Top ranked poses of gabazine (gray carbons) and bicuculline (green carbons).
The best docking scores (Glide Gscore72) for nearly all compounds fell in the range of ca. -7 to -9, as expected for compounds of relatively high affinity (Gscores are listed in Supporting Information Table S.I.-3). The vast majority of the generated docking poses positioned the core scaffold in the same overall orientation as 19, making ionic interactions with β2 E155 and α1 R66. All except compound 17 obtained this “main” orientation for at least the top six poses. Among the lower ranked poses “alternative” core orientations were seen, usually so that the negatively charged part interacts with R207. For 17 such an alternative core pose was the top ranked solution, while the best pose with the main core orientation was ranked fourth (discussed further below). It is not surprising that the docking results reflect such a highly uniform pattern with β2 E155 and α1 R66 as the key interaction partners, since the pocket was optimized around 19 in this binding mode. However, as noted above α1 R66 was also seen to be the most often suggested interaction partner in a preliminary docking before optimizing the binding site residues around a ligand.
Without substituents on the heteroaromatic ring, satisfaction of all H-bond acceptors and donors was favored like for 19, as evident from the docking of 4-PIOL (1) and 4-PHP (12). For these two compounds, poses with either the piperidine or heteroaromatic ring rotated ~180° to lose one of the H-bonds also lost ~2-5 kcal/mol relative to the highest ranked pose with all H-bonds intact (according to the Glide Emodel score72 which is used to rank docking poses of the same compound). For the 1-hydroxyisoxazole ring of 4-PIOL (1) this rotation is shown in Figure 8 B, and for the piperidine ring an example, represented by compound 8, can be seen in Figure 8 D.
Introducing substituents in the R1 position of the heteroaromatic ring changed this picture somewhat, both due to internal conformational strain in the ligand, and due to the hydrophobic ligand–receptor interactions now contributing to the docking score. This gave rise to two subgroups of main binding modes, namely with the substituent pointing either up or down. Compound 8 is representative of this, and its two top ranked poses of practically identical docking scores are shown in Figure 8 C and D.
Positioning the R1 substituent downwards in the pocket seemed to be favored. Of the compounds substituted only in the R1 position, 90% obtained this as the top ranked pose (similar to 8 in Figure 8 C), while the rest docked with R1 positioned above the core scaffold as the #1 ranked, like that in Figure 8 D. However, for 60% of these compounds a pose with R1 pointing up was found within the top five poses, whereas for the remaining 40% only the downwards pointing R1 solution was found. This latter group comprises compounds characterized by the presence of either one very large group (e.g. 3,3-diphenylpropyl in 4, or 1-phenyl-2-naphthylmethyl in 7) or bulk both close to and further away from the core scaffold (e.g. the 3-biphenyl substituent in 5 and 13). Our model suggests that the cavity above the core 4-PIOL/4-PHP scaffold is smaller than the one below, which explains why a number of compounds were unable to dock with R1 positioned upwards.
The smaller space also limits the amount of flexibility required to fit the substituent into this area. While the phenyl (2) and 2-naphthylmethyl (6) substituted analogs could position R1 upwards with a high scoring docking pose, the 3-biphenyl substituted (5) could not, although from ligand based studies47 the proximal and distal phenyl rings in 5 would seem to correspond to the phenyl ring of 2 and the distal aromatic ring of 6, respectively. This suggests that a 3-biphenyl substituent is either not allowed to be in the upwards position, or that it induces a minor change in the receptor conformation to accommodate the group, something which is not explicitly taken into account with our docking protocol.
Both positions of the R1 substituent is in apparent agreement with SAR data observed for the compounds with a (bromo substituted) naphthylmethyl group in this position (6, 8-11, 14, 15). Compared to compound 3 (R1 = benzyl), the additional distal aromatic ring in the naphthylmethyl moiety of 6 causes a 78-fold increase in affinity (Table II). Introducing bromine in the naphthyl 1-position (8), i.e. on the proximal ring, gives another 5-fold increase in the Ki value, probably due to improved lipophilic interactions. The corresponding introduction of bromine on the distal naphthyl ring in the 5-, 7- or 8-position (9-11) result in the same or even a decreased affinity compared to 6. This correlates with the decrease in electrostatic potential at the center of the distal naphthyl ring due to the electronegative bromine atom, and hence an involvement of this ring in a cation-π or π-π interaction with the receptor has been suggested.47 Our docking results support the observed importance of the distal naphthyl ring, whether positioned in the upper or lower cavity in the binding site. As evident from Figure 8 C, a binding mode with R1 pointing down positions the distal ring in an area surrounded by aromatic and/or lipophilic residues, and in addition β2 R207 points its positively charged guanidinium group towards the ring. With R1 pointing up (Figure 8 D the distal aromatic ring is positioned parallel and close to the guanidium group of α1 R119 to combine in a π-π stacking. Both areas are also predicted by GRID to favorably interact with a hydrophobic group (Figure 7).
While the R1 substituent thus in many cases seems able to fill both cavities, less variation was seen for the 4-PHP compounds substituted in the R2 position, including the disubstituted 19. They consistently docked with R2 pointing downwards and hence with the core scaffold positioned optimally with respect to all four H-bond contacts to the receptor (Figure 8 A). The only exception is 17, as mentioned above, for which such a “main” core orientation was ranked fourth, while poses #1-3 had alternative orientations with the 1-hydroxypyrazole ring interacting with β2 R207. This is due to a lack of space in the direction of substitution in 17 where R2 is a straight 4-biphenyl group, while in the otherwise similar 16 an angled shape is created by the 3-biphenyl R2 substiuent that fits better in the pocket. As shown in Figure 8 E, 17 in the fourth ranked pose is rotated away from an optimal interaction with α1 R66 in order to avoid the steric clash with α1 F45 that would arise with the binding mode of 16 (i.e. moving the distal phenyl group in the shown 16 pose from the 3-position to the 4-position). This is in good agreement with the loss of affinity by a factor of 10 for 17 compared to 16 (see Table II).
Taken together, the binding pocket analysis (Figure 7) and docking results (Figure 8 A-E) allowed clear identification of a common binding mode for the core piperidine-heteroaromat scaffold for the 4-PIOL and 4-PHP compound series, with β2 E155 and α1 R66 acting as the main anchor points for the charged moieties in the ligands. The docking results consistently favored a downwards orientation of the R2 substituent, whereas the picture was less clear for R1 which seemed able to fill either of the spaceous and hydrophobic areas found above and below the core scaffold position.
As a validation, the hallmark orthosteric GABAAR antagonists gabazine and bicuculline were also docked to the binding site. The resulting Glide scores were comparable to those of the 4-PIOL and 4-PHP series, as were the docking poses: The top 5-6 poses were essentially identical, with the protonated nitrogen making a salt bridge with β2 E155. For gabazine a simultaneous H-bond to β2 Y157 backbone carbonyl was seen, and the carboxylate group formed a bidentate ionic interaction with α1 R119 (see Figure 8 F). The ring systems in both ligands filled the lower part of the pocket, an orientation which for gabazine seems to be in good agreement with SCAM data showing that it blocks modification of residues further down in the pocket than observed for GABA.14
DISCUSSION
Model quality improvements
In the present study we have described the homology modeling of the α1β2γ2 GABAAR EC domain with the primary purpose of creating a basis for understanding ligand binding to the orthosteric site. Emphasis has been put on obtaining a model that reflects experimentally determined properties of the receptor, in particular structural and functional roles of specific residues. To achieve this we took several approaches, including a thorough multiple sequence alignment, careful selection of different templates for modeling different regions of the receptor, the inclusion of residue specific spatial restraints, and an iterative model building protocol during which model selection was based on consensus among fundamentally different scoring functions. The model was further evaluated by its stability during MD and, most importantly for our purpose, its applicability in developing a hypothesis for a detailed binding mode of a major class of antagonists based on the 4-PIOL/4-PHP scaffold.
To our knowledge, this is the first report of a GABAAR EC domain modeling approach where experimental data have been incorporated directly in building and evaluating the model to the extent described here. It is satisfactory to note that the refined model fulfilled the imposed restraints, thus reflecting the underlying biochemical data, and that the model quality significantly improved over the course of the modeling procedure, as assessed by the various scoring functions. In addition, the model had a stability in MD comparable to that of the ELIC EC domain structure, which is more valid for comparison than the AChBP as it reflects a truncated structure, like the GABAAR model.
Details of orthosteric ligand binding and possible activation mechanisms revealed by the model
With extensive SAR data available in the literature, the 4-PIOL and 4-PHP derived antagonists are ideal for establishing a binding mode that can be generalized to other orthosteric ligands, including agonists. Supported by the binding pocket analysis (Figure 7), docking of these ligands pointed to a core scaffold position anchored between β2 E155 and α1 R66, something which is in good agreement with the following experimental findings and observed properties.
The β2 E155C mutation produces spontaneously open GABAAR ion channels and significantly lowers affinity for GABA, gabazine and the partial agonist piperidine-4-sulfonic acid (P4S).22 A salt bridge with E155 locates the positive charge of the ligand in the aromatic cage characteristic of the Cys-loop receptor family. In our model it comprises residues α1 F64 and β2 Y97, Y157 and Y205, all of which have been implicated in receptor function and/or ligand binding.11-15,77 This is analogous to the nAChRs where all agonists and antagonists uniformly position their positively charged nitrogen atom within this box, as evident from the AChBP crystal structures. Also, the closely positioned β2 R207 has been demonstrated to be directly involved in GABA binding and unbinding.19 Based on our MD results, and in agreement with others,76 this residue is likely part of an ionic network with β2 K196, E153 and E155 that holds the latter in place to engage in ligand binding.
α1 R66 is located in a region (with F64 and S68) that interacts with both GABA and gabazine, and the R66C mutation dramatically decreases GABAAR function.14,15,17,20 In addition, α1 R66 is only conserved among the GABAA and glycine receptors whose endogenic agonists contain a carboxylic acid, in contrast to the nAChRs and 5-HT3 receptors. Other conserved arginines (α1 R119 and β2 R207) have also been demonstrated to line the binding site, be of functional importance, and possibly interact directly with GABA.16,18-21 Our results speak in favor of α1 R66 as the main anchor, primarily because the resulting orientation was the only one compatible with the disubstituted 4-PHP analog 19 being able to bind to the orthosteric site with high affinity. A recent study also supports an interaction with α1 R66 by showing that an analog of 4-PIOL, in which the 3-hydroxyisoxazole group was replaced with the thiol reactive 1,3,4-oxadiazole-2-thione moiety, selectively reacted with the cysteine in a α1 R66C mutant.17 However, besides positioning the anionic moiety of the ligand in proximity to α1 R66, the binding mode suggested in that study is not in agreement with our hypothesis.
The above summarized data seem to support a coupling between the binding modes of 4-PIOL type antagonists and the archetypical agonists GABA and muscimol. Such a coupling has also previously been hypothesized in a common 3D-pharmacophore model46,47 which is in excellent agreement with our receptor model. According to the pharmacophore model, the protonated nitrogen found in all ligands superimposes, whereas the deprotonated moiety can adopt two positions shifted relative to one another. This was proposed because chemical substitution is allowed in the 4-position of the isoxazole ring in 4-PIOL but not in muscimol.45 An interaction with a flexible arginine was suggested to account for this, so that two conformations of the guanidinium moiety would correspond to distinct isoxazole ring positions, one of which is blocked from substitution. We envision this concept in the context of our receptor model as illustrated in Figure 9. Here, a low energy conformer of muscimol is aligned to the highest ranked docking pose of 4-PIOL in accordance with the pharmacophore model. α1 R66 can optimize its interaction with the ligand by flipping the guanidium group to adopt either of two low-energy conformers (both are seen for arginine in crystal structures, and the one corresponding to the 4-PIOL scaffold was identified by the induced fit docking protocol as described in Methods). The isoxazole ring of muscimol is thus displaced towards the β2 subunit so that it is buried under loop B, shown in the figure as a distance of 2.8Å between the Cα of β2 G158 and the hydrogen in the isoxazole 4-position. Substitution in this position would create a steric clash with the receptor, thereby offering an explaination for the >1.7·104 fold increase in IC50 reported for 4-methylmuscimol compared to muscimol.78
Figure 9.

Incorporation of the arginine flip forming the basis of the previously described pharmacophore model46,47 into our receptor model. Subunit coloring: β2, teal; α1 gold. Muscimol (gray carbons) is shown in the proposed binding mode where the protonated nitrogen overlaps with that of 4-PIOL in the highest ranked docking pose (brown carbons). α1 R66 can orient its guanidinium group in either of two low-energy conformations (gray corresponds to muscimol) to optimize the salt bridge with the non-overlapping 3-hydroxyisoxazole moieties of the ligands. The resulting proximity of muscimol to β2 G158 on loop B is indicated by a dashed line.
Our hypothesis of a general binding mode for GABAAR ligands leads us to speculate how it can be interpreted in terms of the binding site contribution to the activation mechanism. In general, Cys-loop receptor activation is believed to be initiated by an agonist induced structural change in the binding site, thus starting a “conformational wave” that propagates through the receptor and eventually leads to channel opening.79 Firstly, several lines of evidence support the involvement of loop C closure in the beginning of this cascade, both from AChBP structures43,50 and from biochemical and pharmacological studies.16,80 Secondly, rotation of the EC domain β-sheet core is thought to take place as well upon agonist binding. 29,81,82 Both motions seem to fit well with the suggested binding mode for GABAAR agonists and antagonists, and with respect to the loop C closure an observation made from the MD simulation of the model is also in good accordance with the hypothesis.
As described in Results, the two orthosteric site C-loops remained open over the 48 ns MD simulation, possibly as a result of the stable ionic network comprising β2 E153, E155, K196 and R207 which indicates that this system has to be perturbed to promote closure. This can come about either by the above mentioned E155C mutation that gave rise to a spontaneously open channel,22 or by an interaction between E155 and a positive charge from a ligand. The bulkiness of the ligand can be seen as a determinant of how much loop C can subsequently close in on the binding site. The straight and relatively flat structures of GABA and muscimol allow full closure when positioned parallel to the loop, whereas the larger piperidine ring of the partial agonists 4-PIOL and P4S leads to decreased efficacy by blocking residues on loop C. Further increasing the bulk by substituting aromatic groups in the 4-PIOL or 4-PHP heteroaromatic rings leads to full antagonism.
With respect to the β-sheet core rotation or twist contributing to the activation cascade, this may be visualized by thinking of a ligand in the proposed binding mode as a bridge or linker between two adjacent subunits. The shorter distance between the positively and negatively charged ends in full agonists compared to partial agonists or antagonists (e.g. GABA vs. gabazine, and muscimol vs. 4-PIOL) may induce a larger displacement or rotation of the two subunits relative to each other.
The above outlined speculations seem to be in good accordance with a recent study by Hibbs et al.,83 in which crystal structures of the Ac-AChBP were obtained in complex with a number of full or partial nAChR agonists based on the anabaseine scaffold. As the AChBP is generally regarded as a structural and functional surrogate of the nAChRs, a prominent member of the Cys-loop receptor family, observations made for this protein are likely relevant to the GABAARs as well. The authors found several features of the ligand binding properties that seemed to determine their efficacy profile. One of those is the amount of bulk extending from the protonated nitrogen towards the complementary side of the AChBP binding site, corresponding to the α1 subunit of GABAARs. This prevents loop C of the AChBP from wrapping tightly around the ligand, thereby lowering its efficacy. Further, Hibbs et al. noted that the ability to adopt two distinct conformations (“agonist-like” and “antagonist-like”) within the AChBP binding site was also characteristic for the partial agonists. A similar situation may apply to the GABAAR. In our docking study, the 4-PIOL core scaffold was found to adopt two distinct orientations for several of the ligands, and we were not able to effectively discriminate one as being more likely than the other. Whether they correspond to agonist-like and antagonist-like orientations, respectively, is impossible to elucidate at present; however, the study by Hibbs et al. does indicate the possibility of the same ligand adopting two equally possible conformations.
We stress that the speculations outlined above cannot be verified from a static picture of the GABAAR, such as our model of the receptor and ligand binding modes. Several other factors likely contribute to the often subtle differences observed for GABAAR ligands. Also, we should note that since our model reflects the inactive state of the receptor it is not suitable for investigating details of agonist binding further than the qualitative description above of muscimol and the pharmacophore model in combination with our model.
Two hydrophobic cavities are responsible for the high-affinity of substituted 4-PIOL and 4-PHP antagonists
Two relatively large areas above and below the proposed position of the 4-PIOL and 4-PHP core scaffolds were identified by the orthosteric binding site characterization. Their size and hydrophobic nature make both good candidates for accomodating the often large and aromatic substituents that in some cases give rise to very strong binding affinity (Ki as low as 2.8 nM; see Table II).
Our docking results were highly consistent in favoring a downwards orientation of the 4-PHP R2 position, whereas for the R1 substituent a less clear picture was seen. In general, either of two (or three) possible binding scenarios can be hypothesized based on our results: 1) The orientation of the core scaffold heteroaromatic ring is strictly conserved so that an R1 substituent always fills the area above the ligand core scaffold while, for 4-PHP, the R2 position points down; or 2) a substituent in either position is favored to be positioned in the cavity below the core scaffold, so that bulk in the R1 position causes a flip of the heteroaromatic ring. The first possibility seems to best agree with the non-parallel structure-activity data for identical R1 and R2 substituents in the 4-PHP series (compare e.g. the affinities for 13 and 14 with 16 and 18), as discussed further by Møller et al.7 The second is most consistent with our docking results, at least when considering the fact that the highest ranked poses for the vast majority of ligands positioned the substituent downwards, whether in the R1 or R2 position. A third possibility is that both orientations can be true depending on the R1 substituent, i.e. some will be pointing up while others favor a downwards orientation. This is supported by the observation that the areas above and below the core scaffold in the predicted binding orientation are in fact highly similar in terms of size and ability to favorably interact with a hydrophobic group, although the lower area is larger in our model. Also, the possibility of two equally likely conformations seems to be supported by the study of Hibbs et al.83 as discussed above. Although the ligand structures in this study and that of Hibbs et al. are dissimilar, the AChBP and GABAAR binding sites share several features, one of which may well be the ability to allow different binding modes of the same ligand.
CONCLUSIONS
In the present study we have demonstrated that modeling the GABAAR EC domain by using an iterative protocol, incorporating residue specific experimental data, and selecting the best model based on consensus scoring led to improved model quality. Our results highlight the importance of critical evaluation and optimization in each step of the modeling process, starting with the sequence alignment and template selection. The approach taken here with restraints reflecting observed roles of certain amino acids can be further expanded as more information from biochemical or pharmacological studies becomes available, thereby increasing the validity of the model.
An MD simulation of the model showed a stability comparable to that of the ELIC crystal structure, and revealed a network of ionic contacts in the β2 subunit of potential importance in maintaining the structure of the orthosteric binding site. In conjunction with the 4-PIOL and 4-PHP series of antagonists, the model was used to establish a detailed hypothesis for ligand binding to the orthosteric site. The receptor and ligand binding models were able to explain key pharmacological and ligand SAR data, most notably the predicted roles of residues α1 R66 and β2 E155 as the main anchors for ionic interactions. Further, key features of a previously developed pharmacophore model were in good agreement with our hypothesis when incorporated into the receptor model.
While the core ligand binding mode was established by highly consistent docking results, the orientation of substituents on the 4-PIOL or 4-PHP heteroaromatic rings was less clear, thus prompting the need for further investigations. Specifically, mutation studies in the hydrophobic cavities suggested to accommodate the substituents, coupled with measuring the effects on ligand binding, will likely clarify how the antagonists are oriented in the binding site. As demonstrated by Jansen et al.,17 the use of a thiol reactive ligand could prove especially useful in this regard.
A copy of the refined GABAAR model in PDB format can be obtained by sending an email request to TB.
Supplementary Material
Acknowledgments
The Carlsberg Foundation and the Lundbeck Foundation are gratefully acknowledged for financial support. Work at UCSD is supported in part by NSF, NIH, HHMI, CTBP, NBCR, and the NSF Supercomputer Centers.
Footnotes
The work was carried out at: Department of Medicinal Chemistry, Faculty of Pharmaceutical Sciences, University of Copenhagen, Universitetsparken 2, DK-2100 Copenhagen, Denmark.
REFERENCE LIST
- 1.Johnston GAR. GABAA receptor channel pharmacology. Curr Pharm Des. 2005;11:1867–1885. doi: 10.2174/1381612054021024. [DOI] [PubMed] [Google Scholar]
- 2.Krogsgaard-Larsen P, Frølund B, Kristiansen U, Frydenvang K, Ebert B. GABAA and GABAB receptor agonists, partial agonists, antagonists and modulators: Design and therapeutic prospects. Eur J Pharm Sci. 1997;5:355–384. [Google Scholar]
- 3.Johnston GAR, Curtis DR, De Groat WC, Duggan AW. Central actions of ibotenic acid and muscimol. Biochem Pharmacol. 1968;17:2488–2489. doi: 10.1016/0006-2952(68)90141-x. [DOI] [PubMed] [Google Scholar]
- 4.Curtis DR, Duggan AW, Felix D, Johnston GAR. Bicuculline, an antagonist of GABA and synaptic inhibition in the spinal cord of the cat. Brain Res. 1971;32:69–96. doi: 10.1016/0006-8993(71)90156-9. [DOI] [PubMed] [Google Scholar]
- 5.Byberg JR, Labouta IM, Falch E, Hjeds H, Krogsgaard-Larsen P, Curtis DR, Gynther BD. Synthesis and biological activity of a GABAA agonist which has no effect on benzodiazepine binding and of structurally related glycine antagonists. Drug Des Deliv. 1987;1:261–274. [PubMed] [Google Scholar]
- 6.Kristiansen U, Lambert JD, Falch E, Krogsgaard-Larsen P. Electrophysiological studies of the GABAA receptor ligand, 4-PIOL, on cultured hippocampal neurones. Br J Pharmacol. 1991;104:85–90. doi: 10.1111/j.1476-5381.1991.tb12389.x. [DOI] [PMC free article] [PubMed] [Google Scholar]
- 7.Møller HA, Sander T, Kristensen JL, Nielsen B, Krall J, Bergmann ML, Christiansen B, Balle T, Jensen AA, Frølund B. Novel 4-(piperidin-4-yl)-1-hydroxypyrazoles as γ-aminobutyric acidA receptor ligands: Synthesis, pharmacology, and structure-activity relationships. J Med Chem. 2010;53:3417–3421. doi: 10.1021/jm100106r. [DOI] [PubMed] [Google Scholar]
- 8.Gynther BD, Curtis DR. Pyridazinyl-GABA derivatives as GABA and glycine antagonists in the spinal cord of the cat. Neurosci Lett. 1986;68:211–215. doi: 10.1016/0304-3940(86)90144-8. [DOI] [PubMed] [Google Scholar]
- 9.Sieghart W. Structure, pharmacology, and function of GABAA receptor subtypes. Adv Pharmacol. 2006;54:231–263. doi: 10.1016/s1054-3589(06)54010-4. [DOI] [PubMed] [Google Scholar]
- 10.Sarto-Jackson I, Sieghart W. Assembly of GABAA receptors (Review) Mol Membr Biol. 2008;25:302–310. doi: 10.1080/09687680801914516. [DOI] [PubMed] [Google Scholar]
- 11.Boileau AJ, Newell JG, Czajkowski C. GABAA receptor β2 Tyr97 and Leu99 line the GABA-binding site Insights into mechanisms of agonist and antagonist actions. J Biol Chem. 2002;277:2931–2937. doi: 10.1074/jbc.M109334200. [DOI] [PubMed] [Google Scholar]
- 12.Padgett CL, Hanek AP, Lester HA, Dougherty DA, Lummis SC. Unnatural amino acid mutagenesis of the GABAA receptor binding site residues reveals a novel cation-π interaction between GABA and β2Tyr97. J Neurosci. 2007;27:886–892. doi: 10.1523/JNEUROSCI.4791-06.2007. [DOI] [PMC free article] [PubMed] [Google Scholar]
- 13.Amin J, Weiss DS. GABAA receptor needs two homologous domains of the β-subunit for activation by GABA but not by pentobarbital. Nature. 1993;366:565–569. doi: 10.1038/366565a0. [DOI] [PubMed] [Google Scholar]
- 14.Holden JH, Czajkowski C. Different residues in the GABAA receptor α1T60-α1K70 region mediate GABA and SR-95531 actions. J Biol Chem. 2002;277:18785–18792. doi: 10.1074/jbc.M111778200. [DOI] [PubMed] [Google Scholar]
- 15.Boileau AJ, Evers AR, Davis AF, Czajkowski C. Mapping the agonist binding site of the GABAA receptor: Evidence for a β-strand. J Neurosci. 1999;19:4847–4854. doi: 10.1523/JNEUROSCI.19-12-04847.1999. [DOI] [PMC free article] [PubMed] [Google Scholar]
- 16.Wagner DA, Czajkowski C. Structure and dynamics of the GABA binding pocket: A narrowing cleft that constricts during activation. J Neurosci. 2001;21:67–74. doi: 10.1523/JNEUROSCI.21-01-00067.2001. [DOI] [PMC free article] [PubMed] [Google Scholar]
- 17.Jansen M, Rabe H, Strehless A, Dieler S, Debus F, Dannhardt G, Akabas MH, Luddens H. Synthesis of GABAA receptor agonists and evaluation of their α-subunit selectivity and orientation in the GABA binding site. J Med Chem. 2008;51:4430–4448. doi: 10.1021/jm701562x. [DOI] [PMC free article] [PubMed] [Google Scholar]
- 18.Adamian L, Gussin HA, Tseng YY, Muni NJ, Feng F, Qian H, Pepperberg DR, Liang J. Structural model of ρ1 GABAC receptor based on evolutionary analysis: Testing of predicted protein-protein interactions involved in receptor assembly and function. Protein Sci. 2009;18:2371–2383. doi: 10.1002/pro.247. [DOI] [PMC free article] [PubMed] [Google Scholar]
- 19.Wagner DA, Czajkowski C, Jones MV. An arginine involved in GABA binding and unbinding but not gating of the GABAA receptor. J Neurosci. 2004;24:2733–2741. doi: 10.1523/JNEUROSCI.4316-03.2004. [DOI] [PMC free article] [PubMed] [Google Scholar]
- 20.Hartvig L, Lukensmejer B, Liljefors T, Dekermendjian K. Two conserved arginines in the extracellular N-terminal domain of the GABAA receptor α5 subunit are crucial for receptor function. J Neurochem. 2000;75:1746–1753. doi: 10.1046/j.1471-4159.2000.0751746.x. [DOI] [PubMed] [Google Scholar]
- 21.Kloda JH, Czajkowski C. Agonist-, antagonist-, and benzodiazepine-induced structural changes in the α1 Met113-Leu132 region of the GABAA receptor. Mol Pharmacol. 2007;71:483–493. doi: 10.1124/mol.106.028662. [DOI] [PubMed] [Google Scholar]
- 22.Newell JG, McDevitt RA, Czajkowski C. Mutation of glutamate 155 of the GABAA receptor β2 subunit produces a spontaneously open channel: A trigger for channel activation. J Neurosci. 2004;24:11226–11235. doi: 10.1523/JNEUROSCI.3746-04.2004. [DOI] [PMC free article] [PubMed] [Google Scholar]
- 23.Smit AB, Syed NI, Schaap D, van Minnen J, Klumperman J, Kits KS, Lodder H, van der Schors RC, van Elk R, Sorgedrager B, Brejc K, Sixma TK, Geraerts WP. A glia-derived acetylcholine-binding protein that modulates synaptic transmission. Nature. 2001;411:261–268. doi: 10.1038/35077000. [DOI] [PubMed] [Google Scholar]
- 24.Brejc K, van Dijk WJ, Klaassen RV, Schuurmans M, van der Oost J, Smit AB, Sixma TK. Crystal structure of an ACh-binding protein reveals the ligand-binding domain of nicotinic receptors. Nature. 2001;411:269–276. doi: 10.1038/35077011. [DOI] [PubMed] [Google Scholar]
- 25.Hansen SB, Talley TT, Radic Z, Taylor P. Structural and ligand recognition characteristics of an acetylcholine-binding protein from Aplysia californica. J Biol Chem. 2004;279:24197–24202. doi: 10.1074/jbc.M402452200. [DOI] [PMC free article] [PubMed] [Google Scholar]
- 26.Celie PH, Kasheverov IE, Mordvintsev DY, Hogg RC, van Nierop P, van Elk R, van Rossum-Fikkert SE, Zhmak MN, Bertrand D, Tsetlin V, Sixma TK, Smit AB. Crystal structure of nicotinic acetylcholine receptor homolog AChBP in complex with an α-conotoxin PnIA variant. Nat Struct Mol Biol. 2005;12:582–588. doi: 10.1038/nsmb951. [DOI] [PubMed] [Google Scholar]
- 27.Celie PH, Klaassen RV, van Rossum-Fikkert SE, van Elk R, van Nierop P, Smit AB, Sixma TK. Crystal structure of acetylcholine-binding protein from Bulinus truncatus reveals the conserved structural scaffold and sites of variation in nicotinic acetylcholine receptors. J Biol Chem. 2005;280:26457–26466. doi: 10.1074/jbc.M414476200. [DOI] [PubMed] [Google Scholar]
- 28.Dellisanti CD, Yao Y, Stroud JC, Wang ZZ, Chen L. Crystal structure of the extracellular domain of nAChR α1 bound to α-bungarotoxin at 1.94 Å resolution. Nat Neurosci. 2007;10:953–962. doi: 10.1038/nn1942. [DOI] [PubMed] [Google Scholar]
- 29.Unwin N. Refined structure of the nicotinic acetylcholine receptor at 4 Å resolution. J Mol Biol. 2005;346:967–989. doi: 10.1016/j.jmb.2004.12.031. [DOI] [PubMed] [Google Scholar]
- 30.Hilf RJC, Dutzler R. X-ray structure of a prokaryotic pentameric ligand-gated ion channel. Nature. 2008;452:375–379. doi: 10.1038/nature06717. [DOI] [PubMed] [Google Scholar]
- 31.Bocquet N, Nury H, Baaden M, Le Poupon C, Changeux JP, Delarue M, Corringer PJ. X-ray structure of a pentameric ligand-gated ion channel in an apparently open conformation. Nature. 2009;457:111–114. doi: 10.1038/nature07462. [DOI] [PubMed] [Google Scholar]
- 32.Hilf RJC, Dutzler R. Structure of a potentially open state of a proton-activated pentameric ligand-gated ion channel. Nature. 2009;457:115–118. doi: 10.1038/nature07461. [DOI] [PubMed] [Google Scholar]
- 33.Bondarenko V, Tillman T, Xu Y, Tang P. NMR structure of the transmembrane domain of the n-acetylcholine receptor β2 subunit. Biochim Biophys Acta Biomembr. 2010;1798:1608–1614. doi: 10.1016/j.bbamem.2010.04.014. [DOI] [PMC free article] [PubMed] [Google Scholar]
- 34.Trudell J. Unique assignment of inter-subunit association in GABAA α1β3γ2 receptors determined by molecular modeling. Biochim Biophys Acta. 2002;1565:91–96. doi: 10.1016/s0005-2736(02)00512-6. [DOI] [PubMed] [Google Scholar]
- 35.Cromer BA, Morton CJ, Parker MW. Anxiety over GABAA receptor structure relieved by AChBP. Trends Biochem Sci. 2002;27:280–287. doi: 10.1016/s0968-0004(02)02092-3. [DOI] [PubMed] [Google Scholar]
- 36.Newell JG, Czajkowski C. The GABAA Receptor α1 Subunit Pro174-Asp191 Segment Is Involved in GABA Binding and Channel Gating. J Biol Chem. 2003;278:13166–13172. doi: 10.1074/jbc.M211905200. [DOI] [PubMed] [Google Scholar]
- 37.Ernst M, Bruckner S, Boresch S, Sieghart W. Comparative models of GABAA receptor extracellular and transmembrane domains: Important insights in pharmacology and function. Mol Pharmacol. 2005;68:1291–1300. doi: 10.1124/mol.105.015982. [DOI] [PubMed] [Google Scholar]
- 38.Mercado J, Czajkowski C. Charged residues in the α1 and β2 pre-M1 regions involved in GABAA receptor activation. J Neurosci. 2006;26:2031–2040. doi: 10.1523/JNEUROSCI.4555-05.2006. [DOI] [PMC free article] [PubMed] [Google Scholar]
- 39.Campagna-Slater V, Weaver DF. Molecular modelling of the GABAA ion channel protein. J Mol Graph Model. 2007;25:721–730. doi: 10.1016/j.jmgm.2006.06.001. [DOI] [PubMed] [Google Scholar]
- 40.Ci SQ, Ren TR, Ma CX, Su ZG. Modeling of αk/γ2 (k=1, 2, 3 and 5) interface of GABAA receptor and docking studies with zolpidem: Implications for selectivity. J Mol Graph Model. 2007;26:537–545. doi: 10.1016/j.jmgm.2007.03.007. [DOI] [PubMed] [Google Scholar]
- 41.Ci SQ, Ren TR, Su ZG. Investigating the putative binding-mode of GABA and diazepam within GABAA receptor using molecular modeling. Protein J. 2008;27:71–78. doi: 10.1007/s10930-007-9109-9. [DOI] [PubMed] [Google Scholar]
- 42.Law RJ, Lightstone FC. Modeling neuronal nicotinic and GABA receptors: Important interface salt-links and protein dynamics. Biophys J. 2009;97:1586–1594. doi: 10.1016/j.bpj.2009.06.044. [DOI] [PMC free article] [PubMed] [Google Scholar]
- 43.Celie PH, van Rossum-Fikkert SE, van Dijk WJ, Brejc K, Smit AB, Sixma TK. Nicotine and carbamylcholine binding to nicotinic acetylcholine receptors as studied in AChBP crystal structures. Neuron. 2004;41:907–914. doi: 10.1016/s0896-6273(04)00115-1. [DOI] [PubMed] [Google Scholar]
- 44.Mokrab Y, Bavro VN, Mizuguchi K, Todorov NP, Martin IL, Dunn SM, Chan SL, Chau PL. Exploring ligand recognition and ion flow in comparative models of the human GABA type A receptor. J Mol Graph Model. 2007;26:760–774. doi: 10.1016/j.jmgm.2007.04.012. [DOI] [PubMed] [Google Scholar]
- 45.Frølund B, Tagmose L, Liljefors T, Stensbøl TB, Engblom C, Kristiansen U, Krogsgaard-Larsen P. A novel class of potent 3-isoxazolol GABAA antagonists: Design, synthesis, and pharmacology. J Med Chem. 2000;43:4930–4933. doi: 10.1021/jm000371q. [DOI] [PubMed] [Google Scholar]
- 46.Frølund B, Jørgensen AT, Tagmose L, Stensbøl TB, Vestergaard HT, Engblom C, Kristiansen U, Sanchez C, Krogsgaard-Larsen P, Liljefors T. Novel class of potent 4-arylalkyl substituted 3-isoxazolol GABAA antagonists: Synthesis, pharmacology, and molecular modeling. J Med Chem. 2002;45:2454–2468. doi: 10.1021/jm020027o. [DOI] [PubMed] [Google Scholar]
- 47.Frølund B, Jensen LS, Guandalini L, Canillo C, Vestergaard HT, Kristiansen U, Nielsen B, Stensbøl TB, Madsen C, Krogsgaard-Larsen P, Liljefors T. Potent 4-aryl- or 4-arylalkyl-substituted 3-isoxazolol GABAA antagonists: Synthesis, pharmacology, and molecular modeling. J Med Chem. 2005;48:427–439. doi: 10.1021/jm049256w. [DOI] [PubMed] [Google Scholar]
- 48.Frølund B, Jensen LS, Storustovu SI, Stensbøl TB, Ebert B, Kehler J, Krogsgaard-Larsen P, Liljefors T. 4-aryl-5-(4-piperidyl)-3-isoxazolol GABAA antagonists: Synthesis, pharmacology, and structure-activity relationships. J Med Chem. 2007;50:1988–1992. doi: 10.1021/jm070038n. [DOI] [PubMed] [Google Scholar]
- 49.Berman HM, Westbrook J, Feng Z, Gilliland G, Bhat TN, Weissig H, Shindyalov IN, Bourne PE. The Protein Data Bank. Nucleic Acids Res. 2000;28:235–242. doi: 10.1093/nar/28.1.235. [DOI] [PMC free article] [PubMed] [Google Scholar]
- 50.Hansen SB, Sulzenbacher G, Huxford T, Marchot P, Taylor P, Bourne Y. Structures of Aplysia AChBP complexes with nicotinic agonists and antagonists reveal distinctive binding interfaces and conformations. EMBO J. 2005;24:3635–3646. doi: 10.1038/sj.emboj.7600828. [DOI] [PMC free article] [PubMed] [Google Scholar]
- 51.Bocquet N, Nury H, Baaden M, Le Poupon C, Changeux JP, Delarue M, Corringer PJ. X-ray structure of a pentameric ligand-gated ion channel in an apparently open conformation. Nature. 2008 doi: 10.1038/nature07462. [DOI] [PubMed] [Google Scholar]
- 52.The Uniprot Consortium. The universal protein resource (UniProt) Nucleic Acids Res. 2008;36:D190–D195. doi: 10.1093/nar/gkm895. [DOI] [PMC free article] [PubMed] [Google Scholar]
- 53.The PyMOL molecular graphics system, version 1.2r2. Palo Alto, CA: DeLano Scientific; 2009. [Google Scholar]
- 54.Larkin MA, Blackshields G, Brown NP, Chenna R, McGettigan PA, McWilliam H, Valentin F, Wallace IM, Wilm A, Lopez R, Thompson JD, Gibson TJ, Higgins DG. Clustal W and Clustal X version 2.0. Bioinformatics. 2007;23:2947–2948. doi: 10.1093/bioinformatics/btm404. [DOI] [PubMed] [Google Scholar]
- 55.Sali A, Blundell TL. Comparative protein modelling by satisfaction of spatial restraints. J Mol Biol. 1993;234:779–815. doi: 10.1006/jmbi.1993.1626. [DOI] [PubMed] [Google Scholar]
- 56.Maestro, version 9.0. New York, NY: Schrödinger, LLC; 2009. [Google Scholar]
- 57.Schrödinger Suite 2009 Protein Preparation Wizard. Epik, version 2.0. New York, NY: Schrödinger, LLC; 2009. Impact, version 5.5. New York, NY: Schrödinger, LLC; 2009. Prime, version 2.1. New York, NY: Schrödinger, LLC; 2009. New York, NY: Schrödinger, LLC; 2009. [Google Scholar]
- 58.Shen MY, Sali A. Statistical potential for assessment and prediction of protein structures. Protein Sci. 2006;15:2507–2524. doi: 10.1110/ps.062416606. [DOI] [PMC free article] [PubMed] [Google Scholar]
- 59.Sippl MJ. Recognition of errors in three-dimensional structures of proteins. Proteins. 1993;17:355–362. doi: 10.1002/prot.340170404. [DOI] [PubMed] [Google Scholar]
- 60.Jorgensen WL, Maxwell DS, Tirado-Rives J. Development and testing of the OPLS All-Atom force field on conformational energetics and properties of organic liquids. J Am Chem Soc. 1996;118:11225–11236. [Google Scholar]
- 61.Kaminski GA, Friesner RA, Tirado-Rives J, Jorgensen WL. Evaluation and reparametrization of the OPLS-AA force field for proteins via comparison with accurate quantum chemical calculations on peptides. J Phys Chem B. 2001;105:6474–6487. [Google Scholar]
- 62.Wiederstein M, Sippl MJ. ProSA-web: interactive web service for the recognition of errors in three-dimensional structures of proteins. Nucleic Acids Res. 2007;35:W407–W410. doi: 10.1093/nar/gkm290. [DOI] [PMC free article] [PubMed] [Google Scholar]
- 63.Desmond Molecular Dynamics System, version 2.2. New York, NY: D.E. Shaw Research; 2009. [Google Scholar]
- 64.Bowers KJ, Chow E, Xu H, Dror RO, Eastwood MP, Gregersen BA, Klepsis JL, Kolossvary I, Moraes MA, Sacerdoti FD, Salmon JK, Shan Y, Shaw DE. Scalable algorithms for molecular dynamics simulations on commodity clusters. Tampa, Florida: ACM; 2006. [Google Scholar]
- 65.Goodford PJ. A computational procedure for determining energetically favorable binding sites on biologically important macromolecules. J Med Chem. 1985;28:849–857. doi: 10.1021/jm00145a002. [DOI] [PubMed] [Google Scholar]
- 66.GRID version 22a. Pinner, Middlesex, UK: Molecular Discovery, Ltd; 2005. [Google Scholar]
- 67.Brady GP, Jr, Stouten PF. Fast prediction and visualization of protein binding pockets with PASS. J Comput-Aided Mol Des. 2000;14:383–401. doi: 10.1023/a:1008124202956. [DOI] [PubMed] [Google Scholar]
- 68.Schrödinger Suite 2009 Induced Fit Docking protocol. Glide, version 5.5. New York, NY: Schrödinger, LLC; 2009. Prime, version 2.1. New York, NY: Schrödinger, LLC; 2009. New York, NY: Schrödinger, LLC; 2009. [Google Scholar]
- 69.Sherman W, Day T, Jacobson MP, Friesner RA, Farid R. Novel procedure for modeling ligand/receptor induced fit effects. J Med Chem. 2006;49:534–553. doi: 10.1021/jm050540c. [DOI] [PubMed] [Google Scholar]
- 70.MacroModel, version 9.7. New York, NY: Schrödinger, LLC; 2009. [Google Scholar]
- 71.Glide, version 5.5. New York, NY: Schrödinger, LLC; 2009. [Google Scholar]
- 72.Friesner RA, Banks JL, Murphy RB, Halgren TA, Klicic JJ, Mainz DT, Repasky MP, Knoll EH, Shelley M, Perry JK, Shaw DE, Francis P, Shenkin PS. Glide: a new approach for rapid, accurate docking and scoring. 1. Method and assessment of docking accuracy. J Med Chem. 2004;47:1739–1749. doi: 10.1021/jm0306430. [DOI] [PubMed] [Google Scholar]
- 73.Halgren TA, Murphy RB, Friesner RA, Beard HS, Frye LL, Pollard WT, Banks JL. Glide: a new approach for rapid, accurate docking and scoring. 2. Enrichment factors in database screening. J Med Chem. 2004;47:1750–1759. doi: 10.1021/jm030644s. [DOI] [PubMed] [Google Scholar]
- 74.Boström J, Norrby PO, Liljefors T. Conformational energy penalties of protein-bound ligands. J Comput-Aided Mol Des. 1998;12:383–396. doi: 10.1023/a:1008007507641. [DOI] [PubMed] [Google Scholar]
- 75.Hanson SM, Czajkowski C. Structural mechanisms underlying benzodiazepine modulation of the GABAA receptor. J Neurosci. 2008;28:3490–3499. doi: 10.1523/JNEUROSCI.5727-07.2008. [DOI] [PMC free article] [PubMed] [Google Scholar]
- 76.Venkatachalan SP, Czajkowski C. A conserved salt bridge critical for GABAA receptor function and loop C dynamics. Proc Natl Acad Sci USA. 2008;105:13604–13609. doi: 10.1073/pnas.0801854105. [DOI] [PMC free article] [PubMed] [Google Scholar]
- 77.Smith GB, Olsen RW. Identification of a [3H]muscimol photoaffinity substrate in the bovine γ-aminobutyric acidA receptor α subunit. J Biol Chem. 1994;269:20380–20387. [PubMed] [Google Scholar]
- 78.Krogsgaard-Larsen P, Johnston GAR. Structure-activity studies on the inhibition of GABA binding to rat brain membranes by muscimol and related compounds. J Neurochem. 1978;30:1377–1382. doi: 10.1111/j.1471-4159.1978.tb10469.x. [DOI] [PubMed] [Google Scholar]
- 79.Chang Y, Wu W, Zhang J, Huang Y. Allosteric activation mechanism of the cys-loop receptors. Acta Pharmacol Sin. 2009;30:663–672. doi: 10.1038/aps.2009.51. [DOI] [PMC free article] [PubMed] [Google Scholar]
- 80.Gao F, Bren N, Burghardt TP, Hansen S, Henchman RH, Taylor P, McCammon JA, Sine SM. Agonist-mediated conformational changes in acetylcholine-binding protein revealed by simulation and intrinsic tryptophan fluorescence. J Biol Chem. 2005;280:8443–8451. doi: 10.1074/jbc.M412389200. [DOI] [PubMed] [Google Scholar]
- 81.Bocquet N, Nury H, Baaden M, Le Poupon C, Changeux JP, Delarue M, Corringer PJ. X-ray structure of a pentameric ligand-gated ion channel in an apparently open conformation. Nature. 2008 doi: 10.1038/nature07462. [DOI] [PubMed] [Google Scholar]
- 82.Unwin N, Miyazawa A, Li J, Fujiyoshi Y. Activation of the nicotinic acetylcholine receptor involves a switch in conformation of the alpha subunits. J Mol Biol. 2002;319:1165–1176. doi: 10.1016/S0022-2836(02)00381-9. [DOI] [PubMed] [Google Scholar]
- 83.Hibbs RE, Sulzenbacher G, Shi J, Talley TT, Conrod S, Kem WR, Taylor P, Marchot P, Bourne Y. Structural determinants for interaction of partial agonists with acetylcholine binding protein and neuronal α7 nicotinic acetylcholine receptor. EMBO J. 2009;28:3040–3051. doi: 10.1038/emboj.2009.227. [DOI] [PMC free article] [PubMed] [Google Scholar]
- 84.Ebert B, Thompson SA, Saounatsou K, McKernan R, Krogsgaard-Larsen P, Wafford KA. Differences in agonist/antagonist binding affinity and receptor transduction using recombinant human γ-aminobutyric acid type A receptors. Mol Pharmacol. 1997;52:1150–1156. [PubMed] [Google Scholar]
- 85.Sine SM. The nicotinic receptor ligand binding domain. J Neurobiol. 2002;53:431–446. doi: 10.1002/neu.10139. [DOI] [PubMed] [Google Scholar]
- 86.Humphrey W, Dalke A, Schulten K. VMD: visual molecular dynamics. J Mol Graph. 1996;14:33–38. doi: 10.1016/0263-7855(96)00018-5. [DOI] [PubMed] [Google Scholar]
- 87.Grant BJ, Rodrigues AP, ElSawy KM, McCammon JA, Caves LS. Bio3d: an R package for the comparative analysis of protein structures. Bioinformatics. 2006;22:2695–2696. doi: 10.1093/bioinformatics/btl461. [DOI] [PubMed] [Google Scholar]
- 88.Wang J, Lester HA, Dougherty DA. Establishing an ion pair interaction in the homomeric ρ1 γ-aminobutyric acid type A receptor that contributes to the gating pathway. J Biol Chem. 2007;282:26210–26216. doi: 10.1074/jbc.M702314200. [DOI] [PubMed] [Google Scholar]
Associated Data
This section collects any data citations, data availability statements, or supplementary materials included in this article.