Abstract
Through a multi-disciplinary approach, the air amplifier is being evolved as a highly engineered device to improve detection limits of biomolecules when using electrospray ionization. Several key aspects have driven the modifications to the device through experimentation and simulations. We have developed a computer simulation that accurately portrays actual conditions and the results from these simulations are corroborated by the experimental data. These computer simulations can be used to predict outcomes from future designs resulting in a design process that is efficient in terms of financial cost and time. We have fabricated a new device with annular gap control over a range of 50 to 70 μm using piezoelectric actuators. This has enabled us to obtain better aerodynamic performance when compared to the previous design (2× more vacuum) and also more reproducible results. This is allowing us to study a broader experimental space than the previous design which is critical in guiding future directions. This work also presents and explains the principles behind a fractional factorial design of experiments methodology for testing a large number of experimental parameters in an orderly and efficient manner to understand and optimize the critical parameters that lead to obtain improved detection limits while minimizing the number of experiments performed. Preliminary results showed that several folds of improvements could be obtained for certain condition of operations (up to 34 folds).
Keywords: Air Amplifier, Electrospray Ionization, Modeling, Detection Limits
Introduction
Over the past three decades, researchers have invested heavily in applying and understanding electrospray ionization (ESI) for mass spectrometry and the return on investment has been profound.1-3 Numerous applications have been the result of this technique which merges sample separation techniques such as high performance liquid chromatography, capillary electrophoresis, and more recently microfluidic/chip based methods.4-10 While ESI mechanisms are still not fully understood, much has been learned about the production of analyte ions from this electrohydrodynamic process.11-16 Continued efforts to understand this process through experimentation, simulation, and modeling will further enable ESI practitioners to more efficiently exploit this technique for analytical studies.
The widespread usage of ESI for direct infusion and for coupling liquid chromatography to mass spectrometry has made this a very useful tool in the search for biomarkers.17 Devices such as high-field asymmetric ion mobility spectrometry18-20 (FAIMS), the ion funnel21-23, the air amplifier24-29 and an interface plate30 are being developed in efforts to improve mass spectrometric detection of diverse classes of analytes.
The air amplifier is an aerodynamic device which refocuses the electrospray plume into the mass spectrometer inlet based on Coanda and Venturi effects. The Coanda effect describes the formation of a thin boundary layer of motive fluid along a curved surface. The Venturi effect is based on Bernoulli’s Principle (conservation of energy) where a vacuum region is created from the conversion of a high pressure fluid (gas or liquid) to a high velocity jet.31 The air amplifier design employed in this study has previously been utilized with higher flow rate systems (microflow) and resulted in improved ion abundance.24-29 The purpose of the research presented herein is to guide future designs in an efficient manner. Efforts directed towards an improved air amplifier design that will provide a routine improvement in detection limits for ESI-MS have involved a combination of aerodynamic simulations using computer modeling, precision machining, bench testing, and mass spectrometry experiments. This multidisciplinary approach will facilitate a fundamental understanding of how the device serves to improve ESI-MS as it is applied in targeted and discovery biomarker experiments. The numerical tool used in the computational fluid dynamics simulations is a general-purpose Navier-Stokes solver (termed REACTMB-MP) for multi-phase, multi-component, reactive flows that has been developed in the Aerospace Engineering Computational Fluid Dynamics Lab (AECFDL) at NCSU over the last several years. Air amplifier designs that have been considered to have good potential (those which have converging solutions under the CFD simulations) are then precision machined using single-point diamond turning (SPDT) at the Precision Engineering Center.
Aerodynamic performances of air amplifier are sensitive to Coanda profile geometry and gap width control. Commercial air amplifiers or devices using a treaded insert to adjust gap width offer limited precision on gap width control. In order to effectively characterize the performance of the device we have designed a more robust positioning mechanism for the air amplifier by employing piezoelectric actuators to change the annular gap. By precisely controlling this annular gap (within μm), results are now easily reproducible and the experimental space can be explored efficiently. These were measured by monitoring the static pressure (i.e., vacuum generated by the device in the axial direction) and the stagnation pressure (i.e., gas flow out of the device nozzle). The static pressure measured in our current design shows a greater vacuum was generated in the device with piezoelectric actuators annular gap control (2X vacuum generated by previous design). Additionally, the stagnation pressure had improved symmetry over the previous device. These characteristics should lead to a more robust and reproducible method when using the air amplifier. Preliminary measurements on a triple quadrupole mass spectrometer have indicated that the device offers improvements in ion abundance even for low-flow ESI, where up to 34 folds of improvement were obtained under certain conditions. Continued exploration with designs and applications combined with LC-MS are expected to result in further improvements and robustness of the device.
Experimental
Materials
Tetramethylammonium bromide (98% purity), tetrabutylammonium bromide (98% purity), tetraheptylammonium bromide (98% purity) and formic acid and sequencing grade melittin were purchased from Sigma Aldrich (St Louis, MO). HPLC grade acetonitrile and water were purchased from Burdick & Jackson (Muskegon, MI). Nitrogen (99.98%) used to pressurize the air amplifier was obtained from MWSC High Purity Gases (Raleigh, NC).
Methods
Electrospray Ionization Mass Spectrometer
The electrospray solution was infused at a rate of 1-2 μL/min through 75 μm i.d. fused silica capillary terminating with a 30 or 75 μm PicoTip emitter (New Objective, Woburn, MA) using a Harvard PHD-2000 syringe pump. Mass spectra were acquired using a triple quadrupole mass spectrometer (Thermo Fisher, San Jose, CA) operating in positive ion mode. The capillary temperature was held constant at 250°C. The standard inlet was replaced with a stainless steel capillary with an internal diameter of 0.023 in and an overall length of 8.5 in such that the conductance and pressure in the first pumping stage of the mass spectrometer was unchanged.
Modeling of Air Amplifier Gas Dynamics
Calculations of gas dynamics of flow within the air amplifier devices are performed using an in-house computational fluid dynamics code, termed REACTMB. This code solves the compressible Navier-Stokes equations governing a two-component gas mixture (air and nitrogen). A finite-volume discretization method is used. The discretization of the inviscid (non viscous) component of the Navier-Stokes equation system uses a low-diffusion upwinding method28, extended to mixtures of real fluids at all speeds29. The formally first-order upwind scheme is extended to second-order accuracy using a slope-limited variable extrapolation technique. The viscous, diffusive, and heat-conduction terms in the Navier-Stokes equations are discretized using central differences.
Turbulence effects are modeled using the Menter k-ω two-equation formulation30, in both its baseline (BSL) and shear-stress transport (SST) forms. The SST modification essentially reduces the eddy viscosity, which generally increases the amount of separated flow that may be predicted. The governing equations are solved on a simply-connected set of multi-block meshes, generated using the GridPro software (Program Development Company, White Plains, NY). The computed flows are assumed to be axisymmetric.
Electrospray Modeling
To account for the response of a dilute spray under influences of the electric field and aerodynamic drag, the following system of equations is solved for each size class of droplet. Note that droplet vaporization is not included.
| (1) |
| (2) |
Here, is the mass density of size class k, referenced to the total system volume, ρd is the intrinsic density of the droplet, nk is the number density of size class k, dk is the average droplet diameter for size class k, uk,j is the jth component of the droplet velocity vector. The mass of a particular droplet of size class k is denoted as mk and the charge on each droplet is qd,k, as defined by the Rayleigh limit. Aerodynamic drag is modeled using the Stokes formulation:
| (3) |
where Vi is the ith component of the gas velocity vector and Cd is the Stokes drag coefficient. The combination of external and induced electrostatic forces on the droplet population is modeled as
| (4) |
The electrostatic potential is determined through the solution of the Poisson equation
| (5) |
Because of the presence of the number density in Eq. 5, the Poisson equation for the electric potential must be solved in tandem with the droplet transport equations. This accounts for the influence of the charged droplets on the electric field. The governing equations for the electrospray are discretized using a finite-volume method. The Poisson equation for the electric field is advanced using an implicit method based on the Generalized Minimal Residual (GMRES) algorithm of Saad and Schultz31. The equations for droplet transport are solved using an implicit technique based on an incomplete lower-upper decomposition of the linear system resulting from a Newton linearization of the droplet-transport equations. The analyses performed to date have assumed one-way coupling in that the motion of the gas affects droplet transport through the drag laws but the droplets do not affect the motion of gas. In this, converged solutions for the air amplifier flow field are obtained first and are then used to force the solution of the droplet fields. The cases presented later consider only one droplet size class (1 μm diameter), assumed to be the result of the primary breakup of the Taylor cone. Secondary droplet formation through fragmentation of the parent droplets is not yet considered.
Mechanical Design and fabrication
The new air amplifier was fabricated with 6061 aluminum. This material was chosen for its good machining characteristics (i.e., low hardness) and resistance to chemical corrosion. Rough machining of the parts was performed by an external machine shop using precision CNC machine and final machining of the critical surfaces was performed at the PEC using a single point diamond turning machine or DTM (ASG 2500 from Pneumo Rank). An in-house controller allows a resolution of the tool position in the order of 2.5 nm and as a result the dimension of the parts can be fabricated below 1 μm accuracy.
Dimensional controls were performed using a Gage 2000 Coordinate Measurement Machine (CMM) from Brown and Sharpe (North Kingstown, RI). Direct measurements are obtained with a resolution of 1μm and an accuracy of approximately 3 μm. Each machined part was measured independently and upon assembly, final parallelism and distance between face of bottom insert and mating surface of top insert was measured to determine the final height of the top insert that would lead to a 50 μm nominal gap. Similar methodology was used to plot the annular gap dimension as a function of the voltage applied to the piezoelectric stacks.
Three PZT actuators D1CM20 from Kinetic Ceramics (Hayward, California) were mounted inside the air amplifier to control the annular gap with a DC voltage source. A white light interferometer from Zygo New View (Middlefield, CT) was used to verify the surface finish of the critical Coanda profiles. The New View software can detect surface defects with nanometer resolution.
Pressure profile measurements
A stainless tube of 1/16 in OD (0.020 in ID) from VICI® (T30C20 series, Houston, TX) with four 0.020 in diameter holes were drilled was used as pitot tube in order to measure the static pressure profile along the main axis of the air amplifier for different pressure and annular gap position. A digital manometer was attached to the pitot tube for measurements.
Results and Discussion
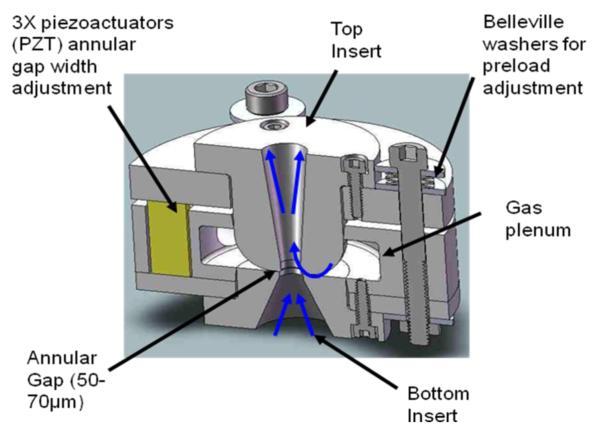
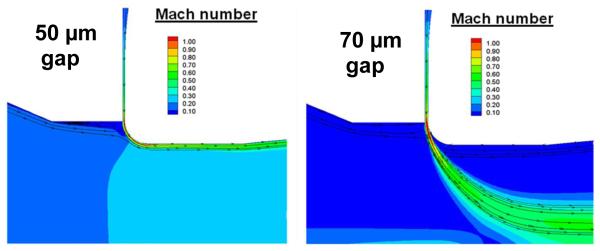
The Aerospace Engineering Computational Fluid Dynamics Lab worked together with the Precision Engineering Center to develop a first iteration of the air amplifier profile that was suitable for both fabrication and performance. The result is the design and fabrication of a high precision air amplifier with annular gap width control from 50 μm to 70 μm with deviation of less than 2 μm, while parallelism between the 2 faces of the annular gap is maintained at less than 1 μm. By measuring the change in elevation on the top face of the air amplifier as a function of the applied voltage, a voltage-annular gap calibration curve was created and used throughout the experiments (presented in Figure S2). Belleville washer stacks were used to preload the top and bottom part of the air amplifier assembly (100 N). This preload was stiff enough to maintain the annular gap when the plenum is pressurized with nitrogen, but flexible enough to allow actuation with the piezoelectric actuators. The air amplifier was designed so that top and bottom inserts are interchangeable to facilitate the implementation of future iterations of the device. A cross-sectional view of the first design is presented on Figure 1. When pressurized, the air amplifier successfully created a Venturi effect. Static pressure has been measured along the flow axis. These results showed that for every gap and plenum condition, the maximum measured vacuum at the same location: 1 mm downstream of the annular gap. Also, it was observed that increasing the plenum pressure or increasing the annular gap both increased the maximum vacuum pressure, while keeping the pressure profile nearly the same. These experimental data are provided in supplementary material Figure S2. Moreover, even though a higher vacuum peak can be obtained with a larger annular gap if pressure is kept constant, the maximum vacuum that can be obtained for each annular gap is the same as the Coanda effect is eventually lost when annular gap or the plenum pressure is increased beyond a maximum (see results in Table 1). More specifically, at 30 psi the annular nitrogen jet exiting from the 50 μm annular gap reaches Mach 1 at the nozzle exit and expands slightly to supersonic flow speeds. It then curves around the Coanda surface, remaining attached to the surface. In contrast, the annular jet formed through the 70 μm annular gap detaches from the Coanda surface as shown by prediction from aerodynamic model (Figure 2). Though not shown in this close-up view, the annular jet for the 70 μm gap impinges upon the air-amplifier centerline, disrupting the entrainment of air into the device and ultimately leading to the complete loss of the venture effect.
Figure 1.
Section view of air amplifier assembly
Table 1.
Comparison of maximum vacuum measured with old and new air amplifier. Maximum differential static pressure obtained along the axis of the air amplifier using a pitot tube for different plenum pressures and annular gaps. For new air amplifier, even if maximum static pressure increases as the annular gap increases for a constant plenum pressure, the maximum static pressure is similar for each annular gap setting is relatively the same. This is due to the fact that Coanda effect is lost at lower plenum pressure for larger annular gap.
| Old AA | New AA | ||||
|---|---|---|---|---|---|
| 50 μm gap | 60 μm gap | 70 μm gap | |||
| Plenum Pressure | 30 psi | −40 mbar | −79 mbar | −92 mbar | −107 mbar |
| 35 psi | −48 mbar | −96 mbar | −120 mbar | −144 mbar | |
| 40 psi | −61 mbar | −116 mbar | −140 mbar | No Coanda | |
| 45 psi | −70 mbar | −139 mbar | No Coanda | No Coanda | |
Figure 2.
CFD Simulation of Coanda effect at different annular gap for a pressure of 30 PSIG. At 50 μm, the air jet coming from the plenum pressure curves around the Coanda surface creating a Venturi effect in the air amplifier. At 70μm gap, the jet no longer stays attached to the curved surface and Coanda effect is lost.
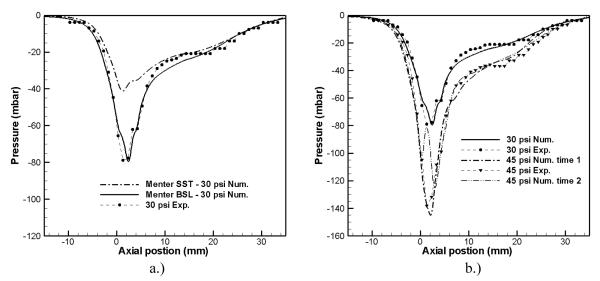
The pressure measurements described above have also been used to validate the gas-dynamics model. Mach number contours and streamlines showed that Menter SST turbulence model predicts more flow separation than the Menter BSL turbulence model (plots are presented in Figure S3). The nitrogen injection pressure for this case is 30 psi, and the annular inlet gap is 50 μm. The flow separation itself is a consequence of the adverse pressure gradient induced in the divergent portion of the air amplifier. The larger region of flow separation provides more resistance to the motion of the core fluid, inhibiting the amplifier’s ability to accelerate the entrained fluid to high velocities. Consequently, the pressure drop predicted for the Menter SST model is less than for the Menter BSL model and as it can be seen on Figure 3 (a), results predicted by Menter BSL model better match with the experimental results. Figure 4 (b) shows the effect of increasing the nitrogen injection pressure on the pressure distributions within the air amplifier for an annular gap of 50 μm. Only the BSL turbulence model is used in these calculations. As expected, the higher injection pressure induces more flow entrainment, indicated by a larger pressure drop. The predicted pressure distributions are in good agreement with experimental measurements, though the calculations do not converge to a completely steady state due to oscillations in the separated-flow region. Experiments performed on FTMS showed that the maximum signal was obtained when the tip of the MS inlet was located 1 mm downstream of the annular gap, i.e. at the location of the maximum static pressure (data not published). This confirmed that there exists a relation between the vacuum profile in the air amplifier and the signal and that focusing of ions is possible.
Figure 3.
(a.) compares both turbulence models with the experimental results at 30 PSIG Plenum pressure. Menter SST turbulence model better correlate with the experimental data. On (b.), Menter SST model is compared with experimental data for both 30 and 45 PSIG plenum pressure.
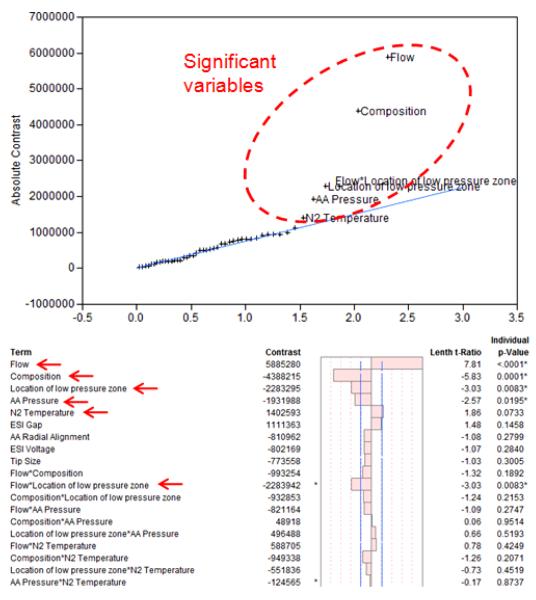
Figure 4.
Example of half normal probability plot generated by JMP (top of figure) compares and orders the estimated effects of the variables (vertical axis) with a normal quantile distribution assuming variables have no effect on the measured abundance (horizontal axis). Consequently variables on the right that are away from the normal quantile curve are considered to have a significant effect. Their calculated t-ratios and p-values (testing the probability to obtain these results assuming the variable has no effect) also confirm the significance of these variables.
Design of experiments
During preliminary tests performed with the air amplifier (not reported in this article), 10 different variables or parameters were identified as potentially having an effect on the performance of the air amplifier. Clearly identifying the parameters that do have an effect on the output by randomly tuning each of the parameters individually will give no guarantee that all the experimental space has been covered. For this reason, a more systematic approach was implemented through a proper design of experiment strategy to screen these variables and determine the primary effects on the performance of the air amplifier.
One way to cover the entire experimental space is to experimentally test all of the possible combination of settings. Although very effective in theory, it is unrealistic to proceed according to this approach. If for example 2 levels, high (+) and low (−) values, are chosen for n variables suspected to have an effect on a given output, 2n experiments will be needed in order to effectively identify the main effect and the all the possible interactions between variables having an impact on the results. As the number of experiment increases exponentially with the number of variables tested, it quickly becomes unrealistic to test all the possible combinations. If one accepts to reduce the resolution of the analysis by allowing the confounding of the main effects with some interactions, the number of experiments can be reduced significantly. This is achieved using Fractional Factorial Design (FFD): allowing the setting of one or more variable to be defined by the combination of other variable throughout the experiments. For example, if the effect of 5 variables is investigated, say ABCDE, all level combinations (+ and −) of the 4 first variables can be tested (ABCD) and the level of the fifth variable E can be defined as the combination of A and B (ex. If AB = ++ or −− → E = +). Consequently, the number of experiments will be reduced to 16 (see Table 1S for details). However, it will not be possible to differentiate the effect of some variables with the effect of combination of other variables. The following confounding structure will be created in this specific case : A & BCDE, B & ACDE, C & ABDE, D & ABCE, ABCD & E, AB & CDE, AC & BDE, etc. As some 2-variables interactions are confounded with 3-variables interactions, it is by definition a FFD of resolution V. The number of experiments can be reduced to 8 experiments if variable D is defined by AB and variable E is defined by BC. However, resolution will then be reduced to III as the main effect of a variable will be confounded with some 2-variables interactions (D & AB for example) and 2-variables interactions will be confounded with other 2-variables interactions. Any 2-levels with n variables that would be a full factorial design with 2n experiments can be converted in a fractional factorial design with 2n-k experiments, with k being the number of variable settings that will be defined by the combination of others. The resolution of the resulting FFD is defined by the variables that are confounded as follow27:
Resolution III Designs: Main effects are confounded or confounded with 2-variables interactions and two-factor interactions are confounded with each other.
Resolution IV Designs: No main effects are confounded with 2-variables interactions , but 2-variables interactions are confounded with each other.
Resolution V Designs: No main effect or two-factor interaction is confounded with another main effect or 2-variables interaction, but 2-variables interactions confounded with 3-variables interactions
If one compares the resulting number of experiments for full factorial design with n variables with fractional factorial design experiments of different resolutions it is obvious that for large n, the use of FFD becomes a necessity. A comparison plot of number of experiments for different resolutions of FFD and full fractional design as a function of n is presented in supplementary material Figure S4.
The analysis of the results obtained after performing the experiments as per the FFD can be performed as follow: each effect or interaction contrasts can be extracted by adding or subtracting for each column the results Yi, depending of the sign it has been assigned for each experiment. A large positive value would mean that the variable assigned to the “+” level has a positive effect on the output when compared to the value assigned to the “−” level. A large negative would mean the opposite, i.e. that the value assigned to the “−” level has a positive effect on the output. A value close to 0 would mean that the choice of the “−” or “+” value has a minimal impact on the results. P-values, t-ratio or other statistical hypothesis tests can then be calculated for each in order to weight and compare significance of the different effects and interactions. For our experiments, JMP version 8.0 from (SAS, Cary, North Carolina) was used to generate the experimental pattern and perform the screening analysis.
Screening experiments using FFD
To find the variables that could potentially have an effect on the air amplifier performances, A resolution V FFD experiment with 9 variables was performed. The variables and the 2 levels evaluated for each of them are presented in Table 2. The experiments were performed at high flow rates and ESI tip sizes (75-100 μm tip and 1-2 μL/min of 1μM melittin) as prescreening experiments showed significant improvement in that range. Results of these experiments are presented in Figure 4.
Table 2.
Summary of the variables and their low/high levels for which used to test the air amplifier performances. Device was tested in 3 different fractional factorial design experiments.
| Variable | Level + | Level − | Motivation |
|---|---|---|---|
|
Position of
vacuum peak |
1 mm from ESI inlet |
1 mm from MS inlet |
Previous experiments showed that these 2 parameters could have a positive impact |
| ESI Gap | 9 mm | 6 mm | As no improvement was found at 3mm with the amplifier during previous experiment, larger space was explored |
| ESI Voltage | 3200 V | 2800 V | Range that showed good performance in previous experiments |
| N2 Temperature | 100°C | 25°C | Hot N2 can improve desolvation |
|
Air amplifier
pressure |
45 PSI | 30 PSI | Amplifier pressure range |
| Composition | 100% H20 | 25% H20/75% ACN |
Test the hypothesis that the air amplifier can improve desolvation of aqueous solvents. |
|
Air amplifier
radial alignment |
Centered | 0.75 mm offset |
Previous experiments performed earlier showed that some |
| ESI Tip size | 100 μm | 75 μm | As previous experiments showed no overall signal improvement with air amplifier. This is to test the hypothesis that better results can be obtained with larger tips |
| Flow | 2 μL/min | 1 μL/min |
From these results, the following was deduced:
It confirmed that better signal is obtained when the low vacuum zone is focused on the mass spectrometer inlet (radially and axially).
Value of ESI voltage does not have a significant impact on the results. Once electrospray is established, increasing or lowering the voltage does not have a significant effect on the performance of the air amplifier. Voltage should be adjusted slightly above electrospray onset voltage for each experiment.
Tip size, flow size and solvent composition have an important contribution on the performance of the air amplifier. Better results were obtained were obtained with a 75 μm ESI tip, 2 μL/min flow and higher organic solvent composition.
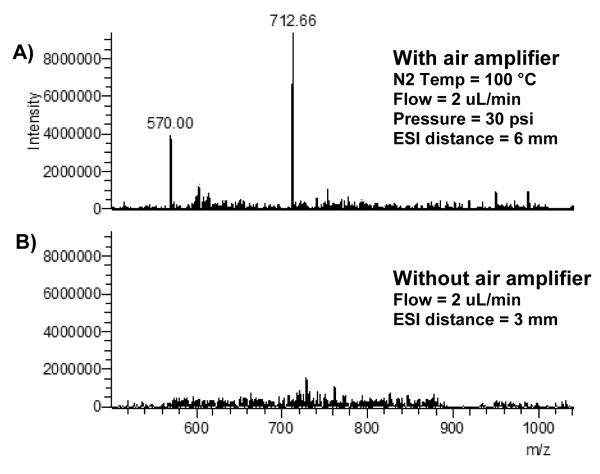
With the primary effectors identified, the objective of the next set of experiment was to compare the performance of the air amplifier at different combinations of flow and capillary tip size to the best result that can be obtained without using the air amplifier with a ESI gap of 3 mm (distance between emitter and MS inlet). 100% H2O and 50% H2O/50% ACN solvent compositions were both tested with 75 μm and 30 μm ESI emitter tips. For all tests, ESI voltage was set at 100V above the electrospray onset voltage. Table 3 shows the different variable combinations that were tested for each of these 4 solvent/ESI emitter tip combinations. No significant signal improvement was achieved by using the air amplifier for 50% H2O/ 50% ACN solvent composition when compared to the best result that can be obtained without using the air amplifier. At 100% H2O solvent composition and 75 μm ESI emitter tips, obtained signal without the air amplifier was below noise level. However, using the air amplifier, it has been possible to obtain a signal superior or equal to the signal obtained with a 30 μm tip and no air amplifier (see Figure 5). By averaging the sum of (M+4H)4+ and (M+5H)5+ signal for 124 measurements, a 34 folds improvement was obtained using the air amplifier under these conditions. This result is important as it shows that ESI-MS can be performed at high flow regime and larger ESI tip using the air amplifier.
Table 3.
Presented here are the setting that were tested for the 4 combinations of ESI capillary tip size and solvent composition.
| Pattern | ESI Gap (mm) |
Temp °C |
Flow (μL/min) |
Pressure (psi) |
|
|---|---|---|---|---|---|
| 1 | −+−+ | 6 | 100 | 1 | 45 |
| 2 | ++++ | 9 | 100 | 2 | 45 |
| 3 | ++−− | 9 | 100 | 1 | 30 |
| 4 | −−++ | 6 | 25 | 2 | 45 |
| 5 | − − − − | 6 | 25 | 1 | 30 |
| 6 | −++− | 6 | 100 | 2 | 30 |
| 7 | +−−+ | 9 | 25 | 1 | 45 |
| 8 | +−+− | 9 | 25 | 2 | 30 |
Figure 5.
Spectrum comparison for 75 μm ESI tip, ESI flow rate of 2 μL and 100% water solvent composition. A) Spectrum obtained when using the air amplifier. B) Although electrospray was established, only very weak signal (below noise level) was obtained without the air amplifier. Comparing average abundance of (M+4H)4+ and (M+5H)5+ ions for 124 spectrum, an improvement of 34 folds is obtained using the air amplifier under these conditions.
As expected, ESI emitter tip size and solvent composition had a significant effect on the observed signal. Analysis of the results for each composition/tip combinations with JMP software showed that except for the flow, none of the variables were that were tuned for each of the four combinations (ESI Gap, N2 Temperature and pressure) had a considerable effect on the results (JMP output example presented in Figure S5. This indicates that previous screenings successfully identified that the important variables and that the air amplifier is now operating very close to its optimal condition.
Additional QqQ Tests with tetraalkyl ammonium compounds
Additional tests on a triple quadrupole mass spectrometer with an equimolar mixture of tetraalkyl ammonium compounds has led to further conclusions. These tests showed that the use of the air amplifier improved signal stability compared to signal with ESI alone (no air amplifier) for each tetraalkyl compound. Furthermore, the relative signal stability is improved using the new air amplifier compared to the earlier version. These experiments also showed that the air amplifier was removing some of the bias due to the hydrophobicity of the molecule, i.e. the difference in abundance is shown to be the highest with ESI. The old air amplifier device removes some of the bias due to the varying hydrophobicities of these molecules, and the new device delimits this bias most effectively. This could be explained by the fact that the air amplifier also increases evaporation rate of the charged droplets, allowing the desolvation of more hydrophilic molecules. The results for these experiments are presented in Figure S6, Table S2 and Table S3.
Droplet Simulations with and without the Air Amplifier
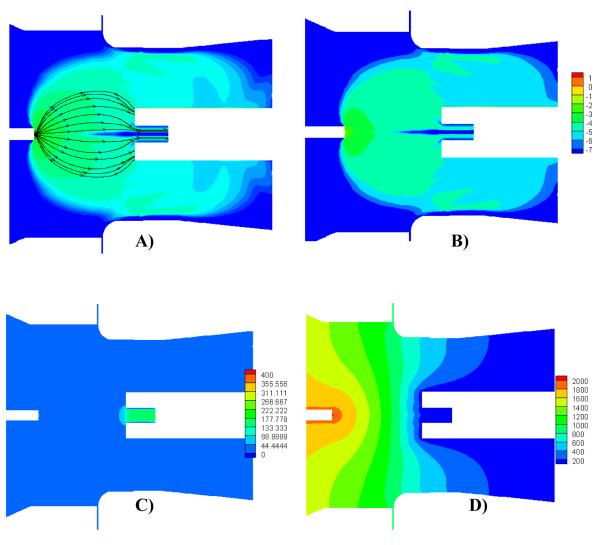
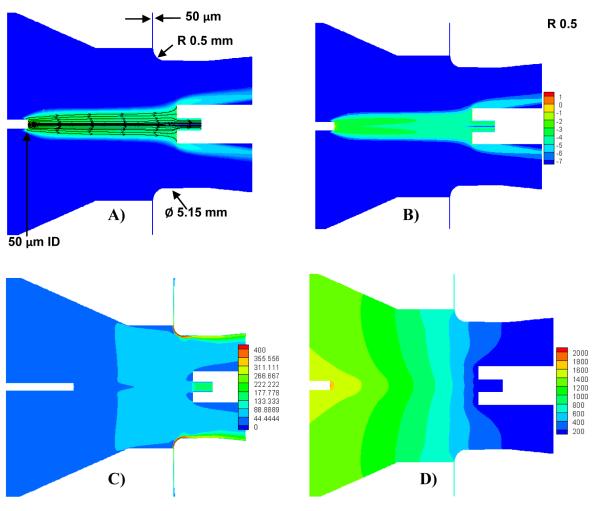
Numerical model for the fluid dynamics has been adapted in order to replicate the experimental conditions tested with 100% aqueous solution and 75 μm tip. Figure 7(A) shows the outline model built to simulate the fluid mechanics and data used for this model are presented in Table 4. A view of the complete model as well as some additional dimensions is presented on Figure S7. In Case 1, the Nitrogen gas in the plenum is kept at 100 °C and 30 psi gauge pressure. The gap between the ESI emitter and the Mass spectrometer is 6 mm. For the second case the Nitrogen gas is kept at the atmospheric pressure (hence no Coanda effect is produced), the ESI gap is decreased to 3 mm and the ESI voltage (voltage on the ESI emitter) is increased to 1850 V from 1600 V used in Case 1.
Figure 7.
Results without air amplifier A) Droplet Stream lines B) Logarithm of Droplet Density C) Velocity Contours D) Electrical Potential. With the air amplifier turned off, the charged particles rapidly scatter away from the ESI inlet. Consequently, the efficiency of the particle transmission to the MS inlet is reduced despite the fact that the distance between the ESI tip and MS inlet is only 3mm (was 6mm during the simulations made with the air amplifier).
Table 4.
Values used in the fluid numerical model. These are the same setting used in the experiment performed at 100% aqueous composition and 75um ESI emitter tip for which air amplifier was found to improve the signal significantly.
| Case 1 (With AA) | Case 2 (Without AA) | |
|---|---|---|
| ESI gap | 6 mm | 3 mm |
| ESI voltage | 1600 V | 1850 V |
| Solution type | 100 % Aqueous | 100 % Aqueous |
| Pressure in the Plenum | 30 PSIG | - |
| Temperature of N2 | 100 °C | - |
| Mass-in per second (kg/s) | 5.041523×10⁻¹² | 2.788 ×10⁻¹² |
|
Mass-out per second
(kg/s) |
2.26145 ×10⁻¹³ | 6.9307 ×10⁻¹⁴ |
| Mass-in-out ratio | 4.48565 ×10⁻² | 2.4855 ×10⁻² |
In spite of the above changes it can be clearly seen from the streamlines in Figure 6(A) and Figure 7(A), that the droplet stream is more focused towards the spectrometer when the air amplifier is used in Case 1 than in Case 2. For Case 1 around 4.48% of the mass coming in is captured in the spectrometer, for case 2 it is 2.48%. The main advantage of using an air amplifier is that it is capable of focusing the droplet stream over larger distances i.e. when compared to case 2 where the ESI gap is 3 mm, the air amplifier delivers more droplets into the spectrometer in case 1 where the ESI gap is 6 mm. Another advantage of having longer distances between the emitter and the spectrometer is that the droplets get more time to evaporate and desorb gas phase ions. Unfortunately the numerical model does not yet discriminate the gas phase ion produced upon reduction of droplet size by evaporation and desolvation from the charged droplets entering the mass spectrometer inlet. This would explain why the difference in signal predicted by the model between Case 1 and Case 2 is different than what was measured, i.e. droplets might enter the mass spectrometer as predicted by the model but ions are never being measured because they are incompletely desolvated.
Figure 6.
Results with air amplifier A) Droplet Stream lines B) Logarithm of Droplet Density C) Velocity Contours D) Electrical Potential. Focusing effect of the air amplifier is present as droplets remain centered axially. The distance between the ESI tip is 6 mm.
Conclusions
Based on initial computation fluid dynamic simulations, a new iteration of an air amplifier with a piezo-actuated annular gap has been designed and fabricated using precision engineering principles and equipment. Pressure profile measurement later confirmed an improvement in the aerodynamic performance for the new air amplifier when compared to the previous iteration. Furthermore, experimental aerodynamic measurements were used to validate and improve the gas dynamic model.
Fractional Factorial Design was used to systematically cover the experimental space and optimal conditions of operation for the new iteration of the air amplifier were successfully narrowed down. The results presented here show that the air amplifier significantly improves ESI-MS signal at higher flow rates and high aqueous content solutions. Without corroborating entirely with experimental results, the numerical simulation of the droplet also predicted the improvement in signal obtained using the air amplifier under these conditions. Gas dynamic model and numerical simulation of the droplet are currently used to design the next iteration of the air amplifier.
Additional tests performed with tetraalkyl ammonium compounds provided strong indications that the air amplifier can reduce the signal bias due to the different hydrophobicities. More tests will be performed in order to further explore the effect of the air amplifier under higher flow rates with LC-ESI-MS. We anticipate that the air amplifier will be an efficient and easy to implement way to increase detection limit in electrospray mass spectrometry at a relatively low cost.
Supplementary Material
Acknowledgements
The authors gratefully acknowledge financial support received from the National Institutes of Health (R21 CA134250), the W.M. Keck Foundation, and North Carolina State University.
Footnotes
Publisher's Disclaimer: This is a PDF file of an unedited manuscript that has been accepted for publication. As a service to our customers we are providing this early version of the manuscript. The manuscript will undergo copyediting, typesetting, and review of the resulting proof before it is published in its final citable form. Please note that during the production process errors may be discovered which could affect the content, and all legal disclaimers that apply to the journal pertain.
References
- 1.Fenn JB, Mann M, Meng CK, Wong SF, Whitehouse CM. Electrospray Ionization for Mass-Spectrometry of Large Biomolecules. Science. 1989;246(4926):64–71. doi: 10.1126/science.2675315. [DOI] [PubMed] [Google Scholar]
- 2.Fenn JB, Mann M, Meng CK, Wong SF, Whitehouse CM. Electrospray Ionization-Principles and Practice. Mass Spectrometry Reviews. 1990;9(1):37–70. [Google Scholar]
- 3.Fenn JB. Ion Formation from Charged Droplets - Roles of Geometry, Energy, and Time. Journal of the American Society for Mass Spectrometry. 1993;4(7):524–535. doi: 10.1016/1044-0305(93)85014-O. [DOI] [PubMed] [Google Scholar]
- 4.Whitehouse CM, Dreyer RN, Yamashita M, Fenn JB. Electrospray Interface for Liquid Chromatographs and Mass Spectrometers. Anal. Chem. 1985;57(3):675–679. doi: 10.1021/ac00280a023. [DOI] [PubMed] [Google Scholar]
- 5.Hiraoka K, Kudaka I. Electrospray Interface for Liquid-Chromatography Mass-Spectrometry. Rapid Commun. Mass Spectrom. 1990;4(12):519–526. [Google Scholar]
- 6.Smith RD, Loo JA, Edmonds CG, Barinaga CJ, Udseth HR. New Developments in Biochemical Mass-Spectrometry - Electrospray Ionization. Anal. Chem. 1990;62(9):882–899. doi: 10.1021/ac00208a002. [DOI] [PubMed] [Google Scholar]
- 7.Figeys D, Pinto D. Proteomics on a Chip: Promising Developments. Electrophoresis. 2001;22(2):208–216. doi: 10.1002/1522-2683(200101)22:2<208::AID-ELPS208>3.0.CO;2-O. [DOI] [PubMed] [Google Scholar]
- 8.Kim JS, Knapp DR. Miniaturized Multichannel Electrospray Ionization Emitters on Poly(dimethylsiloxane) Microfluidic Devices. Electrophoresis. 2001;22(18):3993–3999. doi: 10.1002/1522-2683(200110)22:18<3993::AID-ELPS3993>3.0.CO;2-X. [DOI] [PubMed] [Google Scholar]
- 9.Nadja BC, Christie GE. Practical Implications of Some Recent Studies in Electrospray Ionization Fundamentals. Mass Spectrometry Reviews. 2001;20(6):362–387. doi: 10.1002/mas.10008. [DOI] [PubMed] [Google Scholar]
- 10.Tiina S, Sami F, Tiina JK, Risto K, Tapio K, Raimo AK. Microchip Technology in Mass Spectrometry. Mass Spectrometry Reviews. 2009 doi: 10.1002/mas.20238. In Press. [DOI] [PubMed] [Google Scholar]
- 11.Kebarle P, Tang L. From Ions in Solution to Ions in the Gas-Phase - the Mechanism of Electrospray Mass-Spectrometry. Anal. Chem. 1993;65(22):A972–A986. [Google Scholar]
- 12.Tang L, Kebarle P. Dependence of Ion Intensity in Electrospray Mass-Spectrometry on the Concentration of the Analytes in the Electrosprayed Solution. Anal. Chem. 1993;65(24):3654–3668. [Google Scholar]
- 13.Zook DR, Bruins AP. On Cluster Ions, Ion Transmission, and Linear Dynamic Range Limitations in Electrospray (Ionspray) Mass Spectrometry. Int. J. Mass Spectrom. Ion Phys. 1997;162(1-3):129–147. [Google Scholar]
- 14.Bruins AP. Mechanistic Aspects of Electrospray Ionization. J. Chromatogr. A. 1998;794(1-2):345–357. [Google Scholar]
- 15.Wilhelm O, Madler L, Pratsinis SE. Electrospray Evaporation and Deposition. J. Aerosol. Sci. 2003;34(7):815–836. [Google Scholar]
- 16.Van Berkel GJ, Kertesz V. Using the Electrochemistry of the Electrospray Ion Source. Anal. Chem. 2007;79(15):5510–5520. doi: 10.1021/ac071944a. [DOI] [PubMed] [Google Scholar]
- 17.Muddiman DC. “Lewis and Clark” Proteomics. J. Proteome Res. 2006;5(2):221–222. doi: 10.1021/pr0626886. [DOI] [PubMed] [Google Scholar]
- 18.Buryakov IA, Krylov EV, Nazarov EG, Rasulev UK. A New Method of Separation of Multi-Atomic Ions by Mobility at Atmospheric-Pressure Using a High-Frequency Amplitude-Asymmetric Strong Electric-Field. Int. J. Mass Spectrom. Ion Phys. 1993;128(3):143–148. [Google Scholar]
- 19.Purves RW, Guevremont R. Electrospray Ionization High-Field Asymmetric Waveform Ion Mobility Spectrometry-Mass Spectrometry. Anal. Chem. 1999;71(13):2346–2357. doi: 10.1021/ac981380y. [DOI] [PubMed] [Google Scholar]
- 20.Barnett DA, Ells B, Guevremont R, Purves RW. Application of ESI-FAIMS-MS to the Analysis of Tryptic Peptides. Journal of the American Society for Mass Spectrometry. 2002;13(11):1282–1291. doi: 10.1016/S1044-0305(02)00527-5. [DOI] [PubMed] [Google Scholar]
- 21.Shaffer SA, Tang KQ, Anderson GA, Prior DC, Udseth HR, Smith RD. A Novel Ion Funnel for Focusing Ions at Elevated Pressure Using Electrospray Ionization Mass Spectrometry. Rapid Commun. Mass Spectrom. 1997;11(16):1813–1817. [Google Scholar]
- 22.Him T, Tolmachev AV, Harkewicz R, Prior DC, Anderson G, Udseth HR, Smith RD, Bailey TH, Rakov S, Futrell JH. Design and Implementation of a New Electrodynamic Ion Funnel. Anal. Chem. 2000;72(10):2247–2255. doi: 10.1021/ac991412x. [DOI] [PubMed] [Google Scholar]
- 23.Kim T, Tang KQ, Udseth HR, Smith RD. A Multicapillary Inlet Jet Disruption Electrodynamic Ion Funnel Interface for Improved Sensitivity Using Atmospheric Pressure Ion Sources. Anal. Chem. 2001;73(17):4162–4170. doi: 10.1021/ac010174e. [DOI] [PubMed] [Google Scholar]
- 24.Zhou L, Yue BF, Dearden DV, Lee ED, Rockwood AL, Lee ML. Incorporation of a Venturi Device in Electrospray Ionization. Anal. Chem. 2003;75(21):5978–5983. doi: 10.1021/ac020786e. [DOI] [PubMed] [Google Scholar]
- 25.Hawkridge AM, Zhou L, Lee ML, Muddiman DC. Analytical Performance of a Venturi Device Integrated into an Electrospray Ionization Fourier Transform Ion Cyclotron Resonance Mass Spectrometer for Analysis of Nucleic Acids. Anal. Chem. 2004;76(14):4118–4122. doi: 10.1021/ac049677l. [DOI] [PubMed] [Google Scholar]
- 26.Yang PX, Cooks RG, Ouyang Z, Hawkridge AM, Muddiman DC. Gentle Protein Ionization Assisted by High-Velocity Gas Flow. Anal. Chem. 2005;77(19):6174–6183. doi: 10.1021/ac050711l. [DOI] [PubMed] [Google Scholar]
- 27.Dixon RB, Muddiman DC. Quantitative Comparison of a Flared and Standard Heated Metal Capillary Inlet with a Voltage-Assisted Air Amplifier on an Electrospray Ionization Linear Ion Trap Mass Spectrometer. Rapid Commun. Mass Spectrom. 2007;21(19):3207–3212. doi: 10.1002/rcm.3206. [DOI] [PubMed] [Google Scholar]
- 28.Dixon RB, Muddiman DC, Hawkridge AM, Fedorov AG. Probing the Mechanism of an Air Amplifier using a LTQ-FT-ICR-MS and Fluorescence Spectroscopy. J. Am. Soc. Mass Spectrom. 2007;18(11):1909–1913. doi: 10.1016/j.jasms.2007.08.006. [DOI] [PMC free article] [PubMed] [Google Scholar]
- 29.Hampton CY, Forbes TP, Varady MJ, Meacham JM, Fedorov AG, Degertekin FL, Fernandez FM. Analytical Performance of a Venturi-Assisted Array of Micromachined Ultrasonic Electrosprays Coupled to Ion Trap Mass Spectrometry for the Analysis of Peptides and Proteins. Anal. Chem. 2007;79(21):8154–8161. doi: 10.1021/ac071297n. [DOI] [PMC free article] [PubMed] [Google Scholar]
- 30.Zhou L, Zhai LL, Yue BF, Lee ED, Lee ML. New Interface Plate for Microspray Ionization Mass Spectrometry. Anal. Bioanal. Chem. 2006;385(6):1087–1091. doi: 10.1007/s00216-006-0523-1. [DOI] [PubMed] [Google Scholar]
- 31.Jackson ML. Aeration in Bernoulli Types of Devices. Aiche Journal. 1964;10(6):836–842. [Google Scholar]
Associated Data
This section collects any data citations, data availability statements, or supplementary materials included in this article.


