

Abstract
We have performed cross-platform comparisons of output from 4 GWAS in late-onset Alzheimer's disease (LOAD) – Reiman et al., 2007; Li et al., 2008; Beecham et al., 2008 and Carrasquillo et al., 2009 to search for new association signals. The aim was to reveal genes that replicated across studies and hence merit further investigation. All SNPs with p-values ranging between 5×10⁻⁵ – 5×10⁻⁸ from each study were assessed across the other studies (either directly or by using a perfect proxy when comparing data from different chip platforms). This revealed only a single SNP (rs929156 in the tripartite motif-containing protein 15, TRIM15, gene) that was replicating across all studies at a level approaching genome-wide significance (P = 8.77×10⁻⁸) and where meta-analysis of odds ratios showed a significant effect on risk (OR 1.1, 95% Cl 1.0-1.2, P = 0.03). The vast majority of data analysed failed to replicate across these GWAS. The number of replicating association signals we observed is no higher than would be expected due to chance. However, increasing the power by using additional data from larger studies may enable this approach to identify potential LOAD candidate genes for confirmatory association studies.
Keywords: Late-onset Alzheimer's disease (LOAD), meta-analysis, genome-wide association analysis (GWAS), tripartite motif-containing protein 15 (TRIM15) gene, replication, single nucleotide polymorphism (SNP)
Introduction
Late-onset Alzheimer's Disease (LOAD) is the most prevalent form of dementia and the most common form of Alzheimer's Disease, representing 95% of AD cases in the population [1]. LOAD affects approximately 10% of individuals aged 65 years and almost half of people aged over 85 years [2]. There were 26.6 million people who suffered from LOAD worldwide in 2006, 700,000 of which were in the UK. This number is estimated to increase to 1 in 85 people – approximately 100 million worldwide by 2050 [3].
LOAD has complex aetiology which includes both genetic and environmental determinants. The disease is characterized at the pathological level by extracellular deposits of β-amyloid (Aβ) plaques in the cerebral cortex, and intracellular neurofibrillary tangles (NFTs) of hyperphosphorylated tau protein. Both observations are understood to be caused by misfolding and gradual conversion of highly soluble proteins into insoluble filamentous polymers [4]. To date hundreds of LOAD candidate genes have been explored, suggesting complex biological pathways exist that might explain disease risk (http://www.alzforum.org/). Susceptibility for LOAD is likely to be governed by an array of common risk alleles across a number of different genes which are involved in variety of biochemical pathways affecting both AD aetiology and pathogenesis [5].
APOE is currently the only gene that has been universally confirmed as a genetic risk factor for LOAD. The APOE protein is involved in the transportation of lipids around the body, and is also found to be responsible for chaperoning cholesterol through the blood stream. APOE has also been found essential for efficient intracellular degradation of soluble Aβ by microglia [6]. APOE activity in the brain requires lipidation by ATP-binding cassette 1 (ABCA1) [7]. LOAD is found to be associated with the APOE e4 allele which greatly increases the risk and reduces the average age at onset of AD. However, the risk polymorphism explains at most 50% of the genetic-risk effect in disease [8]. Therefore, additional genetic components must be involved in the complex aetiology of LOAD.
Genome-wide association studies (GWAS) are one of the most commonly used contemporary approaches to find genetic associations to diseases. These studies make it possible to investigate genetic contributions to LOAD from the entire genome. Genes with 5×10⁻⁵ to 5×10⁻⁸ significance may be genuine AD candidates that due to power constraints, have failed to reach genome-wide significance (<10−8). The aim of this paper was to select genes/regions that merit further study by identifying all SNPs with p-values within this range and then comparing their effects across other GWAS, either directly or by using a perfect proxy. The approaches we have employed to identify replicating signals can be applied to other studies to search across GWAS data from different platforms.
Methods
Of the 9 GWAS conducted to date studying Alzheimer's disease (Alzforum: http://www.alzforum.org/res/com/gen/alzgene/largescale.asp), we analysed data from four where the data was readily obtainable; subject-level genotype data from two, Reiman et al., 2007 and Carrasquillo et al., 2009 [9, 10], complete summary data from a third Li et al., 2008 [11] and summary data of top SNP hits (5×10⁻⁵ to 5×10⁻⁸) in the fourth Beecham et al., 2009 [8]. In each case quality control measures had been applied prior to data release. Further details of each study are listed in Table 1.
Table 1.
Summary of the four GWAS analyzed in this study
| Number of SNPs (post QC) | CHIP platform | Excluded SNPs (%) | Number of SNPs with LD (r2 = 1) | Number of LD Clusters (r2 = 1) | Number of Independent Tests | |
|---|---|---|---|---|---|---|
| Li et al. (2008) | 469,438 | Affymetrix 500K | 5% | 128,139 | 42,634 | 383,933 |
| Reiman et al. (2007) | 312,316 | Affymetrix 500K | 38% | 83,739 | 29,678 | 258,255 |
| Beecham et al. (2008) | 532,000 | Illumina 550 | 4% | - | - | - |
| Carrasquillo et al. (2009) | 313,330 | Illumina 300 | 1% | 26,284 | 11,539 | 298,585 |
The number of SNPs following QC, the platform utilisied and the percentage of SNPs excluded in each study is listed. Also shown are the number of perfect proxies (r2 = 1) in the QC'd data together with the number of clusters into which these SNPs fall. The number of independent tests for multiple test correction of combined p-values (listed in the supplementary tables) is shown in the last column and was calculated as described in the methods section.
Generating SNP results from subject-level genotype data (Reiman et al., 2007 and Carrasquillo et al., 2009)
Datasets Reiman et al., 2007 and Carrasquillo et al., 2009 [9, 10] were analyzed using the PLINK analysis toolset version 1.05 [12] (http://pngu.mgh.harvard.edU/~purcell/plink/index.shtml). GWAS data was converted into a file format appropriate for PLINK (.ped and .map) before analysis.
The following protocol was used to generate GWAS output from the genotyping data:
PLINK command: > plink –bfile ‘Input file’ –assoc –ci 0.95 –mind 1 –geno 1 –out ‘Output file’ was used for Carrasquillo et al., 2009 data.
PLINK command: > plink –bfile ‘Input file’ –allow-no-sex –assoc –ci 0.95 –mind 1 –geno 1 –out ‘Output file’ was used for Reiman et al.,2007 [10] data.
‘–bfile’ indicates the input data file which PLINK uses is in binary format, ‘–assoc’ is the main method for the allelic association test, which compares the minor allele frequencies between cases and controls, and calculates asymptotic p-values. ‘–ci’ 0.95 generates 95% confidence interval for odds ratios, ‘–mind 1’ indicates that the threshold for missing individuals is equal to 1, ‘–geno 1’ means the threshold for missing genotypes is equal to 1, both ‘–mind and –geno’ commands control the dataset quality in terms of SNP genotyping rate, ‘–out’ specifies the output file name.
To make the Reiman et al., 2007 [10] Affymetrix data comparable with Carrasquillo et al., 2009 Illumina data, the SNP ID was translated from Affymetrix SNP ID format “SNP_A-######” to dbSNP reference ID format “rs######”. The translation process utilized a PERL script created by ourselves.
As the sex status of individuals was unspecified in the Reiman et al., 2007 dataset [10], the ‘–allow-no-sex’ command enables PLINK to ignore unspecified sex and include all samples into the calculations.
Only limited information was obtained for the Beecham et al., 2009 and Li et al., 2008 studies [8, 11] (Table 1). It was not possible to merge datasets, since the two studies for which we had genotyping data used different chip platforms.
Comparing p-values across different GWAS
For each of the GWAS, all SNPs with p-values between 5×10⁻⁵ to 5×10⁻⁸ were compared across the other studies (where possible) either directly or by using a perfect proxy (r2 = 1). SNAP (SNP Annotation and Proxy Search) (http://www.broad.mit.edu/mpg/snap) was used to look for SNP proxies [13] using the HapMap Resource CEU population - release 22 (March 2007) as the reference dataset. We have used direct proxies in order to capture as much information as possible across the different chip platforms (each has their own SNP portfolio). Imputation attempts for SNPs in TRIM15 using PLINK yielded limited information when merging the datasets with the reference dataset. Imputed SNPs generated PLINK INFO (information content metric) scores lower than 0.8, indicating dissatisfied imputed SNPs. This low score is due to the poor LD architecture within this region and the limited availability of data.
We studied SNPs within the significance band 5×10⁻⁵ to 5×10⁻⁸ to search for potential new AD candidates that to date have failed to reach genome-wide significance; we have tested within this band to determine if there are genuine AD candidates that are yet to emerge due to the limited power of the GWAS to date. We appreciate that extending to a lower cut-off (> 10−5) may reveal more substantial information and this could well be a viable approach to use on larger GWAS datasets as they become available. Any SNPs with p-values below 5×10⁻⁸ were not included in our analyses; effectively this resulted in all SNPs in the APOE region on chromosome 19 being removed – this region replicated across all the studies. Four tables were created, one table for each of the GWAS listing the SNPs that were in this significance band together with the corresponding SNP p-values in the three other GWAS. Tables for Li et al., 2008; Beecham et al., 2009; Reiman et al., 2007 and Carrasquillo et al., 2009 [8–11] can be found in the supplementary material (tables 1-4 respectively).
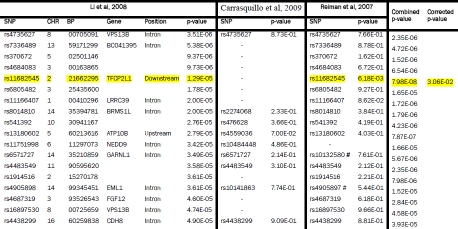
Supplementary Table 1.
Li et al, 2008 GWAS SNPs (5×10⁻⁵ < p < 5×10⁻⁸) compared with Reiman et al, 2007 and Carrasquillo et al, 2009. The GWAS from which SNPs were initially selected is shown on the left. Each row represents a SNP with a p-value between 5×10⁻⁵ to 5×10⁻⁸. The p-values are highlighted yellow if p < 0.05 and they replicated across two or more studies. If a perfect proxy was used the corresponding rs number is listed. The same platform was used in the Reiman et al, 2007 and Li et al, 2008 studies but data from a perfect proxy SNP (shown hatched) was used due to unavailability of data for the initial SNP. The combined p-values across studies are shown if the value approached genome-wide significance of 10−8. The final column shows the corrected p-value adjusted as described in the methods section. SNPs surviving correction for multiple testing are also highlighted in yellow.
 |
Supplementary Table 4.
Carrasquillo et al, 2009 GWAS SNPs (5×10⁻⁵ < p < 5×10⁻⁸) compared with Reiman et al, 2007 and Li et al, 2008. The GWAS from which SNPs were initially selected is shown on the left. Each row represents a SNP with a p-value between 5×10⁻⁵ to 5×10⁻⁸. If a perfect proxy was used the corresponding rs number is listed. No SNPs replicated across studies using the Carrasquillo et al, 2009 GWAS as the primary dataset.
| Carrasquillo et al, 2009 | Li et al, 2008 | Reiman et al, 2007 | Combined p-value | Corrected p-value | |||||||
|---|---|---|---|---|---|---|---|---|---|---|---|
| SNP | CHR | BP | Gene | Position | p-value | SNP | p-value | SNP | p-value | ||
| rs2318144 | 8 | 58277297 | ncRNA | 2.22E-06 | rs17194995 | 2.04E-01 | rs17194995 | 3.13E-01 | 1.42E-07 | ||
| rs1279795 | 23 | 123152101 | 5.02E-06 | rs1279795 | 8.42E-01 | - | 4.22E-06 | ||||
| rs3007421 | 1 | 6452776 | PLEKHG5 | Intron | 6.54E-06 | rs3007421 | 6.51E-01 | rs3007421 | 4.68E-01 | 1.99E-06 | |
| rs6546452 | 2 | 25834776 | 8.55E-06 | rs17680828 | 9.00E-01 | rs17680828 | 9.68E-01 | 7.45E-06 | |||
| rs7318037 | 13 | 81367146 | 1.15E-05 | rs4456389 | 9.82E-01 | rs4456389 | 2.39E-01 | 2.70E-06 | |||
| rs2118732 | 5 | 79419032 | 1.32E-05 | rs7736549 | 5.49E-01 | - | 7.25E-06 | ||||
| rs8039031 | 15 | 34954382 | MEIS2 | Downstream | 2.26E-05 | rs8039031 | 5.04E-01 | rs8039031 | 9.92E-02 | 1.13E-06 | |
| rs7245160 | 18 | 70417826 | AK056288/LOC400657 | Upstream | 2.66E-05 | rs7245160 | 4.60E-01 | rs7245160 | 4.15E-01 | 5.08E-06 | |
| rs856675 | 14 | 84405968 | 3.83E-05 | rs17737309 | 7.10E-01 | rs17737309 | 2.87E-01 | 7.81E-06 | |||
SNPs were selected for further analysis as described below:
SNPs with p-values 5×10⁻⁵ to 5×10⁻⁸ were selected from each of the GWAS.
p-values for the same SNPs (or proxies r2 = 1) across the remaining studies were determined.
The Fisher's combined p-value test was used as a summary statistic to give an overall value of association. It must be noted that this test does not correct for disparate effects created by alleles whose direction of association differs between studies – the so-called ‘flippers’. For the resultant p-value to be meaningful all effects must be in the same direction.
Combined p-values of 10−8 were corrected for the number of independent SNPs on the highest density platform utilised following QC (see section below).
We were only able to access the ‘top hits’ from Beecham et al., 2009 [8] , which limited our comparison across all 4 studies. Supplementary table 2 compares GWAS output for all 4 studies, whereas supplementary tables 1, 3 and 4 compare data from the remaining 3 GWAS.
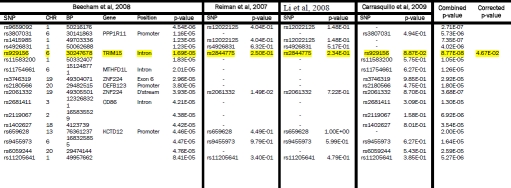
Supplementary Table 2.
Beecham et al, 2008 GWAS SNPs (5×10⁻⁵ < p < 5×10⁻⁸) compared with Reiman et al, 2007, Li et al, 2008 and Carrasquillo et al, 2009. The GWAS from which SNPs were initially selected is shown on the left. Each row represents a SNP with a p-value between 5×10⁻⁵ to 5×10⁻⁸. The p-values are highlighted yellow if p < 0.05 and they replicated across two or more studies. If a perfect proxy was used the corresponding rs number is listed. The combined p-values across studies are shown if the value approached genome-wide significance of 10−8. The final column shows the corrected p-value adjusted as described in the methods section. SNPs surviving correction for multiple testing are also highlighted in yellow.
 |
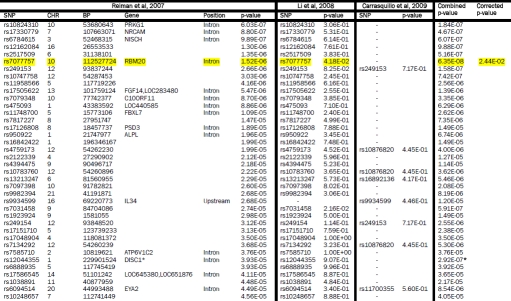
Supplementary Table 3.
Reiman et al, 2007 GWAS SNPs (5×10⁻⁵ < p < 5×10⁻⁸) compared with Li et al, 2008 and Carrasquillo et al, 2009. The GWAS from which SNPs were initially selected is shown on the left. Each row represents a SNP with a p-value between 5×10⁻⁵ to 5×10⁻⁸. The p-values are highlighted yellow if p < 0.05 and they replicated across two or more studies. If a perfect proxy was used the corresponding rs number is listed. The combined p-values across studies are shown if the value approached genome-wide significance of 10−8. The final column shows the corrected p-value adjusted as described in the methods section. SNPs surviving correction for multiple testing are also highlighted in yellow. DISC1 is starred to indicate that the combined p-value listed has included the data (p=8.20E-03) from the Beecham et al, 2008 study.
 |
Calculating the number of independent tests for correcting combined p-values
The protocol outlined below was used to calculate the number of independent tests for each study:
PLINK commands “–extract” and “–make-bed” were used to extract all SNPs (post QC) in each study from HapMap data - CEU population release 22.
The extracted files were used to calculate LD values. All SNPs in perfect LD (r2 = 1) were calculated using PLINK command: > plink –bfile ‘Input file’ –r2 –Id-window-kb 1000 –Id-window 99999 –Id-window-r2 1 –out ‘Output file.ld’
‘–r2’ is the command for calculating LD r2 value. ‘–Id-window-r2 1’ indicates the LD threshold is r2 = 1. ‘–Id-window 99999’ specifies the maximum number of pair-wise combinations to be calculated for each SNP is 99999.
The number of LD clusters (containing SNPs which share an r2 = 1) was calculated using a PERL script written ‘in-house’. The information from the PLINK result file ‘.Id’ were used for this calculation.
The number of independent tests was calculated using the formula: Number of independent tests = [Number of SNPs (post QC) – Number of SNPs in perfect linkage (r2 = 1)] + Number of LD Clusters with r2 = 1. These values are shown in Table 1.
The numbers of independent tests were calculated for Li et al., 2008, Reiman et al., 2007 and Carrasquillo et al., 2009 [9–11]. It was not possible to calculate the number of independent tests for the Beecham et al., 2008 GWAS [8], since we only had information on the ‘top hits’.
Meta-analysis of odds ratios
Any SNPs that showed a corrected combined p-value of less than 0.05 were further analyzed by comparing their corresponding odds ratios. The random-effects method was implemented in the StatsDirect software package. In contrast to Fisher's combined this test accounts for the direction of effect. Significance is only obtained when the effects are all in the same direction. A SNP could therefore be significantly associated using Fisher's combined but fail odds ratio meta-analysis.
Gene-centric analysis for TRIM15
A gene-centric approach was used to conduct an in depth SNP analysis of TRIM15. The LD architecture surrounding the gene was identified using LD plots generated in Haploview (version 4.0) using HapMap CEU population data. SNPs flankingthe gene (20kb either side) were also analyzed. The base pair co-ordinates were obtained from HapMap. The study-specific p-values for allelic association for each of the TRIM 15 SNPs were generated in PLINK using the data from the Reiman et al.,2007 and Carrasquillo et al., 2009 studies [9, 10]; the values from the summary data are used for Li et al., 2008 study [11].
Results
Analysis of GWAS
The SNP's with p-values 10−5 to 10−8 were identified for each study and then compared across all datasets. Combined p-values were determined for SNP that occurred in at least 2 studies. SNPs with combined p-values of 10−8 were corrected for multiple testing. Using this approach 3 SNPs were identified. rs11682545 (supplementary table 1 – Li et al., 2008 [11] as primary comparator) had a combined p-value of 7.98×10⁻⁸, corrected P = 0.0306. This SNP occurs downstream of the TFCP2L1 gene on chromosome 2. Using Beecham et al., 2008 as the comparator rs929156 (supplementary table 2) gave a combined p-value of 8.77×10⁻⁸, corrected P = 0.0467; this occurs in intronic sequence of the TRIM15 gene on chromosome 6. The third SNP (rs7077757) was identified in supplementary table 3 (Reiman et al., 2007 as primary comparator) with a combined p-value of 6.35×10⁻⁸, corrected P = 0.0244. This occurs in intronic sequence of the RBM20 gene on chromosome 10. No combined p-values of less than 10−8were evident using the Carrasquillo et al., 2009 as the primary comparator (supplementary table 4).
Meta-analysis of odds ratio for candidate SNPs
A random-effects meta-analysis of the allelic odds ratios was conducted for the 3 SNPs identified as outlined in section of “Analysis of GWAS” above (Table 2). The TRIM15 SNP gave odds ratios in the same direction (causative, Table 2) across 3 studies and on meta-analysis gave an odds ratio of 1.1 (95% CI 1.0-1.2; P = 0.03). The RBM20 (P = 0.95) and TFCP2L1 (P = 0.74) SNPs were not significant following meta-analysis.
Table 2.
Comparison of odds ratios across GWAS for selected SNPs
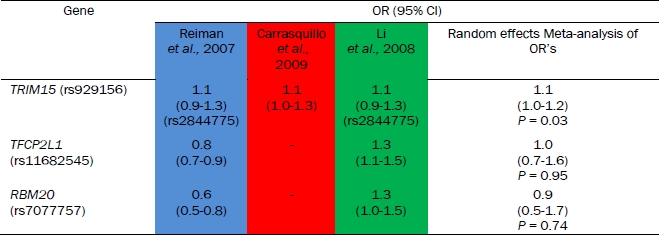 |
If the SNP was not present in a GWAS a perfect proxy (with r2 value of 1.0) was used to infer the odds ratio. The proxy SNP ID is shown underneath the corresponding odds ratios. The data shown is for the allelic association model. The 95% confidence interval for odds ratios are shown in brackets. The colours indicate the different GWAS (Reiman et al., 2007 – blue, Carrasquillo et al., 2009 – red and Li et al., 2008 – green). The results from random-effects meta-analysis of these odds ratios is given in the final column.
Gene-centric analysis of TRIM15
A gene-centric analysis of TRIM15 was undertaken (Figure 1) to explore the genetic architecture in more detail. The histogram shows the SNPs present in three different GWAS (Reiman et al., 2007; Carrasquillo et al., 2009 and Li et al., 2008 [9–11]), their associated p-values together with their degree of linkage.
Figure 1.

Schematic overview of the TRIM15 gene and the LD plot for this region. The histogram depicts all GWAS SNPs in TRIM15, their p-values and ID's are shown at the top of the figure. These are study colourcoded as indicated at the top of the figure. The two TRIM15 isoforms and their chromosomal positions are as depicted in HapMap. The LD plot is for the GWAS variants (Haploview 4.0, r2 values with r2 colour scheme). The blue diamond shapes and dotted red lines on the LD plot indicate the positions of SNPs with respect to the gene and are boxed in red on the LD plot. The SNPs at the boundaries of this LD block are also boxed in red and their location in the histogram depicted with dotted red lines.
Discussion
LOAD candidate genes
The APOE region on chromosome 19 was confirmed as a genetic-risk factor in LOAD by all four GWAS with SNP p-values ranging from 10−36 to 10−44. Apart from those linked to the APOE locus, there were no other SNPs with p-values less than 10−8. However, it is already known that at least 50% of the genetic-risk effects are independent of the APOE gene [8], suggesting that unidentified genes exist which contribute to LOAD pathogenesis. Genes with suggestive significance across different GWAS may infer a genuine Alzheimer's disease candidate.
Currently more than 500 genes and 2000 polymorphisms have been assessed as genetic risk factors in association with AD (http://www.alzforum.org/). Except for the APOE gene, most of the genes have conflicting reports regarding their associations with AD. However, each of the studies often uses different populations with varying male and female percentages, as well as differing age ranges and sample sizes. Results are therefore not always directly comparable between different studies [5]. The study approach we have used may help identify potential LOAD candidate genes whose signals replicate across studies.
GWAS association analysis uses very stringent significance levels to avoid the large number of false positives potentially arising from the confounding effects of population substructure and testing of a very large number of SNPs [14]. For example, in a GWAS using 500,000 independent markers, 25000 can be expected to show a nominal p-value ≤ 5×10⁻² by chance alone and five out of this 25000 may be significant with p-values 1×10⁻⁵. A widely accepted p-value of ≤ 5×10⁻⁸ is used to indicate genuine disease association in GWAS [15]. However, the SNPs on different chip platforms are often not independent. Many SNPs are in LD with other SNPs, potentially reducing the number of independent markers available for analysis. Secondly, the genotyping rate never reaches 100%, and after quality control, significant numbers of SNPs are excluded from study (see Table 1). This infers that a p-value of ≤ 5×10⁻⁸ may in some instances be too stringent and SNPs with p-values of 10−5 to 10−8 might well harbour genuine associations.
The potential role of TRIM15
TRIM15 is a member of the tripartite motif (TRIM) family. The TRIM motif includes three zinc-binding domains, a RING, a B-box type 1 and B-box type 2, and a coiled-coil region. The protein is localized to the cytoplasm. Two isoforms have been identified and described, however their biological functions have not as yet been identified. TRIM15 is expressed in various tissues including brain, kidney, prostate, liver, and colon. The biological role of TRIM15 has not yet been determined [16].
SNP rs929156 in TRIM 15 is located in an exon in one of the two TRIM15 transcripts. It changes the amino acid from a small, polar Serine to a medium-sized, polar Asparagine. It is located in a B30.2 SPRY like domain (position: 276-465 amino acids). The B30.2-like domain is a conserved domain found in nuclear and cytoplasmic proteins, as well as transmembrane and secreted proteins. The B30.2-like domain may also be associated with a zinc-binding B-box domain in the N-terminal [17]. The SPRY domain is proposed to be a protein interacting module, which recognizes and interacts with specific individual partner proteins [18]. The potential effects of this SNP on protein structure require further investigation. The only other TRIM15 SNP in these GWAS was rs9261536 which is located in the 5′ untranslated region (UTR), a potential regulatory region (i.e. a promoter region or a binding site for an associated transcription factor - Figure 1).
Possible linkage has been observed between the TRIM15 SNP and SNPs in Human leukocyte antigen A-2 alpha chain (HLA-A) with r2 value 0.77 (see supplementary Figure 1). The regions surrounding TRIM15 have a cluster of HLA genes which are associated with the human immune system. The group of HLAs encode cell-surface antigen-presenting proteins, which are essential elements in human immune responses. HLA-A is essential for immune recognition and apoptosis, and mutations in HLA-A have been implicated as a risk factors for various cancers [19]. Ma et al., 2008 [20] reported an interaction of HLA-A with APOE e4, relative risk 2.98 (95% CI = 1.14-8.24, P = 0.023) for HLA-A24 alleles in AD patients who do not carry APOE e4, compared with APOE e4 carriers. They also showed mutations in HLA-A may be associated with earlier age at onset in AD (by 2.4 years, p-value = 0.03) for those not carrying the APOE e4 allele.
Supplementary Figure 1.

Illustration of linkage disequilibrium (LD) between the TRIM15 and HLA-A genes. The red circle highlights the linkage between TRIM15 SNP rs9261536 (shown in bold) and three other SNPs in HLA-A with r2 value = 0.77. The LD plot was generated using HapMap data (CEU population release 22) and the programme Haploview version 4.0.
The significance of identified SNPs
In this paper we have described an approach to detect replicating signals across different GWAS and platforms in an effort to identify LOAD candidate genes that have failed to reach genome-wide significance previously. Using the data from the four studies listed has generally failed to produce any convincing replicating signals with the possible exception of the TRIM15 gene which contains the only SNP (rs929156) whose combined p-value (8.77×10⁻⁸) survives after multiple testing correction (0.0467) and where the meta-analysis of odds ratios is also significant (OR 1.1, 95% Cl 1.0-1.2, P = 0.03). The remaining two SNPs that had p-values of 10−8 failed to survive the meta-analysis of odds ratios because their effects were discordant between studies (Table 2). However, when discussing these observations it must be remembered that in a study of 74 genome-wide SNPs (as selected here) 5% would be expected to appear due to chance: thus we would expect to see in the region of 4 SNPs and we detect 3 signals. Another issue which is evident is the difficulty that exists when trying to compare data across different chip platforms where the SNP complement differs. There are surprisingly few perfect proxies available which results in a significant loss of data and will result in a reduction of power to detect new signals. Collectively these considerations have undoubtedly contributed to the non-replication of data across the GWAS. We propose that approaches such as we describe may prove to be useful when larger data sets are analysed. Any genes thus identified would need confirmation by follow up case/control association studies. They could also be subjected to deep resequencing to determine if they harbour multiple rare variants that may be associated with disease provided, of course, that a large enough resource is available to provide adequate power to be able to detect this. An important argument for GWAS is that the genes in which common variants are found, or genes nearby , may well contain functional rare variants; these may have high enough penetrance to be considered as candidates for possible preventive screening strategies in the future [14].
Note added in proof
Whilst this manuscript was in preparation there were a number of developments that impact on the approaches used in our analyses.
In the current version of PLINK (v1.06), an improved function called ‘–clump’ permits comparison of multiple results from different platforms. The ‘–clump’ utility takes all SNPs that are significant at user defined thresholds and calculates ‘clumps’ of all other SNPs based on the linkage disequilibrium (LD). However, this function does not perform any meta-analysis. We are aware that the latest version of PLINK (v1.07) (not released yet) will allow meta-analysis by using ‘–meta-analysis'. This will be a separate function from ‘–clump’ and will not take LD into account.
In the recently published UK LOAD GWAS paper [21] the TRIM 15 SNP, rs929156, was shown to be modestly associated with AD (P = 0.049). Adding this data results in a Fisher's combined p-value of 4.30×10⁻⁹ strengthening the evidence of association for this SNP. The odds ratio from the UK GWAS (OR = 1.07) was also compatible with the odds ratio we observed in the random effect meta-analysis (OR = 1.11).
Acknowledgments
This work was supported by the Alzheimer's Research Trust and the Big Lottery Fund. We would like to express our sincere thanks to Dr. Minerva Carrasquillo and Professor Steven Younkin (Mayo Clinic, Jacksonville, Florida, USA) for kindly providing us with the data from their GWAS.
References
- 1.Avramopoulos D. Genetics of Alzheimer's disease: recent advances. Genome Med. 2009;1(34) doi: 10.1186/gm34. doi: 10.1186/gm34. [DOI] [PMC free article] [PubMed] [Google Scholar]
- 2.Evans DA, Funkenstein HH, Albert MS, Scherr PA, Cook NR, Chown MJ, Hebert LE, Hennekens CH, Taylor JO. Prevalence of Alzheimer's disease in a community population of older persons. Higher than previously reported. JAMA. 1989;262:2551–2556. [PubMed] [Google Scholar]
- 3.Brookmeyer R, Johnson E, Ziegler-Graham K, Arrighi HM. Forecasting the global burden of Alzheimer's disease. Alzheimers Dement. 2007;3:186–191. doi: 10.1016/j.jalz.2007.04.381. [DOI] [PubMed] [Google Scholar]
- 4.Forman MS, Trojanowski JQ, Lee VM. Neurodegenerative diseases: a decade of discoveries paves the way for therapeutic breakthroughs. Nat Med. 2004;10:1055–1063. doi: 10.1038/nm1113. [DOI] [PubMed] [Google Scholar]
- 5.Bertram L, McQueen MB, Mullin K, Blacker D, Tanzi RE. Systematic meta-analyses of Alzheimer disease genetic association studies: the AlzGene database. Nat Genet. 2007;39:17–23. doi: 10.1038/ng1934. [DOI] [PubMed] [Google Scholar]
- 6.Jiang Q, Lee CY, Mandrekar S, Wilkinson B, Cramer P, Zelcer N, Mann K, Lamb B, Willson TM, Collins JL, Richardson JC, Smith JD, Comery TA, Riddell D, Holtzman DM, Tontonoz P, Landreth GE. ApoE promotes the proteolytic degradation of Abeta. Neuron. 2008;58:681–693. doi: 10.1016/j.neuron.2008.04.010. [DOI] [PMC free article] [PubMed] [Google Scholar]
- 7.Bu G. Apolipoprotein E and its receptors in Alzheimer's disease: pathways, pathogenesis and therapy. Nat Rev Neurosci. 2009;10:333–344. doi: 10.1038/nrn2620. [DOI] [PMC free article] [PubMed] [Google Scholar]
- 8.Beecham GW, Martin ER, Li YJ, Slifer MA, Gilbert JR, Haines JL, Pericak-Vance MA. Genome-wide association study implicates a chromosome 12 risk locus for late-onset Alzheimer disease. Am J Hum Genet. 2009;84:35–43. doi: 10.1016/j.ajhg.2008.12.008. [DOI] [PMC free article] [PubMed] [Google Scholar]
- 9.Carrasquillo MM, Zou F, Pankratz VS, Wilcox SL, Ma L, Walker LP, Younkin SG, Younkin CS, Younkin LH, Bisceglio GD, Ertekin-Taner N, Crook JE, Dickson DW, Petersen RC, Graff-Radford NR. Genetic variation in PCDH11X is associated with susceptibility to late-onset Alzheimer's disease. Nat Genet. 2009;41:192–198. doi: 10.1038/ng.305. [DOI] [PMC free article] [PubMed] [Google Scholar]
- 10.Reiman EM, Webster JA, Myers AJ, Hardy J, Dunckley T, Zismann VL, Joshipura KD, Pearson JV, Hu-Lince D, Huentelman MJ, Craig DW, Coon KD, Liang WS, Herbert RH, Beach T, Rohrer KC, Zhao AS, Leung D, Bryden L, Marlowe L, Kaleem M, Mastroeni D, Grover A, Heward CB, Ravid R, Rogers J, Hutton ML, Melquist S, Petersen RC, Alexander GE, Caselli RJ, Kukull W, Papassotiropoulos A, Stephan DA. GAB2 alleles modify Alzheimer's risk in APOE epsilon4 carriers. Neuron. 2007;54:713–720. doi: 10.1016/j.neuron.2007.05.022. [DOI] [PMC free article] [PubMed] [Google Scholar]
- 11.Li H, Wetten S, Li L, St Jean PL, Upmanyu R, Sum L, Hosford D, Barnes MR, Briley JD, Borrie M, Coletta N, Delisle R, Dhalla D, Ehm MG, Feldman HH, Fornazzari L, Gauthier S, Goodgame N, Guzman D, Hammond S, Hollingworth P, Hsiung GY, Johnson J, Kelly DD, Keren R, Kertesz A, King KS, Lovestone S, Loy-English I, Matthews PM, Owen MJ, Plumpton M, Pryse-Phillips W, Prinjha RK, Richardson JC, Saunders A, Slater AJ, St George-Hyslop PH, Stinnett SW, Swartz JE, Taylor RL, Wherrett J, Williams J, Yarnall DP, Gibson RA, Irizarry MC, Middleton LT, Roses AD. Candidate single-nucleotide polymorphisms from a genomewide association study of Alzheimer disease. Arch Neurol. 2008;65:45–53. doi: 10.1001/archneurol.2007.3. [DOI] [PubMed] [Google Scholar]
- 12.Purcell S, Neale B, Todd-Brown K, Thomas L, Ferreira MA, Bender D, Mailer J, Sklar P, de Bakker PI, Daly MJ, Sham PC. PLINK: a tool set for whole-genome association and population-based linkage analyses. Am J Hum Genet. 2007;81:559–575. doi: 10.1086/519795. [DOI] [PMC free article] [PubMed] [Google Scholar]
- 13.Johnson AD, Handsaker RE, Pulit SL, Nizzari MM, O'Donnell CJ, de Bakker PI. SNAP: a web-based tool for identification and annotation of proxy SNPs using HapMap. Bioinformatics. 2008;24:2938–2939. doi: 10.1093/bioinformatics/btn564. [DOI] [PMC free article] [PubMed] [Google Scholar]
- 14.Bodmer W, Bonilla C. Common and rare variants in multifactorial susceptibility to common diseases. Nat Genet. 2008;40:695–701. doi: 10.1038/ng.f.136. [DOI] [PMC free article] [PubMed] [Google Scholar]
- 15.Bertram L, Tanzi RE. Thirty years of Alzheimer's disease genetics: the implications of systematic meta-analyses. Nat Rev Neurosci. 2008;9:768–778. doi: 10.1038/nrn2494. [DOI] [PubMed] [Google Scholar]
- 16.Shiina T, Ota M, Shimizu S, Katsuyama Y, Hashimoto N, Takasu M, Anzai T, Kulski JK, Kikkawa E, Naruse T, Kimura N, Yanagiya K, Watanabe A, Hosomichi K, Kohara S, Iwamoto C, Umehara Y, Meyer A, Wanner V, Sano K, Macquin C, Ikeo K, Tokunaga K, Gojobori T, Inoko H, Bahram S. Rapid evolution of major histocompatibility complex class I genes in primates generates new disease alleles in humans via hitchhiking diversity. Genetics. 2006;173:1555–1570. doi: 10.1534/genetics.106.057034. [DOI] [PMC free article] [PubMed] [Google Scholar]
- 17.Henry J, Mather IH, McDermott MF, Pontarotti P. B30.2-like domain proteins: update and new insights into a rapidly expanding family of proteins. Mol Biol Evol. 1998;15:1696–1705. doi: 10.1093/oxfordjournals.molbev.a025896. [DOI] [PubMed] [Google Scholar]
- 18.Woo JS, Imm JH, Min CK, Kim KJ, Cha SS, Oh BH. Structural and functional insights into the B30.2/SPRY domain. EMBO J. 2006;25:1353–1363. doi: 10.1038/sj.emboj.7600994. [DOI] [PMC free article] [PubMed] [Google Scholar]
- 19.Hu SP, Zhou GB, Luan JA, Chen YP, Xiao DW, Deng YJ, Huang LQ, Cai KL. Polymorphisms of HLA-A and HLA-B genes in genetic susceptibility to esophageal carcinoma in Chaoshan Han Chinese. Dis Esophagus. 2009 doi: 10.1111/j.1442-2050.2009.00965.x. [DOI] [PubMed] [Google Scholar]
- 20.Ma SL, Tang NL, Tarn CW, Lui VW, Suen EW, Chiu HF, Lam LC. Association between HLA-A alleles and Alzheimer's disease in a southern Chinese community. Dement Geriatr Cogn Disord. 2008;26:391–397. doi: 10.1159/000164275. [DOI] [PubMed] [Google Scholar]
- 21.Harold D, Abraham R, Hollingworth P, Sims R, Gerrish A, Hamshere ML, Pahwa JS, Moskvina V, Dowzell K, Williams A, Jones N, Thomas C, Stretton A, Morgan AR, Lovestone S, Powell J, Proitsi P, Lupton MK, Brayne C, Rubinsztein DC, Gill M, Lawlor B, Lynch A, Morgan K, Brown KS, Passmore PA, Craig D, McGuinness B, Todd S, Holmes C, Mann D, Smith AD, Love S, Kehoe PG, Hardy J, Mead S, Fox N, Rossor M, Collinge J, Maier W, Jessen F, Schurmann B, van den Bussche H, Heuser I, Kornhuber J, Wiltfang J, Dichgans M, Frolich L, Hampel H, Hull M, Rujescu D, Goate AM, Kauwe JS, Cruchaga C, Nowotny P, Morris JC, Mayo K, Sleegers K, Bettens K, Engelborghs S, De Deyn PP, Van Broeckhoven C, Livingston G, Bass NJ, Gurling H, McQuillin A, Gwilliam R, Deloukas P, Al-Chalabi A, Shaw CE, Tsolaki M, Singleton AB, Guerreiro R, Muhleisen TW, Nothen MM, Moebus S, Jockel KH, Klopp N, Wichmann HE, Carrasquillo MM, Pankratz VS, Younkin SG, Holmans PA, O'Donovan M, Owen MJ, Williams J. Genome-wide association study identifies variants at CLU and PICALM associated with Alzheimer's disease. Nat Genet. 2009;41:1088–1093. doi: 10.1038/ng.440. [DOI] [PMC free article] [PubMed] [Google Scholar]