

Abstract
Concomitant with the genomic era, many bioinformatics programs have been developed to identify functionally important positions from sequence alignments of protein families. To evaluate these analyses, many have used the LacI/GalR family and determined whether positions predicted to be “important” are validated by published experiments. However, we previously noted that predictions do not identify all of the experimentally important positions present in the linker regions of these homologs. In an attempt to reconcile these differences, we corrected and expanded the LacI/GalR sequence set commonly-used in sequence/function analyses. Next, a variety of analyses were carried out (1) for the entire LacI/GalR sequence set and (2) for a subset of homologs with functionally-important “YxPxxxAxxL” motifs in their linkers. This strategy was devised to determine whether predictions could be improved by knowledge-based sequence sorting and – for some analyses – did increase the number of linker positions identified. However, two functionally important linker positions were not reliably identified by any analysis. Finally, we compared the new predictions to all known experimental data for E. coli LacI and three homologous linkers. From these, we estimate that >50% of positions are important to the functions of the LacI/GalR homologs. In corollary, neutral positions might occur less frequently and might be easier to detect in sequence analyses. Although analyses have successfully guided mutations that partially exchange protein functions, a better experimental understanding of the sequence/function relationships in protein families would be helpful for uncovering the remaining rules used by nature to evolve new protein functions.
Keywords: LacI/GalR, bioinformatics, sequence analysis, protein evolution, transcription repressor, specificity determinants
Introduction
Recent technological advances in DNA sequencing will very soon facilitate $1000 human genomes1. In turn, easily accessible patient genomes are expected to drive the development of individualized medical therapies. However, although the differences between genomes are easily spotted, the significance of the differences usually remains cryptic. For example, unless a polymorphism in a protein coding region has been previously correlated with disease or characterized in a laboratory, one does not know whether or to what extent the amino acid change alters patient health or protein function.
To decode the sequence/function relationship of protein polymorphisms, one promising and accessible resource is the set of naturally occurring homologs. An ever-increasing number of computational sequence/function analyses are being developed to analyze homolog sequences. These analyses not only identify conserved residue positions, but also predict which nonconserved positions are important for evolving unique paralog functions (often referred to as “specificity determining” positions; e.g. 2-25). When the latter positions are locations of patient polymorphisms, the protein functional change might not be catastrophic but could alter environmental or drug susceptibilities of the patient. Thus, identification of functionally important, nonconserved sites is as important as identification of conserved positions.
To that end, several research groups have developed sequence/function analyses to identify important nonconserved positions, and many have used the family of LacI/GalR transcription regulators as a test case (e.g. 4,12,14,16-18). One reason for choosing this family is that existing experimental data can be used to evaluate the success of predictions (i.e.26). Notably, the Miller lab exhaustively mutated E. coli LacI, characterizing the repression phenotype for up to 13 amino acid substitutions at nearly every protein position (∼4000 total mutants)27. Many studies designated subsets of the positions as “true positives”, based on criteria such as whether the position directly contacts ligand or another protein subunit. However, no study ever compared the full set of LacI functional data to the full set of predictions made by each analysis.
Furthermore, until our recent work, no experimental data was available to determine whether the functional importance of a given position is preserved between several homologs. To that end, we engineered LacI/GalR homologs in a way that allowed parallel experimental testing and meaningful data interpretation of analogous positions. Using these synthetic homologs, we assayed whether mutating a predicted “functionally important,” nonconserved position altered in vivo repressor function. Experiments focused on the 18 amino acids that link the DNA-binding domain to the regulatory domain (Figure 1), with 6 to 13 substitutions for each position in three homologous linkers28-30 (summarized in Table I). Results showed that all linker positions contribute to transcription repression; previous and ongoing experiments indicate that observed functional changes are biologically significant. In contrast, the computational analyses identified smaller subsets of linker positions as functionally important (summarized in Meinhardt and Swint-Kruse 200828).
Figure 1.
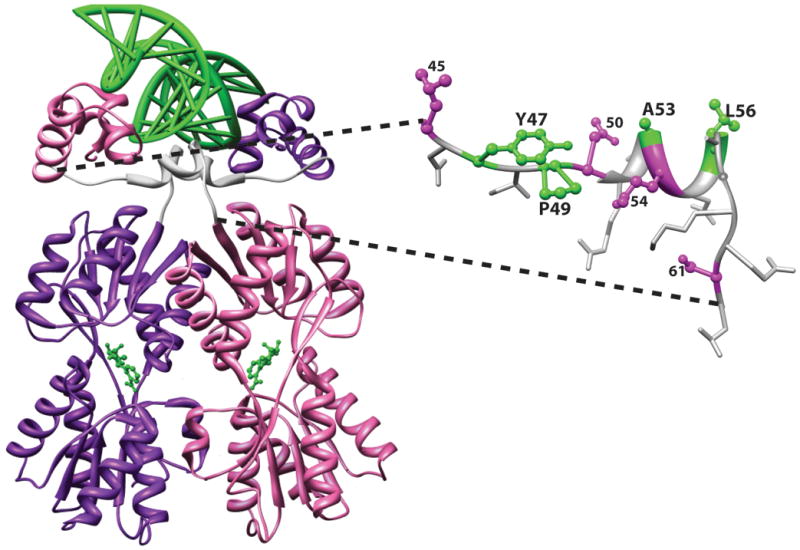
Representative structure of a LacI/GalR homolog with YPAL linker. The structure of the E. coli LacI dimeric variant from the pdb 1efa 39 was rendered with the program Chimera 58. On the left, the full length protein is shown with one monomer in purple and the other in pink. DNA is shown at the top of the figure as a green ladder; anti-inducer allosteric ligands are shown as green balls-and-sticks near the center of each monomer. On the structure of the full-length protein, the 18 amino acids that link the DNA-binding and regulatory domains are colored white. On the right side of the figure, the structure of one linker is expanded with linker side chains shown. YPAL positions 47, 49, 53, and 56 are colored green. A second group of positions with moderate conservation (45, 50, 54, and 61) are colored magenta. Nonconserved positions are shown as white sticks. Position 52 is the only side chain not visible; the side chain for position 57 (alanine in LacI) is near the base of the side chain for L56; the Cα of position 58 (glycine in LacI) is shown as a white ball on the backbone ribbon.
Table I. Summary of experimental functional data for LacI/GalR linker positions.
| Linker positions (LacI numbers) | ||||||||||||||||||
|---|---|---|---|---|---|---|---|---|---|---|---|---|---|---|---|---|---|---|
| 45 | 46 | 47 | 48 | 49 | 50 | 51 | 52 | 53 | 54 | 55 | 56 | 57 | 58 | 59 | 60 | 61 | 62 | |
| ca | c | c | c | c | h | h | h | h | h | h | h | h | h/cb | c | c | c | c | |
| Y | P | A | L | |||||||||||||||
| LacI phenotypesc | Number of amino acid variants with phenotype indicated | |||||||||||||||||
| I- | 7 | 1 | 11 | 9 | 9 | 8 | 1 | 12 | 11 | 2 | 12 | 9 | 6 | 1 | ||||
| -/+, +/- | 4 | 1 | 4 | 2 | 3 | 9 | 4 | 1 | 6 | 3 | 5 | 10 | 3 | 1 | ||||
| Is | 5 | 4 | ||||||||||||||||
| + | 2 | 13 | 1 | 1 | 2 | 3 | 3 | 5 | 1 | 1 | 5 | 1 | 1 | 2 | 2 | 10 | 8 | 13 |
| LacI in vitro characterizationd | Af,Al | |||||||||||||||||
| LLhP/LPhPe phenotypes | Number of amino acid variants with repression altered relative to parent chimera sequence | |||||||||||||||||
| Repression or allostery changef | √g | 7 | √ | √ | √ | 7 | √ | 9 | √ | √ | 10 | |||||||
| No detectable change | 1 | 2 | 1 | 1 | ||||||||||||||
| LLhP in vitro characterizationh | Af | Af | Ns | 3X | ||||||||||||||
| LLhG/LGhGi phenotypes | Number of amino acid variants with repression altered relative to parent chimera sequence | |||||||||||||||||
| Repression or allostery changej | 6 | 6 | 8 | 11 | 11 | √ | 9 | 12 | 15 | 21 | 9 | 12 | ||||||
| No detectable change | 1 | 2 | 3 | 1 | 1 | 4 | 2 | 3 | 5 | 4 | 1 | |||||||
Secondary structure: “c” coil’ “h”, helix.
The end of the helix differs in LacI and PurR49 and presumably differs in other homologs.
In this classic work by the Miller lab27, up to thirteen amino acids were substituted with suppressor codons; if the wild-type residue was not included in the substitution list, then the phenotype for a 14th amino acid is also known. “I-”, “-/+”, and “+/-” repressors have various levels of diminished repression. “Is” variants have diminished response to allosteric ligand. In addition, note that the wild-type “+” phenotype is broadly defined by at least 200-fold repression; thus some “+” variants might have diminished repression relative to wild-type LacI. Further, results do not report enhanced repression or enhanced induction.
Thermodynamic experiments with purified proteins quantitated the effects of 13 amino acid substitutions at position 52 (including wild-type V)26. All substitutions impact operator DNA affinity relative to wild-type, 7 substitutions alter allosteric response, and 2 substitutions allow binding to an operator that is bound nonspecifically by other variants (altered specificity).
LLhP is an engineered chimeric homolog comprising the LacI DNA-binding domain and linker and the PurR regulatory domain29. LPhP comprises the LacI DNA-binding domain and PurR linker and regulatory domain30.
The amino acid at the indicated linker position was varied with site-directed random mutagenesis. In vivo repression and allosteric response were quantitated for each repressor variant; the number of substitutions that resulted in changed function are indicated.
The “√” symbol indicates that a functional change occurred when the residue was swapped between the linkers of LLhP and LPhP or between LLhG and LGhG.
In vitro characterization of purified LLhP and 8 linker variants was used to assign functional roles to each indicated position54. “Af” - DNA binding affinity changes with substitution; “Ns” - substitution causes nonspecific DNA binding (weak with no allosteric response); “3X” - substitution altered DNA binding affinity, the selectivity for the most preferred DNA operator sequence, and the allosteric response.
LLhG is an engineered chimeric homolog comprising the LacI DNA-binding domain and linker and the GalR regulatory domain28. LGhG comprises the LacI DNA-binding domain and GalR linker and regulatory domain30.
Site-directed random and specific mutagenesis was performed for each in multiple variants of LLhG and LGhG; thus the total number of observations in which amino acids alter function can be >20. Sometimes an amino acid substitution that caused no change in one LLhG variant caused a dramatic change in another LLhG variant. See reference30 for further description and discussion.
We sought to determine the sources of the differences between the computational and experimental results. First, we revised and expanded the input dataset of LacI/GalR sequences. Previous computational studies used a common data set comprising ∼50-54 LacI/GalR sequences compiled in 2002 31. However, this sequence set contains two AraR homologs that have a different type of DNA-binding domain than canonical LacI/GalR proteins. Thus, predictions about residues of the DNA-binding domains and domain linker could be distorted by “noise” from the unrelated sequences. We revised and expanded the sequence set to include >1300 LacI/GalR homologs with canonical DNA binding domains.
Second, we considered whether knowledge-based sequence sorting could be used to improve prediction success. We previously noted that the presence or absence of a semi-conserved motif (“YPAL”) in the domain linker can be used to divide the LacI/GalR family into two subfamilies that correlate with known functional differences 28,32. However, the YPAL and non-YPAL linkers might have different nonconserved positions that are functionally important. These subfamilies are mixed in the 2002 LacI/GalR dataset, which might hinder identification of important nonconserved positions in YPAL linkers. Thus, we hypothesized that removing sequences with non-YPAL linkers would improve the prediction success for LacI/GalR homologs with YPAL linkers. This strategy improved the prediction rate of some sequence/function analyses.
Finally, we compared the data summarized in Table I and the functional data known for full-length for E. coli LacI to several prediction sets generated from the expanded and revised sequence set. From these, we conclude that >50% of amino acid positions in the full-length proteins are important to the functions of LacI/GalR homologs. The implications of this conclusion are that either (1) current selection criteria of sequence/function analyses are too stringent or (2) assumptions about protein sequence/function relationships that underlie the algorithms need to be improved. We further propose that nonconserved, functionally neutral positions might be rarer than important positions and might be easier to detect in sequence analyses. Identification of neutral positions would be of immediate utility in interpreting patient genome polymorphisms.
Methods
Sequence collection and organization
Using 67 LacI/GalR homologs as starting sequences (Supplementary Data), we performed multiple iterations of PSI-BLAST33 against the database of non-redundant protein sequences. Starting sequences comprised homologs with both YPAL and non-YPAL linker motifs. Since we wished to cluster LacI/GalR homologs by their full-length sequence similarities into “identity groups” (see below), we only retrieved sequences with >50% sequence identity relative to each query sequence. Subsequent PSI-BLAST iterations sometimes retrieved sequences below this threshold for the original query but above the threshold for other sequences; these were included in the dataset. Because of extensive, ongoing sequencing of bacterial genomes, we included only those bacterial sequences that were deposited by May 2009 in our collection.
To assist in the management of this large dataset, each sequence was assigned a unique number for our project. After clustering (below), the name of the sequence identity group was also added to the gene name to further aid data management and analyses.
Clustering based on sequence identities: groups and blocks
After the BLAST searches were complete, sequences were assigned to preliminary identity groups by using ClustalW 34 to generate “all-vs-all” sequence identities. Redundant sequences were defined by 100% sequence identity and identical amino acid length; we retained only one sequence of a redundant pair (our rationale is described in “Results”). The minimal number of nonredundant sequences to define an identity group was 4; eighty (80) sequences that did not have high sequence identity with at least three other sequences were classed as “ungrouped”. Ungrouped sequences were not used in subsequent analyses.
Each of the final 34 identity groups was defined by two criteria: the included sequences must show a high degree of identity to each other and they must show low identity to other sequences/groups (Figure 2A). We deliberately avoided assigning a threshold value (such as 50%) to define the groups. We reasoned that setting a threshold could artificially exclude a sequence with 49.9% identity to the query sequence while allowing a sequence with 50.1% identity to be included. We also wished to avoid designating a single reference sequence for each group to prevent any individual sequence from exerting a disproportionate influence on the analysis.
Figure 2.

(A) Relationships between sequence identity groups. The X and Y axes correspond to LacI/GalR homolog sequences of the short [All seq] representative list from MSA1; the same sequences are on each axis. Sequence identities between all pairs of sequences are shown as different colors on the contour plot; note that the scale differs from that in panel B. Labels for each identity group are on the plot. The boundaries for most identity groups are clearly visible, with most having <30% sequence identity to other identity groups (light and dark gray contours). We observed three instances of more closely related groups: GntR, IdnR-A, and IdnR-B; PurR and RbsR-A; and CcpA and PepR1. (B) All-vs-all sequence identities within the PurR identity group. The X and Y axes correspond to 93 unique sequences that are similar to E. coli PurR. Identities between all pairs of sequences are shown as different colors on the contour plot. Subclusters of sequence identities are apparent (light pink, peach, and white) and are labeled as blocks 1, 2, and 3. A few “remainder” sequences do not subcluster with other PurR sequences but have greater sequence identity with the PurR sequences (48-50%) than with any other identity group. Seventeen (17) PurR sequences were selected from the 3 blocks and the remainders for the [All seq] representative sequence list used in computational analyses.
Thus, we used the following process to cluster sequences into identity groups: For each preliminary identity group identified by the BLAST search, we used ClustalW to generate all-vs-all sequence identities. For each group, containing N sequences, we used Microsoft Excel to reformat the data as an N-by-N matrix to facilitate visual inspection of the data. (We belatedly realized that a similar matrix can be easily generated using the program Bio-Edit and imported directly into Excel. 35) Within each identity group, we observed that certain sequences tended to further subcluster on the basis of pairwise sequence identity (Figure 2B). We refer to these subclusters as “blocks”. A block comprised at least 4 similar sequences. Within most blocks, sequence identity was observed to be generally >75%; average sequence identity between blocks within an identity group was usually >50% and often >55%.
During the clustering process, we could determine two things. First, when a given sequence had an identity significantly below the rest of the group (usually <50%), we moved the sequence to a more appropriate group or to the “ungrouped” category. Second, if separate blocks of a preliminary identity group showed <50% average identity between blocks, we split the preliminary group into two groups. Some sequences appeared to belong with a particular identity group (typically with >50% sequence identity with the assigned identity group and much less than 45% identity with other identity groups) but did not subcluster with other sequences to form a block. These were designated as “remainders” for each identity group. Finally, we compared the all-vs-all sequence identities using representative sequences from all identity groups (Figure 2A). The plot generated from this analysis verified that the sequences of each identity group are more similar to their assigned group than they are to any other group. While the threshold between groups was usually close to 50% identity, some groups are bounded by higher or slightly lower values.
Block clustering within each identity group had two purposes - to ensure that we adequately identified the identity groups, and to extract a smaller, representative sequence set to use in subsequent analyses. (Many analysis programs are not capable of handling the 1344 sequences that we collected.) To construct the [All seq] representative list, we included three of the most disparate sequences from each block, and up to 10 from each identity group's remainders, for a total of 351 representative sequences (Table II). Ungrouped sequences were not included in the representative list. Of the 351 representative sequences, the largest identity groups were: 30 sequences from CcpA, 27 from GalRS, 26 from RbsR-A, 22 from GntR, and 17 from PurR. Thus, no single identity group dominated the dataset.
Table II.
Sequence sets used in analyses.
| Sequence Set Name | # of Sequences | Sequence Identity Groups | # of Id Groups | Comments |
|---|---|---|---|---|
| [All seq] representative list | 351 | All identity groups | 34 | All sequence/function analyses but webMINER |
| Short representative lista | 165 | All identity groups | 34 | webMINER; alignment with 80 ungrouped sequences |
| [YPAL + YPAL-like] (Removed nonYPAL) | 351-66 = 285 | [All seq] minus 8 identity groups in Figure 4C | 26 | Knowledge-based sequence sorting |
| [YPALonly] (Removed nonYPAL and YPAL-like) | 351-66-50 = 235 | [All seq] minus 12 identity groups in Figures 4B and C | 22 | Knowledge-based sequence sorting |
| Random Control 1 | 285 | All; 1000 sets with different random deletions | 34 | Removed sequences equal the number removed to create [YPAL + YPAL-like] |
| Random Control 2 | 235 | All; 1000 sets with different random deletions | 34 | Removed sequences equal the number deleted to create [YPALonly] |
| Group Control 1 | 351-67 = 284 | [All seq] minus 8 groups: Rbsr_A, YRM-A, YjmH, FruR/CRA, DegA, CytR, IdnR-A, and GalR-B | 26 | Removed sequences and identity groups similar to the numbers removed to create [YPAL+YPAL-like] |
| Group Control 2 | 351-67-48 = 236 | [Group Control 1] minus 4 groups: GalRS, ScrR-CE, Mal-A, and EbgR | 22 | Removed sequences and identity groups similar to the numbers removed to create [YPALonly] |
Subsets of the short representative list comprising [YPAL+YPAL-like] and [YPAL only] sequences were also created for webMINER analyses. Analogous Random and Group Controls were also created for webMINER.
Finally, the sequence identities of ∼80 ungrouped proteins were compared with all defined identity groups; most values were significantly lower than 50% (data not shown). Two sets of ungrouped sequences showed 40-60% identity to each other, small clusters of 2-3 sequences at >80% identity, but low (<35%) identity to any other group. Although the 40-60% range is higher than the average identity between the pairs of identity groups, the pairwise identity with the other sequences was too low – and the number of sequences with high identity was too small (<4) – to justify separate identity groups. As additional bacterial genomes are sequenced, identity groups might be illuminated for some of these ungrouped sequences. Alternatively, some of the ungrouped sequences might be singly-evolved family members.
Clustering based on linker sequence motifs
The 1344 sequences collected above were also independently sorted based on their linker motif sequences. The majority of sequences contained the YPAL linker motif. Other variations are described in Results. The representative set of 351 sequences comprised 235 sequences with YPAL linkers (67%), 50 with YPAL-like linkers (14%), and 66 with non-YPAL linkers (19%).
Sequence alignments
All sequence numbers used in this manuscript reflect the E. coli LacI numbering. Sequence/function analyses require an alignment of the 351 representative sequences. Since these span 34 identity groups, sequence identity between two sequences of the representative list can be as low as 15%. (For example, the LacI and TreR groups have ∼15% sequence identity to each other, but each has higher identity with other groups.) We therefore aligned the representative set using MUSCLE, which has been reported to be more reliable for sequence sets with lower identities (36; http://www.ebi.ac.uk/Tools/muscle/index.html). We quickly noted that even this algorithm did not accurately align the linker region. Further inspection found numerous discrepancies throughout the multiple sequence alignment (MSA). The alignment was manually corrected using the program BioEdit (35; http://www.mbio.ncsu.edu/BioEdit/bioedit.html). As benchmarks during editing, a structure-based sequence alignment (Combinatorial Extension; 37; http://cl.sdsc.edu/ce.html) was used, comprising E. coli TreR (pdb 1byk:A 38), E. coli LacI (1efa:A 39), E. coli PurR (1wet:A 40), and B. megaterium CcpA (1rzr:A 41); fortuitously, these four proteins were widely dispersed throughout the MUSCLE alignment. Manual editing eliminated 46 gaps from the alignment (MSA1).
Alignment was ambiguous for a few regions of MSA1. Therefore, we created two additional variations of the alignments (MSA2 and MSA3), which were also used in the sequence/function analyses described below. In the linker positions, the alternative MSAs shifted the positions of gaps in up to 32 sequences with nonYPAL linkers (see below) and/or shifted the position of an inserted residue that was present in some PurR and RbsR-A sequences immediately preceding the YPAL motif. (Of the representative RbsR-A sequences included in the [All seq] dataset, most have canonical YxPxxxAxxL motifs, whereas 3 sequences have either YYxPxxxAxxL or YHxPxxxAxxL. It is unclear whether the first or second residue represents the insertion, because 7 of the 114 sequences in the RbsR-A identity group have an YYxPxxxAxxL motif, 2 have an YFxPxxxAxxL, and 2 have YHxPxxxAxxL. One PurR sequence has the YHxPxxxAxxL insertion. The RbsR-A group might be evolving sequences with YPAL-like linkers.)
A final alignment of 351 representative proteins in MSA1 may be downloaded from the Supplementary Data. Since different linker sequence motifs almost perfectly correlated with various identity groups (see Results), we successively removed the non-YPAL and YPAL-like identity groups to create two subsets of the [All seq] representative list: [YPAL+YPAL-like] and [YPALonly] (Table II). We did not re-align the remaining sequences prior to additional analyses (described below).
In order to run the web-based version of MINER (see below), we needed to further shorten the list of representative sequences to less than 200 sequences. This was accomplished by randomly removing every second or third sequence from the optimized alignment, resulting in a list of 165 remaining proteins (Supplementary Data). We chose to include fewer than 200 sequences so that we would have room in the future to add additional sequences from any newly discovered groups. Sequences from the shortened representative list were also re-aligned with the ∼80 “ungrouped” sequences using MUSCLE to verify low sequence identities between the ungrouped and grouped sequences.
Sequence/function analyses
Functionally important positions were predicted from the manually-adjusted multiple sequence alignments using the following programs: ConSurf (19,20; http://consurf.tau.ac.il/), Evolutionary Trace Analysis(21,22; http://mammoth.bcm.tmc.edu/ETserver.html), TEA-O (14; http://nava.liacs.nl/kye/TEA-O/), SDPpred (16; http://bioinf.fbb.msu.ru/SDPpred/), webMINER (42,43; http://coit-apple01.uncc.edu/MINER/), and an implementation of the McLachlan Based Substitution correlation (McBASC) co-evolution algorithm developed by Fodor and Aldrich (44-46; http://www.afodor.net/). Most analyses were carried out with the representative list of 351 sequences described above and repeated for MSA1, 2, and 3. The web-based MINER analysis is limited to 200 sequences and we thus used the short representative list (Table II; 165 sequences).
For predictions of important protein positions, we used three subsets of the representative sequence list (Table II): sequences from all identity groups ([All seq]), sequences from identity groups with YPAL and YPAL-like linkers ([YPAL+YPAL-like]), and sequences from identity groups that have only YPAL linkers ([YPALonly]). Our rationale for removing sequences with alternative linker-motifs was that the inclusion of non-YPAL sequences might cause “noise” that obscured the functional significances of positions in the YPAL linkers. Some analyses were carried out using only sequences with non-YPAL linkers; results were generally not informative (not shown), which is not surprising given their disparate positions on preliminary phylogenetic trees (not shown).
Altered predictions from the analyses of linker subtypes might be due to removing sequence noise (our hypothesis) or from over-sensitivity to changes in the total number of input sequences. As a control for the latter, we created four sequence sets. In the first two sets, we randomly removed either 66 or 116 sequences from the MSA of 351 sequences (Random Control 1 and 2; Table II). One thousand (1000) different versions of Random Control 1 and Random Control 2 were created by removing different sequences in equal representation from the [YPAL], [YPAL-like], and [non-YPAL] subsets. For some sequence/function analyses, we were able to automate analysis of all 1000 sequence sets. For other analyses with Random Controls 1 and 2, we chose either the first 250 or 10 sets that contained the E. coli LacI reference sequence, as the time-constraints of each analysis allowed.
The second pair of control sequence sets was created to ascertain whether removing entire sequence identity groups impacted predictions. To create these sets (Group Control 1 and 2), we removed identity groups so that the final number of groups and sequences was equivalent to either the [YPAL+YPAL-like] or to the [YPALonly] sequence set. In addition, we matched the percentages of the different linker types in the Control Groups to the [All seq] dataset (67% YPAL, 14%YPAL-like, 19% non-YPAL). Thus, to control for removing 66 non-YPAL sequences that span 8 groups, we removed 8 groups, YPAL=[Rbsr-A, YRM-A, YjmH, FruR, DegA], YPAL-like=[CytR], and non-YPAL=[IdnR-A, GalR-B], comprising 67 sequences (Group Control 1 in Table II). To control for removal of 50 YPAL-like sequences that span 4 groups, we removed an additional 4 groups, YPAL=[GalRS, ScrR-CE], YPAL-like=[Mal-A], and non-YPAL=[EbgR], comprising 48 sequences (Group Control 2 in Table II). Unless described in Results, the control analyses showed changes in the position ranks but, using the various cutoff criteria listed in Tables II and III, the list of predicted linker positions did not change.
Table III. Results from Analyses that Identify Conserved and Semi-Conserved Positions.
| Linker positions (LacI numbers) | |||||||||||||||||||
|---|---|---|---|---|---|---|---|---|---|---|---|---|---|---|---|---|---|---|---|
| 45 | 46 | 47 | 48 | 49 | 50 | 51 | 52 | 53 | 54 | 55 | 56 | 57 | 58 | 59 | 60 | 61 | 62 | ||
| ca | c | c | c | c | h | h | h | h | h | h | h | h | h/cb | c | c | c | c | ||
| Y | P | A | L | ||||||||||||||||
| Consurf | Scores 8-9 are denoted as functionally and/or structurally important | ||||||||||||||||||
| Automatic MSAc | 8 | 6 | 9 | 6 | 9 | 9 | 6 | 5 | 9 | 8 | 7 | 8 | 6 | 5 | 6 | 4 | 8 | 4 | |
| All Seq | 8 | 7 | 9 | 7 | 9 | 9 | 7 | 7 | 9 | 8 | 7 | 8 | 8 | 6 | 6 | 5 | 8 | 5 | |
| YPAL+YPALlike | 8 | 7 | 9 | 7 | 9 | 9 | 7 | 7 | 9 | 9 | 8 | 9 | 8 | 7 | 6 | 5 | 8 | 6 | |
| YPALonly | 8 | 7 | 9 | 7 | 9 | 9 | 8 | 7 | 9 | 9 | 8 | 9 | 8 | 7 | 6 | 5 | 8 | 6 | |
| Evol. Trace | top 25% of conservation scores | ||||||||||||||||||
| Report_Makerd | R | R | R | R | R | R | R | R | |||||||||||
| All Seq | X | X | X | X | X | X | X | X | |||||||||||
| YPAL+YPALlike | X | X | X | X | X | X | X | ||||||||||||
| YPALonly | X | X | X | X | X | X | X | X | X | ||||||||||
| TEA-O | top 25% of conservation scores | ||||||||||||||||||
| 2002 seq set13,e | O | O | O | O | O | O | O | O | |||||||||||
| All Seq | X | X | X | X | X | X | X | ||||||||||||
| YPAL+YPALlike | X | X | X | X | X | X | X | ||||||||||||
| YPALonly | X | X | X | X | X | X | X | X | |||||||||||
Secondary structure: “c” coil’ “h”, helix.
The end of the helix differs in LacI and PurR49 and presumably differs in other homologs.
Predictions were generated by the online version of Consurf19, 20 that automatically selects sequences and generates an unoptimized alignment. Parameters of the analyses were to allow a range of 10 to 99% sequence identities, perform 5 iterations PSI-BLAST, with up 350 sequences allowed; however, only 197 sequences were identified. The alignment algorithm was MUSCLE.
Predictions were generated by the online “Report_Maker implementation of Evolutionary Trace Analysis52. “R” is used to differentiate these predictions from those generated by our optimized sequence selection and alignment (denoted “X”).
Predictions generated from the 2002 LacI/GalR dataset are denoted with “O” to differentiate them from predictions generated with the current, optimized sequence set (denoted “X”).
Details specific to particular sequence/function analyses are described below:
TEA-O analysis requires a Newick phylogenetic tree as input; in developing this analysis, the authors determined that trees calculated by various methods produced comparable TEA-O results14. We used the Prot-dist tree generated in BioEdit, which uses a neighbor joining algorithm. Most sequence identity groups comprised single, major branches of the tree that joined the center of the unrooted tree (not shown). When more than one sequence identity group occupied a major branch, the groups all had the same type of linker motif. Thus, we generated trees in two different ways. (1) We regenerated a new tree for each sequence set that is described in Table II; or (2) A tree for each sequence set was generated by removing the relevant sequences from the original tree, using the program Dendroscope (47; http://www-ab.informatik.uni-tuebingen.de/software/dendroscope) for Group Control sequence sets and using Newick Utilities (48; http://cegg.unige.ch/newick_utils) for Random Control sequence sets. The latter allowed us to assess the performance of 1000 versions of the Random Control sequence sets in TEA-O analyses. Results using the two different tree generation methods nearly perfectly correlated for all versions of analyses; the lowest squared correlation coefficient (R2) between the alternative results was 0.9951.
Evolutionary Trace Analysis and ConSurf utilize a protein structure in their analyses. For both, we used the 1efa:A structure of E. coli LacI (Figure 1, 39). This structure was solved for the LacI dimeric truncation mutant of the normally tetrameric protein. The sequence of 1efa:A differs in two additional ways as compared to the sequence deposited in Swiss-Prot and used in our dataset: it has the T109A polymorphism and is missing the N-terminal methionine. Evolutionary Trace Analysis requires that the sequence of the structure exactly match the sequence in the multiple sequence alignment. Thus, for Evolutionary Trace analyses, we changed the E. coli LacI sequence to match the structure.
SDPpred uses a random number seed in evaluations of prediction significance; thus, repeated predictions can differ from each other. We ran each sequence set 3 separate times, each with 10,000 shuffles and without predicting TM domains. (User note: We found that spaces in the gene names can significantly alter results without generating an error message in SDPpred. Since the number of predictions was greatly diminished when spaces were included, we suspect that the program may interpret part of the identifier as sequence data, with significant impact on the MSA columns.) Comparison of the runs showed that the list of “important” positions usually differed only by 1-3 positions out of 20-30 total “important” positions. We report all linker positions predicted to be important by any single SDPpred run. SPDpred analysis was carried out using two different divisions of “specificity” groups: we divided the sequences by (1) sequence identity groups and (2) sequence identity blocks. For analysis using blocks, we removed “remainder” sequences from the MSA of 351 sequences, so that each “specificity” group contained more than one sequence.
In running McBASC, we modified the source code to remove the filter for sequences with >90% sequence identity, so that all sequences in the input datasets were utilized.
Results
The LacI/GalR family has been used as the test sequence set for the development of many sequence/function analyses. We previously tested several of these predictions by performing mutagenesis on nonconserved amino acids in the sequence that links the DNA-binding and regulatory domains of the LacI/GalR proteins 28-30. Our detailed rationale for focusing on positions in the linker region is described in reference 30. In brief, the linker region contains functionally important, nonconserved positions that do not directly contact DNA ligand. These features were essential for experimental design and data interpretation, which require parallel mutations to be performed in multiple homologs that bind the same ligand.
Our experiments showed that several important, nonconserved linker positions were not detected by previous sequence/function analyses 28,30 (false negative predictions). Previous studies did not determine the prevalence of false negative predictions across the linker or many other regions of the LacI/GalR proteins, because only specific subsets of positions (such as those that directly contact ligand) were designated as “functionally important”. Indeed, the full set of available experimental information has never been correlated with sequence/function analyses of the LacI/GalR family. In addition, we noted that the prior LacI/GalR sequence set had potential problems (sequences with non-canonical DNA binding domains; missing many recently-sequenced homologs). Finally, we observed that the presence or absence of a canonical YPAL motif correlates with different types of DNA binding sites 32, effectively dividing the family into two subfamilies. We further reasoned that the YPAL and non-YPAL linkers might have different nonconserved positions that are functionally important. Thus, we hypothesized that the inclusion of non-YPAL linkers might obscure identification of important nonconserved residues in YPAL linkers; in corollary, removing the non-YPAL sequences might improve the prediction success for YPAL linkers.
Sequence clustering
We collected and categorized 1344 non-redundant sequences of proteins in the LacI/GalR family that were deposited in public databases by May of 2009. Including redundant sequences, these represent repressors from 284 bacterial species. We used a very liberal definition of “non-redundant” sequence as 99% identity and/or different sequence lengths for two reasons: First, our long-term goal is to discriminate important from non-contributing nonconserved positions, and we reason that we need to know all naturally-occurring changes for current and future analyses. Second, each different type of bacterium lives in a particular niche, and the most common role of the LacI/GalR proteins is to let the organism respond to changes in nutrient availability. Thus, a single amino acid difference might have a functional impact that allows different bacterial strains to respond, for example, to different concentration ranges of the same nutrient, or adapt to altered pH or temperatures of their individual environments.
By clustering homologs with similar sequence identities, we organized the non-redundant sequences into 34 identity groups (Figure 2A). Within each identity group, most sequences were >50% identical although, as detailed in Methods, the threshold differed for each identity group. Only a few of the ∼600 possible identity group vs identity group comparisons had sequence identities in the range of 45-55% (Figure 2A): PurR to RbsR-A; CcpA to PepR1; and GntR to IdnR-A and IdnR-B. Many groups contain known orthologs. Additional identity clustering occurred within each identity group and was used to define sequence identity “blocks” (i.e. Figure 2B). Most identity groups comprised two or more blocks.
Linker sequence motif variation
We have defined the LacI/GalR linker as the region that spans E. coli LacI positions 45-62 28,49; LacI numbers are used throughout this manuscript. In our previous studies 28, we noticed that a YxPxxxAxxL (“YPAL”) motif (Figures 1, 3, and 4) comprises the most highly conserved linker positions. Several lines of experimental evidence suggest that the presence or absence of this motif divides the LacI/GalR family into two functional subfamilies.
Figure 3.

Sequence variation for linkers with YPAL and YPAL-like motifs. Logos were generated using WebLogo (59; http://weblogo.berkeley.edu/logo.cgi). The large logo at top shows the sequence variation of canonical YPAL linkers that are found in 25 sequence identity groups; (in addition to the 22 YPAL sequence identity groups in Figure 4A and the Supplementary Figure, three YPAL-like sequence identity groups shown in Figure 4B have blocks of sequences with canonical YPAL linkers). Seventy (70) “ungrouped” sequences also have canonical YPAL linkers. The 5 smaller logos show sequence variation found in YPAL-like linkers.
Figure 4.

Linker sequence variation within identity groups. Logos were generated using WebLogo (59; http://weblogo.berkeley.edu/logo.cgi). The identity group name, total number of sequences, and the range of overall sequence identity within each group are shown. (A) Linker sequences for 6 of 22 identity groups with YPAL linkers. Weblogos for other identity groups with YPAL linkers are in the Supplementary Figure. A few PurR sequences have an amino acid inserted adjacent to position 47 (not shown) that leads to a “YYPAL” sequence. The functional effects of this insertion are not known. (B) YPAL-like sequences. The CytR identity group is classified as “YPAL-like” because some sequences have canonical YPAL linkers; other CytR linkers might be considered to be non-YPAL (i.e. E. coli CytR with YPGV). The Mal-A identity group is classified as “YPAL-like” because Franke et al. identified a repressor sequence with a YKAL linker that binds a DNA similar to those bound by canonical YPAL linkers (with a central CG basepair; 32). (C) Non-YPAL linkers always have Y or F at position 47 but are missing other components of the motif. In addition, these linkers have varied length (gaps indicated by “-”) and/or an increased number of P, G, or positively charged residues. All linkers with non-YPAL motifs have a hydrophobic residue at position 45, most often “L”.
First, the YPAL positions are critical for function in several well-characterized homologs. For example, in E. coli PurR, the L position can be substituted with M, but a V substitution is not functional 50. In the classic studies with E. coli LacI, in which up to 13 amino acid substitutions were made at nearly every position in the protein, all four YPAL positions were intolerant to substitution 27. Structurally (Figure 1), the YPAL side chains make a number of important contacts: The “Y” side chain at position 47 makes extensive contacts with the DNA-binding domain. The “P” at position 49 precedes a central “hinge” helix. The “AL” positions at 53 and 56 reside in the helix and their side chains contact DNA ligand. The side chains of the “L” residues from each monomer intercalate with two conserved central CG base pairs that separate two DNA half-sites (a full-length DNA binding site comprises two inverted-repeat half sites that are each bound by the DNA binding domain of the monomeric subunit; 39).
Approximately 33% of LacI/GalR homolog sequences lack features of the YPAL linker motif. For at least one such protein (E. coli CytR), the YPGV linker structure appears to be less-ordered than the YPAL structure shown in Figure 1, in order to accommodate varied spacing between DNA operator half-sites 51. We also previously noted 28 that the presence or absence of the YPAL motif correlates extremely well with the two types of DNA binding sites described by Franke et al 32; the key difference in these DNA binding sites is the presence or absence of the central CG base pairs between half-sites. Together, these observations led to the hypothesis that the LacI/GalR sequences divide into at least two functionally-distinct subfamilies. Further, we proposed that analyzing the sequences of the entire LacI/GalR family would result in different predictions for “important” functional positions than if the family were divided based on the presence or absence of the YPAL linker motif.
To that end, we sorted the 1344 sequences of the LacI/GalR linkers according to variations in the YPAL motif (Figure 3). We then inspected the linker sequences to determine whether linker motifs segregate into identity groups or whether linker type varies within a given group. We found that 67% of sequences had an intact YPAL motif (Figure 4A; Supplemental Figure); 14% of sequences had recognizable variations of the YPAL motif (i.e. YPAM, FPAL; Figure 4B); 19% of sequences had a non-YPAL linker (Figure 4C). Strikingly, the presence or absence of the YPAL motif is absolutely preserved for all homologs in 30 of the 34 identity groups (Figures 4A and C; Supplementary Figure). Further, the overall sequences of the YPAL linkers were fairly well conserved within each identity group (Figure 4A; Supplemental Figure). Notably, even though the overall sequence identities within the CcpA group vary from 35-99%, the linker sequences are very highly conserved (Figure 4A).
Sequences in four identity groups – CscR, Mal-A, TreR and CytR – had two or more linker motifs (Figure 4B). Many of these motifs are recognizable variations of YPAL (“YPAL-like”; i.e. FPAL, FPAM, YPAM). Some blocks of the CytR group have canonical YPAL motifs, whereas others do not. In all four identity groups with YPAL-like linkers, differences in linker motifs segregate with the blocks that were defined by overall identity. Some proteins with YPAL-like motifs might function differently than those with YPAL linkers. For example, the YPGV linker in E. coli CytR does not function like the YPAL linker in E. coli LacI (described above; 51). Alternatively, some YPAL-like linkers could function similarly to the YPAL linkers. For example, Franke et al. identified a sequence with a YKAL linker that binds a DNA sequence with a central CG basepair 32; thus the YRAL of Mal-A might function like YPAL. Likewise, the M found in the TreR FPAM linker might function similarly to E. coli PurR, which tolerates an “L” to “M” substitution at this position 50.
Finally, groups with non-YPAL linkers show much more sequence entropy than those with YPAL or YPAL-like linkers (Figure 4C). The non-YPAL linkers often have multiple charged residues, prolines or glycines in positions that form a helix in the YPAL linkers, and/or gaps. These features suggest that non-YPAL linkers might not have a central helical region and could simply function as flexible linkers.
Sequence/function analyses
To accommodate input constraints imposed by various sequence/function analyses, we selected a representative subset of sequences from each identity group. The goals of the sequence/function analyses were (1) to determine the effects of improving and enlarging the input sequence set; (2) to explore the strategy of specifically removing sequences with non-YPAL and YPAL-like linkers from the sequence analyses, in order to determine whether more nonconserved linker positions are identified as important; and (3) to compare predictions about importance and non-importance against existing experimental data. Four control sequence sets (Random Control 1 and 2 and Group Control 1 and 2, Table II) were designed to discriminate predictions that are specific to the presence or absence of the YPAL motif from over-sensitivity to the numbers of total sequences and/or groups (see Methods for description). Analyses included ConSurf 19,20, Evolutionary Trace Analysis 21,22, Two-Entropies Analysis – Objective, (TEA-O;14), SDPpred16, webMINER 42,43, and an implementation of the McBASC co-evolution algorithm developed by Fodor and Aldrich44-46. Results are summarized in Tables III to V. A full list of results for each method, using 3 alternative MSAs and reporting control results for MSA1, are presented in Supplementary Tables I - VIII.
One difficulty in interpreting analysis results is to identify a threshold of significance for designating “important” positions. SDPpred results are automatically thresholded. For ConSurf, most confidence is placed in positions that score 8-9. For Evolutionary Trace Analysis and TEA-O, we used a threshold of the top 25% of positions when ranked by their respective scales from most to least important. This threshold matches that of the web-based Report_Maker implementation of Evolutionary Trace Analysis. For co-evolution analysis, we rank-ordered the positions by their maximal co-evolution scores and noted which positions fell in the top 25% (see legend to Figure 6). For MINER, we report positions that showed a z-score ≤ -1.5, the most permissive score recommended by the developers of that analysis.
ConSurf and Evolutionary Trace Analysis
ConSurf 19,20 and Evolutionary Trace Analysis 21,22 are alternative algorithms that are designed to identify conserved and/or semi-conserved sequence positions from phylogenetic trees by weighting the level of conservation by the evolutionary distance between homologs. The latter helps avoid bias in the data set, such as overrepresentation of one group of homologs. Both analyses calculate a continuum of conservation scores; ConSurf results are further binned into ranks 1-9, with 9 being most conserved.
Using the [All seq] representative list of LacI/GalR sequences (Table II), ConSurf and Evolutionary Trace Analysis predict similar importance for the YPAL positions and positions 45, 50, 54, and 57 (Table III). ConSurf also identified position 61 as being highly conserved. Our results differed from those generated by the automatica versions of ConSurf and Evolutionary Trace Analysis (Table III). For ConSurf 3.0, many linker positions are ranked lower (less conserved) than when our optimized alignment was used. This difference is probably due to errors in the automated alignment. The automatic prediction generated by Evolutionary Trace Report Maker 52 differs by the addition of position 46 and the absence of position 57. The absence of position 57 could be explained by a non-optimized sequence alignment. However, a rationale for why position 46 is identified in the unoptimized 2002 sequence set remains elusive.
Removing the non-YPAL and YPAL-like sequences from [All seq] increases the ConSurf scores for positions 51, 54, 55, 58, and 62 (in addition to the increased score for position 56 that is expected since the conservation of L56 increases when non-YPAL sequences are removed; Table III). These results are not simply due to analyzing fewer sequences, since ConSurf analyses of Random Control 1 and 2 are essentially identical to the full sequence set (Supplementary Table I). Analyses with the Group Control 1 and 2 sequence sets did increase ConSurf scores for positions 54, 55, 56, and 58. Potential limitations of the Group Control sequence sets are noted in the Discussion.
Notably, positions 59, 60, and 62 have ConSurf scores of 5-6 in all analyses (Table III and Supplementary Table I). However, experiments show that mutagenesis of these positions alters repressor function, sometimes dramatically 28-30.
For Evolutionary Trace Analysis, removing the non-YPAL and YPAL-like sequences from the [All seq] set increased the importance of positions 51 and 55 (Table III). Further, the disappearance of position 45 from these linker-motif analyses reflects the fact that this position is more conserved among sequences with non-YPAL linkers than among those with YPAL linkers (Figure 4). Predicted positions from the Random and Group Control analyses are identical to those of the full sequence sets for MSA1 (Supplementary Table II), which indicates that the linker-motif analysis reveals additional, meaningful predictions with the Evolutionary Trace Analysis algorithm. Evolutionary Trace Analysis was extremely robust; predictions were insensitive to changes in the total number of input sequences, changes in the number of input sequence identity groups, or to alterations in the MSA.
TEA-O and SDPpred
TEA-O 14 and SDPpred 16 are both designed to detect positions that are more conserved within groups than between groups of a protein family (“specificity determining positions”). SDPpred requires user-defined “specificity” groups as input, whereas TEA-O attempts to remove the bias of manual definition by identifying positions that split the various levels of a phylogenetic tree. In addition, TEA-O identifies positions that are conserved between groups, simultaneously predicting positions important to several hierarchical levels (conserved, semi-conserved, and non-conserved).
For the LacI/GalR sequences representing the [All seq] set, TEA-O identification of conserved positions are in good agreement with results from ConSurf and Evolutionary Trace Analysis (Table III). Notably, TEA-O analysis with the [YPALonly] sequence set also identifies position 61 as conserved (Table III). This result is not simply due to the decreased number of analyzed sequences, since analyses with Random and Group Control sequence sets show no change as compared to those with the [All seq] representative list (Supplementary Table III). Alternative MSAs also yield identical results for the conserved positions (Supplementary Table III).
The nonconserved, specificity determining positions predicted by TEA-O include 48, 51, 52, 55, 57, and 58 (Table IV). For MSA1, positions 60 and 62 are identified by linker-motif analyses and are not identified in the Random or Group Control sequence sets. However, results for Group Control 2 differ at position 59, which is the last position in the top 25% of specificity positions; in all other cases, the rank of position 59 falls in the ∼28-35% range. Changes in the method of tree generation for Group Control 1 also move position 59 across the threshold (not shown), and positions 59 and 62 are identified when TEA-O analysis is carried out for MSA2 and MSA3 (Supplementary Table IV). These fluctuations around the threshold are probably related to the arbitrary nature of the chosen boundary, which does not emerge from a natural break in the prediction results (Figure 5A).
Table IV. Results from Analyses that Predict Important, Non-conserved Positions.
| Linker positions (LacI numbers) | |||||||||||||||||||
|---|---|---|---|---|---|---|---|---|---|---|---|---|---|---|---|---|---|---|---|
| 45 | 46 | 47 | 48 | 49 | 50 | 51 | 52 | 53 | 54 | 55 | 56 | 57 | 58 | 59 | 60 | 61 | 62 | ||
| ca | c | c | c | c | h | h | h | h | h | h | h | h | h/cb | c | c | c | c | ||
| Y | P | A | L | ||||||||||||||||
| TEA-O | top 25% of specificity scores | ||||||||||||||||||
| 2002 seq setc | T | T | T | T | T | T | |||||||||||||
| All Seq | X | X | X | X | X | X | |||||||||||||
| YPAL+YPALlike | X | X | X | X | X | X | X | X | |||||||||||
| YPALonly | X | X | X | X | X | X | X | X | |||||||||||
| SDPPred | by sequence ID groups | ||||||||||||||||||
| 2002 seq setd | S | S | S | S | S | ||||||||||||||
| All Seq | X | X | X | ||||||||||||||||
| YPAL+YPALlike | X | X | X | X | |||||||||||||||
| YPALonly | X | X | |||||||||||||||||
| SDPPred | by sequence ID blocks | ||||||||||||||||||
| All Seq | X | X | X | X | |||||||||||||||
| YPAL+YPALlike | X | X | X | X | |||||||||||||||
| YPALonly | X | X | X | ||||||||||||||||
Secondary structure: “c” coil’ “h”, helix.
The end of the helix differs in LacI and PurR49 and presumably differs in other homologs.
Predictions generated from the 2002 LacI/GalR dataset are denoted with “T” to differentiate them from predictions generated with the current, optimized sequence set (denoted “X”).
Predictions generated from the 2002 LacI/GalR dataset16 are denoted with “S” to differentiate them from predictions generated with the current, optimized sequence set (denoted “X”).
Figure 5.

Bioinformatics scores for all non-gapped positions of the LacI/GalR multiple sequence alignment. Results are shown for the [YPALonly] sequence set of MSA1. Results are similar for MSA2 and MSA3 (not shown). Scores for linker positions are shown as circles. Scores for positions with “Is”, “+/-” and “-/+” phenotypes in E. coli LacI27 are shown as triangles (see text and footnotes to Table I for explanation). Scores for all other positions are shown as “+” symbols. (A) For each position, the TEA-O “conserved” score is plotted on the X axis and the “specificity” score is plotted on the Y axis. The boxes encompass scores for positions that ranked in the top 25% of each category. Linker positions 46 and 59 are indicated; although experiments show that these positions are functionally important, they do not fall in the top 25% of either category. Several positions with phenotype changes in E. coli LacI (triangles) also fall outside of these boundaries. (B) ConSurf scores; higher scores (8, 9) indicate more conservation than lower scores. The lowest ranking linker position scores 5 in ConSurf (upper dashed line). Positions that are functionally important in E. coli LacI (triangles) have scores ranging from 2 to 9. (C) Evolutionary Trace Analysis scores; lower scores indicate more importance/conservation. The lower dashed line indicates the threshold for the top 25% of scores. If the lowest ranking linker position (position 59) defines the cutoff criterion for “functionally important” (upper dashed line), 60% of all positions are important. Several positions known to be functionally important in E. coli LacI fall outside of the 60% threshold.
Combined (Supplementary Tables III and IV), the conserved and specificity predictions from TEA-O only miss linker position 46. However, with thresholds of 25% for each of conserved and specificity ranks, this analysis is the most liberal of all the methods utilized (50% of total positions). Further, the TEA-O ranked scores show continuity with no clear threshold (Figure 5A). The original publication of this method 14 shows normalized scores for synthetic sequence sets, with clear delineation for the different categories of positions. We do not see clear delineation in the normalized (not shown) or raw scores for the LacI/GalR family. Therefore, we chose to plot the raw scores for the LacI/GalR family, because the regions of “conserved” and “specificity” positions were easier to demonstrate in this format.
SDPpred requires user-defined “specificity” groups for predicting important nonconserved positions. We ran this analysis twice for each sequence set, using both sequence identity groups (Figure 2A) and blocks (i.e. Figure 2B) to define specificity groups (Supplementary Tables V and VI). SDPpred was very sensitive to changes in the input sequences; differences were observed between predictions for all three MSAs for the [All seq] representative set, the Random Control sequences, and the Group Control sequences. In fact, block analyses of the Random and Group Controls identified two additional positions (51 and 59) not found using other sequence sets. Results in Table IV are from MSA1, which had the greatest number of predicted positions; MSA2 and 3 identified subsets of these results. The most notable result is that position 55 was nearly always identified. In addition, SDPpred analysis of blocks sometimes identified positions 46, which was missed by most other analyses. However, in the absence of pre-existing experimental data and in the context of the sensitivity to changes in input data, the reliability of these predictions would be difficult to assess.
Finally, we compared the current analyses to previous TEA-O and SDPpred results, which were based on the 2002 LacI/GalR sequence set (Tables III and IV). Both prior predictions correctly identified a greater number of important positions in the C-terminus of the linker and incorrectly identified fewer positions in the rest of the linker. Here, the imperfect 2002 sequence set might have been an advantage; inclusion of the AraR protein, with its different types of DNA binding domain and linker, might computationally emphasize the residue positions used to join the DNA-binding domain to the regulatory domain.
MINER
The MINER program identifies regions of the sequence alignment that reflect the overall phylogeny of the family 42,43. For the LacI/GalR sequences, most of the central linker helix is consistently identified by as a phylogenetic motif (Supplementary Table VII, Table V). No significant changes were seen in the results for [YPAL+YPAL-like] and [YPALonly] analyses, because changes were similar to those observed for the control datasets and alternative MSAs (Supplementary Table VII).
Table V. Results from MINER and McBASC Co-evolution Analyses.
| Linker positions (LacI numbers) | |||||||||||||||||||
|---|---|---|---|---|---|---|---|---|---|---|---|---|---|---|---|---|---|---|---|
| 45 | 46 | 47 | 48 | 49 | 50 | 51 | 52 | 53 | 54 | 55 | 56 | 57 | 58 | 59 | 60 | 61 | 62 | ||
| ca | c | c | c | c | h | h | h | h | h | h | h | h | h/cb | c | c | c | c | ||
| Y | P | A | L | ||||||||||||||||
| MINER | analyses used subsets of the short representative list (Table I); z score ≤ -1.5 | ||||||||||||||||||
| All Seq | X | X | X | X | X | X | X | X | |||||||||||
| YPAL+YPALlike | X | X | X | X | X | X | X | ||||||||||||
| YPALonly | X | X | X | X | X | X | X | X | |||||||||||
| McBASC | correlation score in top 25% | ||||||||||||||||||
| All Seq | X | X | X | X | X | X | |||||||||||||
| YPAL+YPALlike | X | X | X | X | X | ||||||||||||||
| YPALonly | X | X | X | X | X | X | |||||||||||||
Secondary structure: “c” coil’ “h”, helix.
The end of the helix differs in LacI and PurR49 and presumably differs in other homologs.
Co-evolution Analysis
Co-evolution analysis is predicated on the assumption that co-evolving positions have related functional or structural roles (e.g. 15,44-46,53). Co-evolving positions must be semi-conserved; conserved positions do not change and thus do not co-evolve; nonconserved neutral positions are in theory free to evolve with no constraints. A number of different algorithms have been devised to detect co-evolving positions (many are summarized in references44 and 15). Alternative methods appear to filter different levels of co-evolution and conservation44. Since a comparative survey of the different methods is beyond the scope of the current work, we limited our calculations to the McBASC implementation by Fodor and Aldrich44-46. Co-evolving linker residues, with each other or with other regions of the protein, are reported in Supplementary Table VIII, Table V, and Figure 6. For analysis of the [All seq] dataset, McBASC results are very similar to that of ConSurf, Evolutionary Trace Analysis, and the conserved predictions of TEA-O; the most striking difference is that McBASC does not identify position 47 for MSA1 and MSA2, which is highly conservedb. For [YPALonly] analyses, the conserved positions P49, A53, and L56 do not co-evolve with any other positions (as expected), whereas three new linker positions – 52, 55, and 61 – are added to the list. In the [YPALonly] dataset, none of the linker positions show strong correlation with other linker positions (Figure 6).
Figure 6.

Summary of McBASC co-evolution results. Co-evolution analyses generate (n-1) scores for all n positions of a multiple sequence alignment. We determined the maximal score for each position and then identified the top 25% of positions with the highest co-evolution scores. This corresponded to values of 0.365 for [All seq] and 0.425 for [YPALonly], which we set as thresholds for showing co-evolution on the plot. Linker positions that fell into this category are plotted on the Y axis, and the X axis represents their co-evolving positions. The intensity of co-evolution scores are shown in shades of gray, with black representing the strongest co-evolving positions. The top plot was determined for the [All seq] dataset of MSA1. The bottom plot was determined for the [YPALonly] dataset of MSA1. YPAL position Y47 does not appear in either plot because this position is highly conserved in all sequences. Note that the other YPAL positions strongly correlate with each other. YPAL positions P49, A53, and L56 do not have co-evolution partners in the lower panel because they are perfectly conserved in the [YPALonly] dataset. Surprisingly, the linker positions do not strongly co-evolve with other linker positions in the [YPALonly] dataset.
Discussion
The huge body of experimental work available for LacI/GalR homologs – prominently the phenotypes generated for the 4000 variants of LacI27 – provides opportunity to rigorously compare results from sequence/function analyses to experiment. Most prior studies compared whether predicted positions were supported by experimental data (evaluation of true positives). Here, we turn the question around and investigate where experimentally important positions rank in the predictions. This viewpoint allows us to detect false negative predictions.
Ideally, we would also use experimental data to assess the rates of false positive/true negative predictions. Previous studies have defined “important” subsets of the LacI positions – such as those that directly contact ligand – in order to perform such assessments. However, experiments show that these assumptions leave out many important positions. A false positive prediction can only occur for a neutral (functionally non-important) position. As we noted in 30, in the context of a multiple sequence analysis, a neutral position is defined by the characteristic that it is insensitive to many amino acid substitutions in multiple homologs. In fact, to the best of our knowledge, experimental data for evaluating the rate of false positive predictions do not currently exist for any protein family. Neutral substitutions are known for some positions for a few (typically only 2) amino acids, but we have found no experimental documentation for neutral positions. Thus, we do not attempt such analyses and we refrain from using imperfect estimates. Long-term, we plan to generate experimental data that will allow assessing the false positive prediction rate.
Defining “function”
One of the least understood aspects of sequence/function analyses is the definition of “function”. Many analyses are presumed to identify positions that lead to alternative ligand specificities, and predicted positions have been termed “specificity determinants”. However, we find this definition to be too narrow. Evolving proteins can indeed acquire altered specificity but might also encounter conditions in which altered ligand affinity, allosteric response, or catalytic rates are beneficial. All of these changes must be reflected in the sequences of naturally occurring homologs. Thus, we refer to predicted positions as “functionally important”.
Experiments are underway to assign functional roles to each linker position in the LacI/GalR homologs, in order to determine whether a particular type of functional role correlates with a particular type of analysis. Results published to date are summarized in Table I and support the expanded viewpoint described above. For example, position 55 was predicted to be a specificity determinant by several analyses (Tables III, IV, and V), but for at least one homolog, amino acid substitutions alter only the affinity of DNA binding, not allostery or which ligand is most preferred54. In contrast, position 61 is only occasionally predicted to be functionally important (Tables III, IV, and V), but experiments have shown dramatic outcomes on specificity, affinity, and allostery from amino acid substitutions at this position54.
Likewise, we have not observed any correlation between the degree of functional change and the type (or robustness) of prediction. Experiments show that different amino acids substitutions at a given position can have a range of functional impact (Table I). For well-conserved positions, such as Y47, one would expect that “wild-type” function would occur with only the conserved amino acid (or highly similar, here F) and that other substitutions would abolish function. However, note that several LacI/GalR nonconserved positions (i.e. 58, 59, 60, and 62) that are weakly or non-predicted by analyses are also affected by many different amino acid substitutions (Table I), sometimes quite dramatically.
A final variable that must be considered is the experimental threshold for a biological effect. Evolution of naturally-occurring proteins occurs in the presence of selective pressure; most of the observed sequence changes are presumed to contribute to a beneficial functional difference or be neutral. Laboratory mutations are not subject to selective pressure. Nevertheless, previous and ongoing experiments indicate that the observed functional changes on LacI/GalR homologs are large enough to impact growth of the organism (in this case, E. coli) under physiologically relevant conditions (unpublished results).
Performance of sequence/function analyses and knowledge-based sequence sorting
In the current study, no single analysis method predicted all functionally important linker positions. Some of the analyses in this study are designed to identify only conserved and/or semi-conserved positions, and thus are not expected to identify all positions. Other analyses filter positions in ways that we do not yet fully understand. For positions in the LacI/GalR linkers, different analyses do not appear to correlate with different aspects of experimental function (see above and Table I). Overall, predictions of conserved and semi-conserved positions are in good agreement with each other, whereas methods to identify important nonconserved residues were more disparate. Position 46 was only identified by SDPpred, and this technique did not perform well with the control sequence sets. In the absence of previous experimental knowledge, we might have been tempted to dismiss this as a false positive. In addition, most variations of the various analyses failed to identify position 59.
One of our driving hypotheses was that removing non-YPAL linkers from analyses might unmask nonconserved positions that are specifically important in the YPAL linkers. A similar strategy was recently used to successfully identify important positions in the psychoactive bioamine receptors using Evolutionary Trace Analysis25. This approach was somewhat successful for the LacI/GalR proteins, increasing the number of linker positions identified by ConSurf, Evolutionary Trace Analysis, TEA-O, and McBASC (Tables III, IV, and V). In fact, position 60 would not have otherwise been identified as important. We expect that this approach will be broadly applicable to other protein families.
Theoretically, a given protein family could be divided by any of several functional criteria. The presence or absence of the associated sequence motifs might mirror the phylogenetic tree (hierarchical) or might have evolved several independent times (non-hierarchical). These alternative organizations should alter the strategy of sequence/function analyses. For the hierarchical case, separate analyses might first identify semi-conserved residues that divide the larger family; subsequent analyses with only one tree branch might identify less-conserved, important positions. Several research groups have considered hierarchical analyses (e.g. 14,23-25). For a protein family with non-hierarchical functional motifs (those that have evolved multiple times)c, repeated analyses could be performed for the same dataset divided multiple ways by the alternative criteria. Each variation of the analysis might reveal different important aspects of the protein sequence.
Limitations of the Group Control analyses
The performance of Random and Group Controls were key to evaluating the success of knowledge-based sequence sorting strategy. The criteria for creating the Group Control datasets were to simultaneously match (1) the numbers of sequences and the number of identity groups with the linker-motif sequence subsets (Table II; [YPAL+YPALlike], [YPALonly]), and (2) the distribution of various linker types found in the full sequence set.
Linker results for ConSurf, Evolutionary Trace Analysis, TEA-O, and McBASC were almost perfectly insensitive to randomly removing sequences. However, several analyses showed some sensitivity to removing the sequences of the Group Control 1 and 2 datasets (Supplementary Tables). Thus, some analyses might be over-sensitive to removing sequence identity groups, and analyses with [YPAL] subsets might not generate meaningful results. However, the current dataset has more than twice as many sequence identity groups as the 2002 LacI/GalR dataset (34 versus 15). Even removing 12 groups for [YPAL only] analyses creates a larger dataset than prior studies, and the remaining groups generally have <30% sequence identity with other remaining groups, similar to the full dataset (Figure 2A). The current LacI/GalR dataset is also probably much larger than datasets available for other protein families. Thus, if analyses are over-sensitive to the number of sequence identity groups, most prior analyses with the affected algorithms would be suspect.
Alternatively, the results from the Group Control analyses might not reflect a failure of the analysis programs. Instead, we might have inadvertently used sequences that were biased towards a second, relevant division of the sequence data. Each identity group could have special characteristics, apart from the YPAL motif, that influence the results. For example, the CcpA identity group is very large yet has one of the most conserved linkers (Figure 4A); the AscG identity group might have high sequence entropy in the C-terminus of the linker (Figure 4A) because it has no allosteric functional constraint55,56; some sequences in the PurR and RbsR-A identity groups have an inserted “Y” adjacent to Y47 of the YPAL (Figure 4A, legend and Supplementary Figure); each YPAL-like identity group (Figure 4B) is unique in a different way. One can easily imagine similar scenarios for positions in the rest of the protein that would alter the analysis results. In constructing the Group Control datasets, we might have randomly removed sequence identity groups that truly alter predictions. Unfortunately, in the absence of additional concrete functional data, trying to guess which groups might bias analyses is inappropriate; removing each of the 34 groups one-by-one would require a prohibitive time commitment.
The majority of positions in the LacI/GalR family are important
Many previous studies validated their predictions about functionally-important positions by comparing to the phenotypic data known for E. coli LacI. Here, we wish to know what types of predictions are generated for all LacI positions that perform functional roles. Of the analyses used in the current study, TEA-O is designed to identify both conserved and specificity determining positions and can therefore be directly compared to the experimental data (Figure 5A). Although ConSurf and Evolutionary Trace Analysis are designed to identify conserved positions, these two analyses also generate predictions for all positions in the MSA. Therefore, we also compared the respective results to functional data (Figure 5B,C).
In choosing the functional positions, we refrained from using proximity to ligand as a surrogate marker for functional importance. Instead, we identified all LacI positions for which at least four amino acid substitutions result in Is, “+ -”, and/or “- +” phenotypes 27; phenotype definitions are in the Table I footnotes. This set of phenotypes constitutes an extremely conservative definitiond, which ensures that the functional impact of the position is fairly dramatic and, importantly, the measureable repression indicates that protein is expressed and folded. In the linker region, we compared additional phenotypic data that was generated for engineered homologs and biochemical data for the chimeras and E. coli LacI (Table I). Note that phenotypic studies of the chimera variants directly confirm the presence of folded, active repressor protein 28,30.
The threshold for comparison of TEA-O results with functional data was the top 25% rank of “conserved” positions. This cutoff matches that of Evolutionary Trace Report_Maker. Utilizing the 25% criterion for both TEA-O Conservation and Specificity positions, a minimum of 50% of the positions are functionally important for the protein architecture (Figure 5A). Presumably, the linker positions that are missed by this analysis in MSA1 (46 and 59) have similar properties to other important positions throughout the protein (Figure 5A). In support of this extrapolation, experimental data for full-length LacI27 shows that a number of functionally important positions do not fall into either TEA-O category (Figure 5A, triangles).
ConSurf ranks the functionally important C-terminus of the linker as having intermediate conservation scores of 5-6. In total, 67% of the protein sequence positions rank a 5 or above in the YPALonly analysis (Figure 5B). Experimental data for E. coli LacI positions that show functional change with mutagenesis encompass a wide range of ConSurf scores, from 2 to 9 (Figure 5B, triangles).
Finally, using the lowest ranking linker position to define the cutoff in Evolutionary Trace Analysis, at least 60% of the positions are important (Figure 5C). Other LacI positions with known functional phenotypes occur beyond this generous cutoff (Figure 5C, triangles). Consistent with results for the LacI/GalR family, a recent implementation of Evolutionary Trace Analysis used a cutoff of the top 40% of predicted positions of the bioamine receptor homologs; results were confirmed experimentally 25.
Conclusion
Repeating sequence/function analyses with an improved LacI/GalR dataset did not resolve all the discrepancies observed between prediction and experiment. Indeed, we were surprised that the punctuate nature of the sequence identity groups (Figure 2A) does not translate into an obvious threshold between classes of positions in sequence/function analyses. In fact, no clear threshold was observed for any of the analyses that report full prediction sets (Figure 5). Several alternatives might be invoked to explain the discrepancy between predictions and experiment:
First, sequence data might not contain the necessary information for identifying all functionally important positions; indeed, epistasis in the proteins could make it meaningless to assign a specific functional role to each column of an MSA. Therefore, sequence/function analyses will never fully succeed. We hope this pessimistic option is not true, because science would be left to separately characterize each protein polymorphism. However, the broad range of sequence identities across the LacI/GalR family might be too low to extract meaningful information. The current dataset matches the breadth of the original data, including the CcpA and TreR identity groups that are very far apart in sequence identity space. More meaningful analyses might come from separately analyzing each sequence identity group. Unfortunately, that strategy still expands the number of proteins that must be experimentally characterized, to at least one per sequence identity group: Analyses are predicated on the idea that, if one homolog has a characterized function, features of homologs can be inferred from sequence alignments.
A second possibility is that E. coli LacI has more functionally contributing positions than other LacI/GalR members. However, at least two other homolog linkers have the same functionally important positions, although they alter function to different extents 30. In fact, when we swapped positions between pairs of homolog linkers, all positions had to be exchanged in order to perfectly recapitulate function30. We cannot exclude the idea that all LacI/GalR homologs have a greater number of functional positions than other protein families, but it seems unlikely that this family is unique.
A third possibility is that the current cut-off thresholds for predicting “important” positions are too high and excludes relevant positions. Comparison of E. coli LacI experimental data (Figure 5) suggest an extreme limit for this possibility – the number of functionally neutral positions might be very small. To our knowledge, such positions have never been experimentally demonstrated for any protein family, including LacI/GalR. Perhaps an easier signature for sequence/function analyses would be to find the nonconserved, neutral positions. Such sites may not be as informative for protein engineering, but many patients could be comforted by knowing that polymorphisms at these positions are probably not a concern.
Finally, analyses might benefit from improving the underlying assumptions about the sequence/function relationship. For example, the use of physicochemical similarity matrices for amino acid substitutions might not always be appropriate. Indeed, we have evidence from experiments in the linker that “similar” substitutions such as I48L can have dramatic functional outcomes 28,29. Another possible over-simplification of analysis algorithms could arise from automatically removing sequences with “high” identity.
To date, sequence/function analyses have been used to guide mutations that partially exchange protein functions (i.e. 25,57). The current results support the strategy of using multiple analyses and multiple variations of the analyses, using both knowledge-based sorting and analyses with built-in hierarchies. Further advancement of sequence/function analyses may require additional experimental knowledge of the sequence/function relationship in protein families. It will be very interesting to uncover the remaining rules used by nature to evolve new protein functions.
Supplementary Material
Acknowledgments
This work was supported by a grant from the National Institute of Health to LSK (GM079423). We thank members of the Swint-Kruse lab for assistance in curating the sequence set and comments on the manuscript. We thank Drs. Susan Egan (KU-Lawrence), Sarah Bondos (Texas A&M Health Science Center) and Aron Fenton (KUMC) for comments on the manuscript.
Footnotes
The automatic” versions of ConSurf and Evolutionary Trace are web-implementations that require only one input sequence and/or structure. Each program then automatically searches for a limited number of homologs (usually a few hundred) and creates a multiple sequence alignment that is not manually optimized.
McBASC of MSA3 [All seq] does identify position 47 for this data set (Supplementary Table VIII).
Preliminary phylogenetic analyses of the LacI/GalR family (not shown) indicate that the YPAL linker motif is nonhierarchical and has evolved at least twice. Notably, the CytR identity group contains both YPAL and non-YPAL sequences and so must comprise at least one separate evolutionary event from the rest of the sequences containing non-YPAL linkers.)
In choosing these positions, we exclude a large number of positions with I- substitutions, which do not repress. However, for substitutions with an I- phenotype, we cannot distinguish between lost function and lost protein expression/folding. We further note that the study by the Miller lab was not designed to detect any mutation that enhanced repression or required an altered the concentration of metabolite needed for allosteric response. Both of these functional changes have been detected in our experiments with chimeric LacI/GalR repressors when mutating linker positions.
References
- 1.Arnaud CH. DNA sequencing forges ahead. Chemical & Engineering News. 2009;87:16–19. [Google Scholar]
- 2.Fischer JD, Mayer CE, Soding J. Prediction of protein functional residues from sequence by probability density estimation. Bioinformatics. 2008;24:613–620. doi: 10.1093/bioinformatics/btm626. [DOI] [PubMed] [Google Scholar]
- 3.Dukka Bahadur KC, Livesay DR. Improving position-specific predictions of protein functional sites using phylogenetic motifs. Bioinformatics. 2008;24:2308–2316. doi: 10.1093/bioinformatics/btn454. [DOI] [PubMed] [Google Scholar]
- 4.Pei J, Cai W, Kinch LN, Grishin NV. Prediction of functional specificity determinants from protein sequences using log-likelihood ratios. Bioinformatics. 2006;22:164–171. doi: 10.1093/bioinformatics/bti766. [DOI] [PubMed] [Google Scholar]
- 5.Pazos F, Rausell A, Valencia A. Phylogeny-independent detection of functional residues. Bioinformatics. 2006;22:1440–1448. doi: 10.1093/bioinformatics/btl104. [DOI] [PubMed] [Google Scholar]
- 6.Kalinina OV, Novichkov PS, Mironov AA, Gelfand MS, Rakhmaninova AB. SDPpred: a tool for prediction of amino acid residues that determine differences in functional specificity of homologous proteins. Nucleic Acids Res. 2004;32:424–428. doi: 10.1093/nar/gkh391. [DOI] [PMC free article] [PubMed] [Google Scholar]
- 7.Manning J, Jefferson E, Barton G. The contrasting properties of conservation and correlated phylogeny in protein functional residue prediction. BMC Bioinformatics. 2008;9:51. doi: 10.1186/1471-2105-9-51. [DOI] [PMC free article] [PubMed] [Google Scholar]
- 8.Lee B, Park K, Kim D. Analysis of the residue-residue coevolution network and the functionally important residues in proteins. Proteins: Structure, Function, and Bioinformatics. 2008;72:863–872. doi: 10.1002/prot.21972. [DOI] [PubMed] [Google Scholar]
- 9.Bromberg Y, Yachdav G, Rost B. SNAP predicts effect of mutations on protein function. Bioinformatics. 2008;24:2397–2398. doi: 10.1093/bioinformatics/btn435. [DOI] [PMC free article] [PubMed] [Google Scholar]
- 10.Kuipers RKP, Joosten HJ, Verwiel E, Paans S, Akerboom J, van der Oost J, Leferink NGH, van Berkel WJH, Vriend G, Schaap PJ. Correlated mutation analyses on super-family alignments reveal functionally important residues. Proteins: Structure, Function, and Bioinformatics. 2009;76:608–616. doi: 10.1002/prot.22374. [DOI] [PubMed] [Google Scholar]
- 11.Donald JE, Shakhnovich EI. Predicting specificity-determining residues in two large eukaryotic transcription factor families. Nucl Acids Res. 2005;33:4455–4465. doi: 10.1093/nar/gki755. [DOI] [PMC free article] [PubMed] [Google Scholar]
- 12.Ye K, Feenstra AK, Heringa J, Ijzerman AP, Marchiori E. Multi-RELIEF: a method to recognize specificity determining residues from multiple sequence alignments using a Machine-Learning approach for feature weighting. Bioinformatics. 2008;24:18–25. doi: 10.1093/bioinformatics/btm537. [DOI] [PubMed] [Google Scholar]
- 13.Sankararaman S, Sjolander K. INTREPID - INformation-theoretic TREe traversal for Protein functional site IDentification. Bioinformatics. 2008;24:2445–2452. doi: 10.1093/bioinformatics/btn474. [DOI] [PMC free article] [PubMed] [Google Scholar]
- 14.Ye K, Vriend G, Ijzerman AP. Tracing evolutionary pressure. Bioinformatics. 2008;24:908–915. doi: 10.1093/bioinformatics/btn057. [DOI] [PubMed] [Google Scholar]
- 15.Yip KY, Patel P, Kim PM, Engelman DM, McDermott D, Gerstein M. An integrated system for studying residue coevolution in proteins. Bioinformatics. 2008;24:290–292. doi: 10.1093/bioinformatics/btm584. [DOI] [PubMed] [Google Scholar]
- 16.Kalinina OV, Mironov AA, Gelfand MS, Rakhmaninova AB. Automated selection of positions determining functional specificity of proteins by comparative analysis of orthologous groups in protein families. Protein Sci. 2004;13:443–456. doi: 10.1110/ps.03191704. [DOI] [PMC free article] [PubMed] [Google Scholar]
- 17.Chakrabarti S, Panchenko AR. Coevolution in defining the functional specificity. Proteins: Structure, Function, and Bioinformatics. 2009;75:231–240. doi: 10.1002/prot.22239. [DOI] [PMC free article] [PubMed] [Google Scholar]
- 18.Chiu HC, Chang CA, Hu YJ. Prediction of orthologous relationship by functionally important sites. Computer Methods and Programs in Biomedicine. 2005;78:209–222. doi: 10.1016/j.cmpb.2005.03.002. [DOI] [PubMed] [Google Scholar]
- 19.Landau M, Mayrose I, Rosenberg Y, Glaser F, Martz E, Pupko T, Ben-Tal N. ConSurf 2005: the projection of evolutionary conservation scores of residues on protein structures. Nucleic Acids Res. 2005;33:W299–302. doi: 10.1093/nar/gki370. [DOI] [PMC free article] [PubMed] [Google Scholar]
- 20.Ashkenazy H, Erez E, Martz E, Pupko T, Ben-Tal N. ConSurf 2010: calculating evolutionary conservation in sequence and structure of proteins and nucleic acids. Nucleic Acids Res. 2010;38(Suppl):W529–533. doi: 10.1093/nar/gkq399. [DOI] [PMC free article] [PubMed] [Google Scholar]
- 21.Lichtarge O, Bourne HR, Cohen FE. An Evolutionary Trace Method Defines Binding Surfaces Common to Protein Families. Journal of Molecular Biology. 1996;257:342. doi: 10.1006/jmbi.1996.0167. [DOI] [PubMed] [Google Scholar]
- 22.Morgan DH, Kristensen DM, Mittelman D, Lichtarge O. ET viewer: an application for predicting and visualizing functional sites in protein structures. Bioinformatics. 2006;22:2049–2050. doi: 10.1093/bioinformatics/btl285. [DOI] [PubMed] [Google Scholar]
- 23.La D, Sutch B, Livesay DR. Predicting protein functional sites with phylogenetic motifs. Proteins: Structure, Function, and Bioinformatics. 2005;58:309–320. doi: 10.1002/prot.20321. [DOI] [PubMed] [Google Scholar]
- 24.Kalinina O, Gelfand M, Russell R. Combining specificity determining and conserved residues improves functional site prediction. BMC Bioinformatics. 2009;10:174. doi: 10.1186/1471-2105-10-174. [DOI] [PMC free article] [PubMed] [Google Scholar]
- 25.Rodriguez GJ, Yao R, Lichtarge O, Wensel TG. Evolution-guided discovery and recoding of allosteric pathway specificity determinants in psychoactive bioamine receptors. Proceedings of the National Academy of Sciences. 2010;107:7787–7792. doi: 10.1073/pnas.0914877107. [DOI] [PMC free article] [PubMed] [Google Scholar]
- 26.Zhan H, Swint-Kruse L, Matthews KS. Extrinsic Interactions Dominate Helical Propensity in Coupled Binding and Folding of the Lactose Repressor Protein Hinge Helix. Biochemistry. 2006;45:5896–5906. doi: 10.1021/bi052619p. [DOI] [PMC free article] [PubMed] [Google Scholar]
- 27.Suckow J, Markiewicz P, Kleina LG, Miller J, Kisters-Woike B, Müller-Hill B. Genetic studies of the Lac repressor. XV: 4000 single amino acid substitutions and analysis of the resulting phenotypes on the basis of the protein structure. J Mol Biol. 1996;261:509–523. doi: 10.1006/jmbi.1996.0479. [DOI] [PubMed] [Google Scholar]
- 28.Meinhardt S, Swint-Kruse L. Experimental identification of specificity determinants in the domain linker of a LacI/GalR protein: bioinformatics-based predictions generate true positives and false negatives. Proteins. 2008;73:941–957. doi: 10.1002/prot.22121. [DOI] [PMC free article] [PubMed] [Google Scholar]
- 29.Tungtur S, Egan SM, Swint-Kruse L. Functional consequences of exchanging domains between LacI and PurR are mediated by the intervening linker sequence. Proteins. 2007;68:375–388. doi: 10.1002/prot.21412. [DOI] [PMC free article] [PubMed] [Google Scholar]
- 30.Tungtur S, Meinhardt S, Swint-Kruse L. Comparing the Functional Roles of Nonconserved Sequence Positions in Homologous Transcription Repressors: Implications for Sequence/Function Analyses. Journal of Molecular Biology. 2010;395:785–802. doi: 10.1016/j.jmb.2009.10.001. [DOI] [PMC free article] [PubMed] [Google Scholar]
- 31.Mirny LA, Gelfand MS. Using orthologous and paralogous proteins to identify specificity-determining residues in bacterial transcription factors. Journal of Molecular Biology. 2002;321:7–20. doi: 10.1016/s0022-2836(02)00587-9. [DOI] [PubMed] [Google Scholar]
- 32.Francke C, Kerkhoven R, Wels M, Siezen RJ. A generic approach to identify Transcription Factor-specific operator motifs; Inferences for LacI-family mediated regulation in Lactobacillus plantarum WCFS1. BMC Genomics. 2008;9:145. doi: 10.1186/1471-2164-9-145. [DOI] [PMC free article] [PubMed] [Google Scholar]
- 33.Altschul SF, Madden TL, Schaffer AA, Zhang J, Zhang Z, Miller W, Lipman DJ. Gapped BLAST and PSI-BLAST: a new generation of protein database search programs. Nucleic Acids Res. 1997;25:3389–3402. doi: 10.1093/nar/25.17.3389. [DOI] [PMC free article] [PubMed] [Google Scholar]
- 34.Larkin MA, Blackshields G, Brown NP, Chenna R, McGettigan PA, McWilliam H, Valentin F, Wallace IM, Wilm A, Lopez R, Thompson JD, Gibson TJ, Higgins DG. Clustal W and Clustal X version 2.0. Bioinformatics. 2007;23:2947–2948. doi: 10.1093/bioinformatics/btm404. [DOI] [PubMed] [Google Scholar]
- 35.Hall TA. BioEdit: a user-friendly biological sequence alignment editor and analysis program for Windows 95/98/NT. Nucl Acids Symp Ser. 1999;41:95–98. [Google Scholar]
- 36.Edgar RC. MUSCLE: multiple sequence alignment with high accuracy and high throughput. Nucleic Acids Res. 2004;32:1792–1797. doi: 10.1093/nar/gkh340. [DOI] [PMC free article] [PubMed] [Google Scholar]
- 37.Shindyalov IN, Bourne PE. Protein structure alignment by incremental combinatorial extension (CE) of the optimal path. Protein Eng. 1998;11:739–747. doi: 10.1093/protein/11.9.739. [DOI] [PubMed] [Google Scholar]
- 38.Hars U, Horlacher R, Boos W, Welte W, Diederichs K. Crystal structure of the effector-binding domain of the trehalose-repressor of Escherichia coli, a member of the LacI family, in its complexes with inducer trehalose-6-phosphate and noninducer trehalose. Protein Sci. 1998;7:2511–2521. doi: 10.1002/pro.5560071204. [DOI] [PMC free article] [PubMed] [Google Scholar]
- 39.Bell CE, Lewis M. A closer view of the conformation of the Lac repressor bound to operator. Nat Struct Biol. 2000;7:209–214. doi: 10.1038/73317. [DOI] [PubMed] [Google Scholar]
- 40.Schumacher MA, Glasfeld A, Zalkin H, Brennan RG. The X-ray structure of the PurR-guanine-purF operator complex reveals the contributions of complementary electrostatic surfaces and a water-mediated hydrogen bond to corepressor specificity and binding affinity. J Biol Chem. 1997;272:22648–22653. doi: 10.1074/jbc.272.36.22648. [DOI] [PubMed] [Google Scholar]
- 41.Schumacher MA, Allen GS, Diel M, Seidel G, Hillen W, Brennan RG. Structural basis for allosteric control of the transcription regulator CcpA by the phosphoprotein HPr-Ser46-P. Cell. 2004;118:731–741. doi: 10.1016/j.cell.2004.08.027. [DOI] [PubMed] [Google Scholar]
- 42.La D, Livesay DR. Predicting functional sites with an automated algorithm suitable for heterogeneous datasets. BMC Bioinformatics. 2005;6:116. doi: 10.1186/1471-2105-6-116. [DOI] [PMC free article] [PubMed] [Google Scholar]
- 43.La D, Livesay DR. MINER: software for phylogenetic motif identification. Nucleic Acids Res. 2005;33:W267–270. doi: 10.1093/nar/gki465. [DOI] [PMC free article] [PubMed] [Google Scholar]
- 44.Fodor AA, Aldrich RW. Influence of conservation on calculations of amino acid covariance in multiple sequence alignments. Proteins: Struct Funct Bioinformatics. 2004;56:211–221. doi: 10.1002/prot.20098. [DOI] [PubMed] [Google Scholar]
- 45.Olmea O, Rost B, Valencia A. Effective use of sequence correlation and conservation in fold recognition. Journal of Molecular Biology. 1999;293:1221–1239. doi: 10.1006/jmbi.1999.3208. [DOI] [PubMed] [Google Scholar]
- 46.Gobel U, Sander C, Schneider R, Valencia A. Correlated mutations and residue contacts in proteins. Proteins. 1994;18:309–317. doi: 10.1002/prot.340180402. [DOI] [PubMed] [Google Scholar]
- 47.Huson DH, Richter DC, Rausch C, Dezulian T, Franz M, Rupp R. Dendroscope: An interactive viewer for large phylogenetic trees. BMC Bioinformatics. 2007;8:460. doi: 10.1186/1471-2105-8-460. [DOI] [PMC free article] [PubMed] [Google Scholar]
- 48.Junier T, Zdobnov EM. The Newick utilities: high-throughput phylogenetic tree processing in the Unix shell. Bioinformatics. 2010;26:1669–1670. doi: 10.1093/bioinformatics/btq243. [DOI] [PMC free article] [PubMed] [Google Scholar]
- 49.Swint-Kruse L, Larson C, Pettitt BM, Matthews KS. Fine-tuning function: correlation of hinge domain interactions with functional distinctions between LacI and PurR. Protein Sci. 2002;11:778–794. doi: 10.1110/ps.4050102. [DOI] [PMC free article] [PubMed] [Google Scholar]
- 50.Arvidson DN, Lu F, Faber C, Zalkin H, Brennan RG. The structure of PurR mutant L54M shows an alternative route to DNA kinking. Nat Struct Biol. 1998;5:436–441. doi: 10.1038/nsb0698-436. [DOI] [PubMed] [Google Scholar]
- 51.Tretyachenko-Ladokhina V, Cocco MJ, Senear DF. Flexibility and Adaptability in Binding of E. coli Cytidine Repressor to Different Operators Suggests a Role in Differential Gene Regulation. Journal of Molecular Biology. 2006;362:271–286. doi: 10.1016/j.jmb.2006.06.085. [DOI] [PubMed] [Google Scholar]
- 52.Mihalek I, Res I, Lichtarge O. Evolutionary trace report_maker: a new type of service for comparative analysis of proteins. Bioinformatics. 2006;22:1656–1657. doi: 10.1093/bioinformatics/btl157. [DOI] [PubMed] [Google Scholar]
- 53.Suel GM, Lockless SW, Wall MA, Ranganathan R. Evolutionarily conserved networks of residues mediate allosteric communication in proteins. Nat Struct Biol. 2003;10:59–69. doi: 10.1038/nsb881. [DOI] [PubMed] [Google Scholar]
- 54.Zhan H, Taraban M, Trewhella J, Swint-Kruse L. Subdividing repressor function: DNA binding affinity, selectivity, and allostery can be altered by amino acid substitution of nonconserved residues in a LacI/GalR homologue. Biochemistry. 2008;47:8058–8069. doi: 10.1021/bi800443k. [DOI] [PMC free article] [PubMed] [Google Scholar]
- 55.Ishida Y, Kori A, Ishihama A. Participation of regulator AscG of the beta-glucoside utilization operon in regulation of the propionate catabolism operon. J Bacteriol. 2009;191:6136–6144. doi: 10.1128/JB.00663-09. [DOI] [PMC free article] [PubMed] [Google Scholar]
- 56.Hall BG, Xu L. Nucleotide sequence, function, activation, and evolution of the cryptic asc operon of Escherichia coli K12. Mol Biol Evol. 1992;9:688–706. doi: 10.1093/oxfordjournals.molbev.a040753. [DOI] [PubMed] [Google Scholar]
- 57.Yin Y, Kirsch JF. Identification of functional paralog shift mutations: Conversion of Escherichia coli malate dehydrogenase to a lactate dehydrogenase. Proceedings of the National Academy of Sciences. 2007;104:17353–17357. doi: 10.1073/pnas.0708265104. [DOI] [PMC free article] [PubMed] [Google Scholar]
- 58.Pettersen EF, Goddard TD, Huang CC, Couch GS, Greenblatt DM, Meng EC, Ferrin TE. UCSF Chimera--a visualization system for exploratory research and analysis. J Comput Chem. 2004;25:1605–1612. doi: 10.1002/jcc.20084. [DOI] [PubMed] [Google Scholar]
- 59.Crooks GE, Hon G, Chandonia JM, Brenner SE. WebLogo: A Sequence Logo Generator. Genome Research. 2004;14:1188–1190. doi: 10.1101/gr.849004. [DOI] [PMC free article] [PubMed] [Google Scholar]
Associated Data
This section collects any data citations, data availability statements, or supplementary materials included in this article.